|
|
||||||
|
|

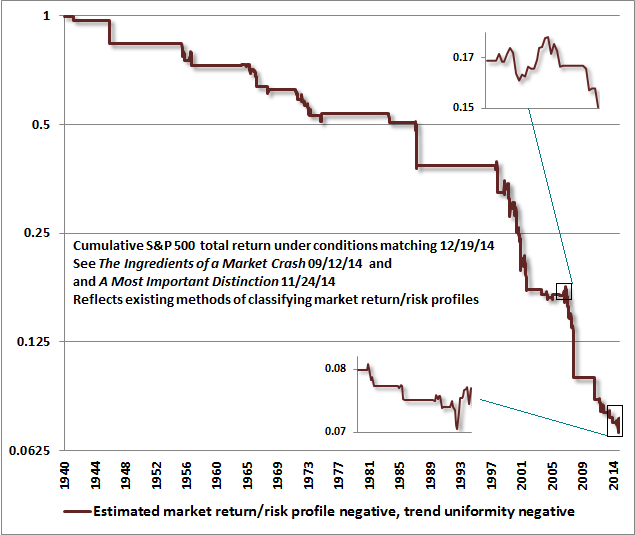
December 22, 2014 Iceberg at the Starboard Bow “I cannot imagine any condition which would cause a ship to founder. I cannot conceive of any vital disaster happening to this vessel. Modern shipbuilding has gone beyond that.” “One reason that risk premiums may be low is precisely because the environment is less risky... The Fed has long focused on ensuring that banks hold adequate capital and that they carefully monitor and manage risks. As a consequence, banks are well-positioned to weather the financial turmoil.” What was the difference between the Titanic that left Southampton with all of the advantages and technology of modern shipbuilding, and the Titanic that plunged to the bottom of the Atlantic – still carrying all of the advantages of modern shipbuilding? Just one condition, really: a hole in the side of the ship. But distinctions matter. One of our central themes in recent months is that – departing from what we’ve observed for most of the advance in recent years – market internals and credit spreads have deteriorated materially (see The Ingredients of a Market Crash). Particularly since late-2011, extreme overvalued, overbought, overbullish syndromes have persisted without significant corrections, despite the historical tendency for those same syndromes to devolve rather quickly into severe market losses. What follows is the primary lesson we’ve drawn from our own struggle with this. I am going to repeat it again because even a few days of strong market action make it easy to forget. My hope is that those who value our work will find it useful in placing the recent cycle in perspective. Moreover, it provides a consistent framework to understand the bubbles and crashes that have manifested over the past 15 years, and the behavior of market cycles across history. Market history, including the series of bubbles and crashes over the past 15 years, does not teach that valuation is irrelevant, but instead that a key distinction affects whether stability or instability is likely to prevail. When rich valuations are coupled with tame credit spreads and uniform strength across a broad range of market internals and security types, one can infer that investors remain tolerant toward risk. In that environment, risk premiums may be low, but there’s no particular pressure for them to normalize, even if the speculation is driven by mindless yield-seeking. Trend uniformity and well-behaved credit spreads are an indication of risk tolerance, which allows overvalued markets to remain overvalued without immediate consequence. In stark contrast, increasing dispersion across securities and sectors, deteriorating market internals, and widening credit spreads are all subtle but observable indications of growing risk aversion – icebergs that can easily rupture the Titanic of severe overvaluation. Monetary easing then no longer supports risky assets, because risk-free liquidity is no longer seen as an inferior asset. This risk-aversion creates upward pressure on low risk premiums, which normalize not smoothly but in spikes, resulting in air-pockets, free-falls and crashes. As warned in October 2000, “when the market loses that uniformity, valuations often matter suddenly and with a vengeance. This is a lesson best learned before a crash rather than after one.” I offered the same warning just as Janet Yellen was making her dismissive remarks about low risk premiums in 2007 (see Market Internals Go Negative). With regard to our own experience in recent years, the conditional tolerance for extreme overvaluation and overextended conditions was a feature embedded into our pre-2009 methods. Despite their admirable record, my 2009 insistence on stress-testing our approach against Depression-era data led to a difficult transition in recent years, as we eventually discovered the need to explicitly overlay this feature (albeit in a slightly different form) even in the most overvalued, overbought, overbullish conditions we define. Our difficulty resulted from neither our pre-2009 methods of classifying market return/risk profiles nor from our present methods. Both effectively navigate investment conditions in data from market cycles across history, as well as the half-cycle since 2009. Our difficulty was in the awkward transition between the two. “If credit spreads are widening and internal uniformity is deteriorating, one can infer that investors are shifting toward risk aversion. In that environment, safe, low-interest liquidity is no longer an inferior asset but a desirable one, and creating more of the stuff is not reliably supportive to risky asset prices. This is borne out across a century of history, including the 2000-2002 and 2007-2009 declines, and can be observed even in several episodes since 2009. “An improvement in the behavior of credit spreads and market internals would significantly reduce the immediacy of our downside concerns, though it would not ease our longer-term concerns about valuation. Presently, market internals and credit spreads imply a measurable shift toward investor risk aversion – one that is likely, for now, to leave further monetary accommodation relatively ineffective in provoking fresh speculation aside from short-lived announcement effects – not that renewed easing would be a good idea in any event. This outlook will change only as valuations, credit spreads, and market internals shift.” Notably, the rather breathtaking short-squeeze we observed late last week was not accompanied by a material shift in internals or credit spreads. Understand that such improvement would not reduce the overvaluation of the market, but it would significantly reduce the immediacy of our downside concerns. Meanwhile, however, we interpret last week’s short-squeeze as more likely to be one of those “short-lived announcement effects.” Even here, despite enthusiasm over the word “patient,” the Fed announced no meaningful change of course. Monetary easing is reliably supportive to risky assets only when safe, low-interest liquidity is viewed as an inferior asset. This can be inferred from the behavior of market internals and credit spreads. At present – again, aside from short-lived announcement effects – we don’t observe the conditions under which monetary easing should be expected to be particularly supportive to risky assets. While the current meme is that monetary easing is equivalent to rising stock prices, recall that the Fed was already aggressively lowering interest rates in the fall of 2007, and eased monetary policy aggressively and persistently through the entire course of the 55% stock market collapse that followed. The chart below updates the cumulative total return of the S&P 500 Index restricted to periods matching the return/risk profile that we presently observe. The flat periods are those where other (neutral or favorable) profiles were observed. Notice the tendency toward vertical market plunges during conditions that match the same return/risk profile that we observe at present. The red line captures about 8% of all historical periods. The chart is on log scale, so moving down one line on the vertical axis represents a 50% loss. Of course, there’s no assurance that the market will behave similarly in the future under this set of conditions (which essentially identifies overvalued, overbought, overbullish conditions that are coupled with deterioration in market internals or credit spreads), but we have difficulty ignoring conditions that have historically been associated with nearly stair-step market losses when those conditions have been present, even in recent years. I’ve included a pullout to visualize recent market action in greater detail. A second pullout shows a close-up of market action as these conditions emerged near the 2007 peak. Clearly, these conditions don’t imply that the market will decline every week or every day, or that substantial advances can be ruled out. It’s just that those advances pale in comparison to the air-pockets, free-falls, and crashes that regularly emerge from the profile of conditions we observe here.
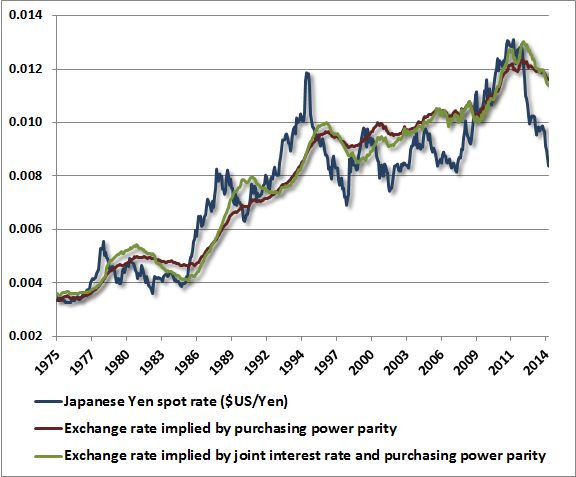
Again, if market internals and credit spreads improve, the immediacy of our concerns will ease. We need not hope for a major market decline, nor do we need to dread a major resumption of speculation. Each of these will manifest because conditions are supportive for them to manifest. As the Buddha said, “This is, because that is. This is not, because that is not.” If there is one central lesson from the challenges we’ve addressed in recent years, it is about the criteria that distinguish between an overvalued market that tends to become more overvalued, and an overvalued market that tends to drop like a rock. Distinctions matter. The set of market conditions that we observe at present are supportive for steep losses to emerge because present conditions join compressed risk premiums with a measurable shift toward risk-aversion by investors. If further speculation is to emerge – and this is borne out even in data from recent years – that speculation is likely to be supported by a measurable shift toward risk-seeking that can also be inferred from the behavior of observable market internals. In short, we would be very happy to observe conditions that are supportive of risk-taking, and have every expectation of acting on those conditions when they emerge (though at current valuations at least a moderate safety net would be required in any event). We have need for neither hope nor dread about future market direction. We don’t rely on one massive or catastrophic move. We simply need, over time, to exercise discipline at each moment. For now, we observe conditions that have historically been consistent with extraordinary equity market losses. Those conditions will change in time, and we’ll adjust our outlook accordingly. A note on foreign currency valuations In recent months, the U.S. dollar has been on a tear, as emerging recessions in Europe and Japan, coupled with greater prospects for quantitative easing relative to the U.S., have contributed to a near-universal view of the dollar as the “cleanest dirty shirt” among major currencies. Dollar strength has contributed both to particular weakness in the dollar-price of globally-traded commodities, and to a certain amount of weakness in investment strategies that are not currency-hedged. To understand this, we’ll use “FC” for one unit of foreign currency, and “$” for one U.S. dollar, so a given currency unit might be quoted as a certain number of dollars per unit of FC ($/FC). As a foreign currency weakens, it takes fewer dollars to buy one unit of FC. So even if a commodity or security has a constant price in terms of FC, a stronger dollar (weaker foreign currency) will result in a decline in the dollar price of that commodity or security. Coupled with an increasingly synchronized global economic downturn, we’ve seen a particular collapse in oil prices. Some observers view this as if it is “stimulative” to the economy, but that perspective confuses the price decline resulting from an inward shift of the demand curve as if it was caused by an outward shift of supply. Our view is that the concerted decline in commodity prices, foreign currencies, and Treasury yields, coupled with a blowout of credit spreads in junk debt (particularly energy-related debt) is all consistent with weakening global economic prospects. Given the “cleanest dirty shirt” perception of the U.S. dollar, the greenback has certainly benefited from this dynamic. But to expect this benefit to persist assumes that a) the dispersion between U.S. and global prospects will continue to widen, and b) that widening is not already priced into the currency markets. An examination of the data provides some challenges to those assumptions. We’re particularly attentive to some of the most recent (December) readings of various purchasing managers indices and regional economic surveys, which thus far have plunged nearly a full standard deviation from readings over the past couple of months. We’ll have to wait to see whether that continues, but the abruptness is striking. On the question of how much dispersion is already priced in, we should observe that global interest rates and inflation are depressed across the board, and the U.S. hardly offers a significant “carry” versus other countries. All have engaged in massive quantitative easing, and are stuck near the zero bound, and there’s no evidence that monetary velocity is picking up elsewhere in a way that makes foreign inflation prospects materially higher than U.S. prospects. Back in 2000, I wrote a piece called Valuing Foreign Currencies that described what I call our “joint parity” approach to currency valuation. Normally, currency valuations are reasonably well-behaved, and aren’t worth much note. But every now and then a gap emerges that you can toss an elephant through. I noted at the time that the euro would have to appreciate about 30% from its then current value of $0.85 to what we estimated as a justified exchange rate closer to $1.14 (which is just what it did over the next few years). At present, we observe the same kind of gap in the valuation of the Japanese yen. The chart below shows the yen exchange rate in terms of dollars per yen (it’s normally quoted as the inverse). In our view, the recent weakness in the yen is among the largest valuation gaps we’ve ever observed among major foreign currencies, rivaling what we observed in the euro in 2000. That’s no assurance that the gap will close, but it would take significant Japanese inflation relative to the U.S. to erase this gap through changes in relative price levels. At a current exchange rate of 120 yen per dollar versus a rate of about 83 yen per dollar implied by our analysis of joint parity relationships, we view the U.S. dollar as roughly 35% overvalued relative to the yen. Put differently, we infer that the Japanese yen is about 25% undervalued relative to the U.S. dollar. By contrast, we view the euro and the British pound as about 9% and 5% undervalued, respectively, versus the dollar. Given the currency weighting of the dollar index, all of this implies a general overvaluation of the dollar amounting to roughly 10% by our estimates, with Japan clearly being the most severe outlier. While we view both the global equity markets and the global banking system as precarious here, our view is that the U.S. dollar has overshot - particularly relative to the yen, and that the currency component of international investment returns is likely to be neutral or favorable in the coming years.
The foregoing comments represent the general investment analysis and economic views of the Advisor, and are provided solely for the purpose of information, instruction and discourse. Please see periodic remarks on the Fund Notes and Commentary page for discussion relating specifically to the Hussman Funds and the investment positions of the Funds. --- The foregoing comments represent the general investment analysis and economic views of the Advisor, and are provided solely for the purpose of information, instruction and discourse. Prospectuses for the Hussman Strategic Growth Fund, the Hussman Strategic Total Return Fund, the Hussman Strategic International Fund, and the Hussman Strategic Dividend Value Fund, as well as Fund reports and other information, are available by clicking "The Funds" menu button from any page of this website. |
|||||||||||||||||||||||||
|
For more information about investing in the Hussman Funds, please call us at
1-800-HUSSMAN (1-800-487-7626) 513-326-3551 outside the United States Site and site contents © copyright Hussman Funds. Brief quotations including attribution and a direct link to this site (www.hussmanfunds.com) are authorized. All other rights reserved and actively enforced. Extensive or unattributed reproduction of text or research findings are violations of copyright law. Site design by 1WebsiteDesigners. |