|
|
||||||
|
|

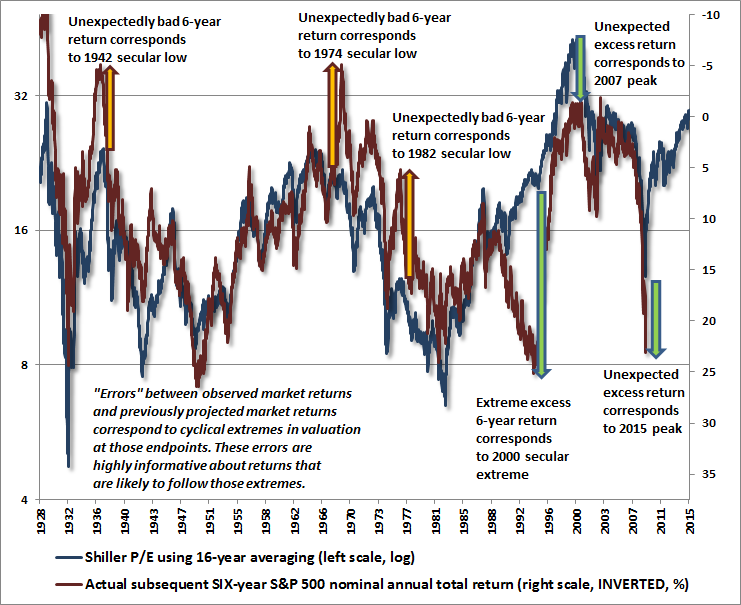
March 9, 2015 What Does That Difference Mean? We continue to observe one of the most overvalued, overbought, overbullish syndromes in the historical record, combined – and this feature is central – with deterioration in market internals suggestive of a shift toward risk-averse preferences among investors. The resulting combination places current conditions among instances that we identify as a “Who’s Who of Awful times to Invest” (see last week’s comment: Plan to Exit Stocks in the Next 8 Years? Exit Now). Based on historical outcomes associated with those prior instances (which prior to the current market cycle, include only 1929, 1972, 1987, 2000 and 2007), we continue to view the stock market as vulnerable to significant downside risk both in the near-term and over the completion of the present market cycle. There is a critical element to these concerns, however, which forms the central distinction between episodes in history where overvalued markets continued higher, and episodes that quickly became vulnerable to free-falls and crashes. That element is the condition of investor preferences toward risk, which we infer from the uniformity or divergence of market internals, credit spreads, and other risk-sensitive factors. A broad improvement in market internals on our measures would not relieve the obscene overvaluation of the equity market, but it would suggest a return to speculative investor preferences and would reduce the immediacy of our downside concerns. We cannot rule out the possibility of market advances counter to the hostile market return/risk profile we presently identify, as even the most hostile profile we identify has included instances of advancing prices. Our concern here is that the average historical outcome of similar conditions has been dismal – typically including a steep market loss over a period of about 10 weeks, and invariably followed by extensive losses over the completion of the market cycle. This instance may be different in the near term, but a century of evidence argues that the completion of the market cycle will wipe out the majority of the gains observed in the advancing portion to-date (even without valuations similar to the present, the average, run-of-the-mill bear market decline has erased more than half of the market gains from the preceding bull market advance). Our investment strategy is decidedly focused on the complete market cycle. For investors committed to a passive buy-and-hold discipline over a much longer horizon; who anticipate and can tolerate the 30-50% losses that can emerge over the completion of the market cycle; who are well-diversified; who recognize that elevated valuations warrant lower long-term return expectations, and who have aligned the risk profile and duration of their portfolio with their expected future spending needs, my advice remains straightforward: maintain adherence to your discipline. Do everything necessary – as soon as possible – to ensure that these conditions are met, and use alternative assets to the extent that they contribute to your diversification, but stick to your discipline. That said, what we’ve observed in prior cycles, especially during 2000 and 2007, is this. Investors often convince themselves to follow a buy-and-hold strategy only after lengthy market advances, and even raise their expectations about the level and safety of future returns at exactly the point when elevated valuations imply poor long-term market prospects (see A Warning from Graham and Dodd). They later abandon their buy-and-hold convictions after lengthy market declines. What I am urging is that investors vividly imagine realistic market losses ahead of time (the 2000-2002 and 2007-2009 declines each wiped out half of the stock market’s value, and the average run-of-the-mill cyclical loss exceeds 30%). One may believe that the timing of such losses is unpredictable, and that’s fine. The point is that such losses are the way that market cycles regularly conclude. Even Jack Bogle, for whom we have great respect, encourages investors to “prepare for at least two declines of 25-30 percent, maybe even 50 percent, in the coming decade.” That’s not a timing call. It’s simply historically-informed realism. Particularly in light of current valuations, investors should set their portfolio allocations to allow for such risk without later abandoning their discipline if it becomes painful. What does that difference mean? The early weeks of 2015 are the first time in history that both 10-year Treasury yields and our estimates of prospective 10-year nominal total returns for the S&P 500 have both declined below 2% annually. Even at the 2000 peak, when our 10-year total return projections were negative, the 10-year Treasury yield was 6.8%, and small capitalization stocks showed reasonable value, particularly on a relative basis. Presently, long-term bonds provide nowhere to hide, and median equity valuations exceed those at the 2000 peak on price/earnings, price/revenue, and enterprise value/EBITDA. Because of yield-seeking speculation, stock and bond prices today are already where they are likely to be many years from today. Prices are likely to experience an interesting and volatile trip to nowhere in the interim. We saw a noteworthy piece from an analyst named Jonathan Selsick last week. Essentially, Selsick examined the Shiller P/E (the S&P 500 divided by the 10-year average of inflation-adjusted earnings), and showed that the multiple is even better correlated with actual subsequent S&P 500 total returns using 16-year smoothing and a 16-year investment horizon. My impression is that this “Shiller 16” multiple is more effective than the 10-year version because it captures two effects: 1) Longer averaging in the earnings component of the indicator further reduces the cyclical variation in the underlying fundamental. We know that measures that are insensitive to cyclical profit margin variations (e.g. market cap/GDP, price/revenue) perform strongly over long horizons of ~10 years, and far better than popular, widely-quoted measures that ignore those variations. For more on this regularity, see Margins, Multiples, and the Iron Law of Valuation. 2) By extending the projection horizon by an extra market cycle (~6 years - the current half-cycle is quite long-in-the-tooth from a hisorical perspective) the effect of mean reversion has a greater chance to dominate the occasional noise that emerges (e.g. during the tech bubble) over shorter horizons. That said, there’s no particular reason that the smoothing horizon in the Shiller P/E needs to match the projection horizon. What drives the historical accuracy of this and similar valuation measures is that every market cycle in history, with the exception of the 2002 market low, has ended at valuations consistent with historically normal long-term expected returns of about 10% annually. So projection horizons that span the completion of at least one market cycle tend to be most effective. In fact, one can show that valuations tend to be best correlated with subsequent market returns over periods representing roughly 0.5, 1.5 or 2.5 typical market cycles (see my 2014 Wine Country Conference presentation, A Very Mean Reversion, for details). Selsick estimates the relationship between the Shiller-16 and subsequent 16-year total returns in the S&P 500, and arrives at a 16-year estimate of prospective nominal returns of 4.94% annually. In my view, this estimate is probably quite close to the mark. One can relate this directly to a 10-year prospective return by recalling that historical tendency for market cycles to establish normal prospective returns – if even briefly as in 2009 – at their troughs (and it's typical for troughs to reach below average valuations and much higher prospective returns than the 10% historical norm). A decade is a long time, and much can change. I expect we'll see valuations at least touch historically normal levels at some point in the next decade, and of course, our 10-year prospective return estimates imply this. We can back out a 10-year projection from Selsick's 4.94% 16-year projection this way. Suppose that valuations take a decade to touch historically normal levels. In that case, the 16-year total return projection of 4.94% represents 10 years of total returns at X%, followed by 6 years at 10%. On that assumption, the corresponding 10-year projection for nominal total returns in stocks would be [(1.0494)^16 / (1.10)^6]^(1/10)-1 = 2.0%. That’s fairly close to our own estimate of about 2.4% based on a broad range of alternative measures that are highly correlated with actual subsequent market returns. If we allow a slightly faster reversion to historically normal valuations at any point before 2023, the 16-year projection of 4.94% would represent 8 years at X% followed by 8 years at 10%, implying an 8-year projected total return for the S&P 500 of nothing at all. Again, that strikes us as just about right. Provided we’re willing to tolerate some additional noise, due to points where mean reversion did not occur during the projection horizon, we can even examine the relationship between valuations and likely 6-year total returns. The chart below shows this relationship using the Shiller-16 multiple. The blue line shows that valuation multiple (left axis, log scale – see that Wine Country Conference presentation to understand why log scale is appropriate). The red line shows the actual subsequent 6-year S&P 500 nominal total return on an inverted scale. I’ve added a good amount of annotation to the chart. Look at the blue and red lines first, and then we’ll cover those annotations.
One of the things you’ll notice in this chart is that there are several points where the actual 6-year total return of the S&P 500 substantially overshot or undershot the return that one would have projected based on valuations. Remember that the red line is on an inverted scale, so lower levels represent higher returns. Look first at 1936. While the blue valuation line showed relatively rich valuations, actual market returns over the next 6 years were even worse than expected. What does that difference mean? It means that stock prices in 1942 (6 years after 1936) must have declined through normal valuations all the way to significant undervaluation. Similarly, look at 1968. You’ll see that while valuations were rich at the time, the actual market returns were far worse than expected. What does that difference mean? It means that stock prices in 1974 (6 years after 1968) must have declined through normal valuations all the way to significant undervaluation. Now look at the worst error: 1994. On a valuation basis, stocks were slightly overvalued, but those valuations were still consistent with expected 6-year returns about 7% annually. However, actual returns weren’t even close to 7% annually. Instead, the total return of the S&P 500 over the next 6 years averaged 25% annually. What does that difference mean? It means that stock prices in 2000 (6 years after 1994) must have advanced to obscenely overvalued levels. Now look at 2009, and it will be clear why I chose a 6-year horizon. Let's get something out of the way first. It’s no secret that I identified stocks as undervalued in late-2008 and 2009 – see Why Warren Buffett is Right and Why Nobody Cares – after a financial crisis that we fully anticipated (having also anticipated the 2000-2002 collapse, and having shifted to a constructive position in early 2003 as the intervening bull market emerged). It’s also no secret that my 2009 insistence on stress testing against Depression-era data (when valuations similar to 2009 were followed by another two-thirds collapse in the market) was ill-timed in hindsight, and was complicated by an awkward transition that took us until mid-2014 to fully address (see A Better Lesson than This Time is Different). Having noted the successes and stumbles of the messenger, it's worthwhile to focus on the evidence. What you’ll observe is that while valuations were somewhat depressed relative to historical norms at the 2009 lows, actual market returns since then have substantially overshot what one would have projected at the time. What does that difference mean? It means that stock prices today (6 years after 2009) have advanced well beyond normal valuations, all the way to steep overvaluation. Far from demonstrating that historically reliable valuation measures haven't "worked" and should be dismissed, the recent difference underscores the precarious condition of valuations today. That conclusion is fully consistent with similar differences we find in the historical record. At present, the Shiller-16 (along with a broad range of other historically reliable valuation measures having strong correlation with actual subsequent returns) projects negative total returns for stocks on a 6-year horizon, even assuming continued growth in GDP, revenues, earnings, and other fundamentals. Indeed, current valuations match the levels observed at the 1929 peak. That certainly doesn't imply that equally catastrophic losses are likely to follow (stocks lost 85% of their value from 1929 to 1932 as valuations collapsed from historic highs to historic lows, and keep in mind that even moving from a 70% loss to an 85% loss involves losing half of your money, which is why I insisted on stress-testing in 2009). Still, we believe that projecting a loss for the S&P 500, including dividends, on a 6-year horizon, is an evidence-based estimate, reflecting assumptions that are very much in the middle-of-the road. In other words, we see that expectation as just about right. The foregoing comments represent the general investment analysis and economic views of the Advisor, and are provided solely for the purpose of information, instruction and discourse. Please see periodic remarks on the Fund Notes and Commentary page for discussion relating specifically to the Hussman Funds and the investment positions of the Funds. --- The foregoing comments represent the general investment analysis and economic views of the Advisor, and are provided solely for the purpose of information, instruction and discourse. Prospectuses for the Hussman Strategic Growth Fund, the Hussman Strategic Total Return Fund, the Hussman Strategic International Fund, and the Hussman Strategic Dividend Value Fund, as well as Fund reports and other information, are available by clicking "The Funds" menu button from any page of this website. |
|||||||||||||||||||||||||
|
For more information about investing in the Hussman Funds, please call us at
1-800-HUSSMAN (1-800-487-7626) 513-326-3551 outside the United States Site and site contents © copyright Hussman Funds. Brief quotations including attribution and a direct link to this site (www.hussmanfunds.com) are authorized. All other rights reserved and actively enforced. Extensive or unattributed reproduction of text or research findings are violations of copyright law. Site design by 1WebsiteDesigners. |