|
|
||||||
|
|

January 4, 2016 The Next Big Short: The Third Crest of a Rolling Tsunami Along with every extreme episode of financial market speculation is a “story,” whether it’s one of technological change, financial innovation, demographic shift, or central bank support. Each story serves the same purpose, which is to encourage and even promise investors that risk is not really risk. As a result, typical levels of cyclical overvaluation aren’t enough to deter further speculation. At the peak of every speculative bubble, there are always those who have persistently embraced the story that gave the bubble its impetus in the first place. As a result, the recent past always belongs to them, if only temporarily. Still, the future inevitably belongs to somebody else. By the completion of the market cycle, no less than half (and often all) of the preceding speculative advance is typically wiped out. In 2009, during the depths of the last crisis that followed such speculation, economists Carmen Reinhart and Kenneth Rogoff detailed the perennial claim that feeds these episodes in their book, This Time is Different: “Our immersion in the details of crises that have arisen over the past eight centuries and in data on them has led us to conclude that the most commonly repeated and most expensive investment advice ever given in the boom just before a financial crisis stems from the perception that ‘this time is different.’ That advice, that the old rules of valuation no longer apply, is usually followed up with vigor. Financial professionals and, all too often, government leaders explain that we are doing things better than before, we are smarter, and we have learned from past mistakes. Each time, society convinces itself that the current boom, unlike the many booms that preceded catastrophic collapses in the past, is built on sound fundamentals, structural reforms, technological innovation, and good policy.” “The essence of the this-time-is-different syndrome is simple. It is rooted in the firmly held belief that financial crises are something that happen to other people in other countries at other times; crises do not happen, here and now to us... If there is one common theme to the vast range of crises we consider, it is that, excessive debt accumulation, whether it be by the government, banks, corporations, or consumers, often poses greater systemic risks than it seems during a boom.” My view on “this time” is clear. I remain convinced that the U.S. financial markets, particularly equities and low-grade debt, are in a late-stage top formation of the third speculative bubble in 15 years. On the basis of the valuation measures most strongly correlated with actual subsequent market returns (and that have fully retained that correlation even across recent market cycles), current extremes imply 40-55% market losses over the completion of the current market cycle, with zero nominal and negative real total returns for the S&P 500 on a 10-12 year horizon. These are not worst-case scenarios, but run-of-the-mill expectations. The risk cycle has already turned, and the familiar canaries in the coalmine - market internals and credit spreads - have been deteriorating persistently, in the same way that deteriorating internals and subprime defaults were the first warning signs to emerge in 2007. A clear improvement on these measures would not improve the long-term outlook, but would significantly reduce the immediacy of our near-term concerns. We don’t observe that at present. To the contrary, particularly on the international front, the consequences of years of distorted capital flows and yield-seeking are already unfolding. As Carmen Reinhart observed last week, “From a historical perspective, the emerging economies seem to be headed toward a major crisis. Of course, they may prove more resilient than their predecessors. But we shouldn’t count on it.” The Big Short Over the holiday, we went with a group of friends to see The Big Short, based on the book by Michael Lewis about the global financial crisis. The film is deeply critical of Wall Street and weak banking regulation, most of which I see as valid. The one thing missing was that the film didn’t clarify why the mortgage bubble emerged in the first place, which I would have liked Margot Robbie to have mentioned while she was explaining mortgage-backed securities in the bubble bath. The answer is straightforward: as the bubble expanded toward its inevitable collapse, the role of Wall Street was to create a massive supply of new “product” in the form of sketchy mortgage-backed securities, but the demand for that product was the result of the Federal Reserve’s insistence on holding interest rates down after the tech bubble crashed, starving investors of safe Treasury returns, and driving them to seek higher yields elsewhere. See, the Fed reacted to the collapse of the tech bubble and the accompanying recession holding short-term rates to just 1%, provoking yield-seeking by income-starved investors. They found that extra yield in seemingly “safe” mortgage securities. But as the demand outstripped the available supply, Wall Street rushed to create more product, and generate associated fees, by lending to anyone with a pulse (hence "teaser" loans offering zero interest payments for the first 2 years, and ads on TV and radio hawking “No income documentation needed! We’ll get you approved fast!”; “No credit? No problem! You have a loan!”; “Own millions of dollars in real estate with no money down!”). The loans were then “financially engineered” to make the resulting mortgage bonds appear safer than the underlying credits were. The housing bubble was essentially a massive, poorly regulated speculative response to Federal Reserve actions. The current, obscenely overvalued QE-bubble is simply the next reckless response to Federal Reserve actions, which followed the global financial crisis, which resulted when the housing bubble collapsed, which was driven by excessively activist Federal Reserve policy, which followed the collapse of the tech bubble. As my wife Terri put it “It’s like a rolling tsunami.” As one of the few who anticipated both the 2000-2002 and 2007-2009 collapses (and having shifted in 2003 to a constructive outlook in-between), what I thought the film particularly got right was just how excruciating the wait was before the crisis unfolded, even for those who expected it (see, for example, my November 2007 weekly comment Critical Point). Though I don’t take leveraged positions in credit default swaps, or sell bank stocks short, even refusing to take equity market risk in the later stages of that bubble was excruciating enough. One had to suffer fools parroting things like “being early is the same thing as being wrong” until the collapse demonstrated that, actually no, it’s really not. The 2007-2009 collapse wiped out the entire total return of the S&P 500, in excess of risk-free Treasury bills, all the way back to June 1995. I love that the line made it into the movie. The film also nicely depicted how entangled financial professionals were in facilitating, cheerleading, and denying the bubble. As I noted in Foxes Minding the Henhouse in April 2007: “One of the disturbing features of the final advance to the 2000 bubble peak was that it involved much more than just uninformed speculation by individual investors. As those of you who've known me since then will remember, I was troubled by the fact that professional advisors and Wall Street analysts - people who I was convinced had both the duty and capacity to know better - had also abandoned their grip on the basic fundamentals of investing.” During the runup to the global financial crisis, I noted that the same complicity was infecting not only the housing market but also the stock market. In February 2007, for example, the Financial Accounting Standards Board effectively reversed its post-Enron ban on the practice of booking future profits as current earnings; a reversal that was immediately seized on by private equity firms, who then went public at the top of the bubble. Like the speculation in housing, the feverish leveraged buy-out activity at the time was essentially tied to yield-seeking encouraged by a Federal Reserve that remained negligent about the speculative impact of its actions, and the fact that much of the speculation piggy-backed on the good faith and credit of Uncle Sam. As I observed at the time: “Meanwhile, leveraged buyouts continue to be a source of excitement in the market. These are essentially being driven by the willingness of investors to buy risky debt without demanding any premium for the risk. The valuation ratios (most commonly enterprise value / EBITDA) on such deals have never been higher. And if the deals go belly-up, well, it's other people's money. And talk about other people's money. Has anybody noticed that the favorite leveraged buyout targets are increasingly ones tied to governments that can't afford to let them fail? This is a recipe for government bailouts. Don't investors realize how much of this LBO activity is implicitly being done on somebody else's dime?” The other major failure was one that we see again today - a striking willingness of the financial community to ignore a simple question: what is the historical relationship between the valuation measure you are using, and the actual subsequent return on the investments you are encouraging other people to hold? Two bubbles, two crashes, and at the peak of the third bubble, the answer hasn’t changed at all. From my April 2007 comment: “Of course, it's still on the issue of ‘operating earnings’ and the ‘Fed Model’ where the complicity and irresponsibility of Wall Street analysts is most apparent. What's happened over the past several years is that the whole definition of “earnings” has been changed from what it has been historically, while a simplistic ratio - ‘forward operating earnings yield compared with the 10-year Treasury yield’ has taken the place of all serious valuation effort... The valuation tools upon which Wall Street analysts increasingly base their analysis are, in fact, pure unadulterated garbage. Over time, investors will discover this along with a good deal of pain. Over the short-term, unfortunately, there is no assurance that investors or analysts will quickly recognize that this market is trading on the basis of false premises about earnings and valuation (though my impression is that those who wake up based on reasoned argument and evidence will be better off than those who wake up based on investment losses).” Since two crashes weren't enough to teach the lesson, here we are again, at what's likely to be seen in hindsight as the last gasp of the extended top formation of the third speculative bubble in 15 years. The median stock actually peaked in late-2014. That's when the median buyout multiple for leveraged buyouts (LBOs) hit the highest level in history, as did the percentage of those deals being financed with debt, rather than buyers using their own capital. The valuation firm Murray Devine observed “Cheap credit is having a significant impact on the deal-making environment. As mentioned previously, the median debt percentage for 2014 deals has hit 72%... Leverage use has skyrocketed since 2011, when the median debt percentage for PE deals was around 55%. Median debt percentages in 2013 and the first half of 2014 both outpaced the percentages seen during the buyout boom; for context, the median only reached 63% in 2007.” Bubble Phase, Crash Phase What makes bubbles so difficult, particularly for value-conscious investors, is that during the first half of a bubble, breathtaking valuations are followed by a continued (often multi-year) advance in prices, while in the second half, breathtaking valuations are followed by a violent wipeout of those gains. So while long-term market returns are tightly correlated with good measures of valuation, shorter-term market returns are not. As a result, the most difficult research question we’ve had to answer in the face of repeated bubbles is not simply “why do markets crash?”, but instead, “What distinguishes an overvalued market that continues higher from an overvalued market that collapses?” The most durably reliable answer we’ve identified across a century of market cycles (including the most recent one) is this. When investors are inclined to speculate, they tend to be indiscriminate about it. As a result, the most reliable measure of the inclination to speculate is the uniformity of market action across a broad range of “internals,” including individual stocks, industries, sectors, and security types, such as debt securities of varying credit quality. An overvalued market, coupled with uniformly favorable market internals, is one where long-term investment prospects may be poor, but where speculation can run the show over the near-term. In contrast, an overvalued market, coupled with deterioration in market internals, reflects not only thin risk premiums but also upward pressure on those risk premiums. Those are the two time-honored ingredients of a market crash.
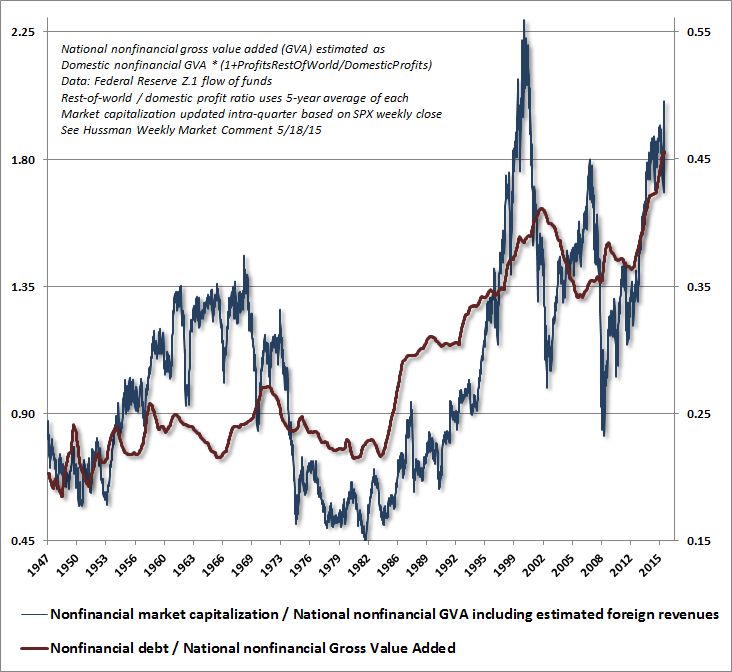
Understand that the features that would have encouraged “rational speculation” during this half-cycle, often despite elevated valuations, are no longer present. Failure to note that distinction is to invite steep losses over the completion of this market cycle. Specifically, market internals have indeed deteriorated explicitly in recent quarters, while the broad market has gone nowhere, in what appears to be an extended top formation at the second-highest valuation extreme in history (the single most extreme for the median stock). Moreover, yield-seeking speculation in recent years enabled the issuance of enormous volumes of junk debt and leveraged loans, typically of the “covenant lite” variety that provides few protections in the event of bankruptcy. The Next Big Short: The Third Crest of a Rolling Tsunami The chart below shows the ratio of nonfinancial market capitalization to corporate gross value added (GVA), along with the ratio of nonfinancial corporate debt to corporate GVA (right scale) which has surged to record-high levels. Understand that MarketCap/GVA is more tightly related to actual subsequent market returns on a 10-12 year horizon than any other measure, including the Fed Model, Price/forward earnings, the Shiller P/E, Tobin’s Q, or any other metric we’ve tested across history. To say that the financial markets are presently at a speculative extreme is an understatement.
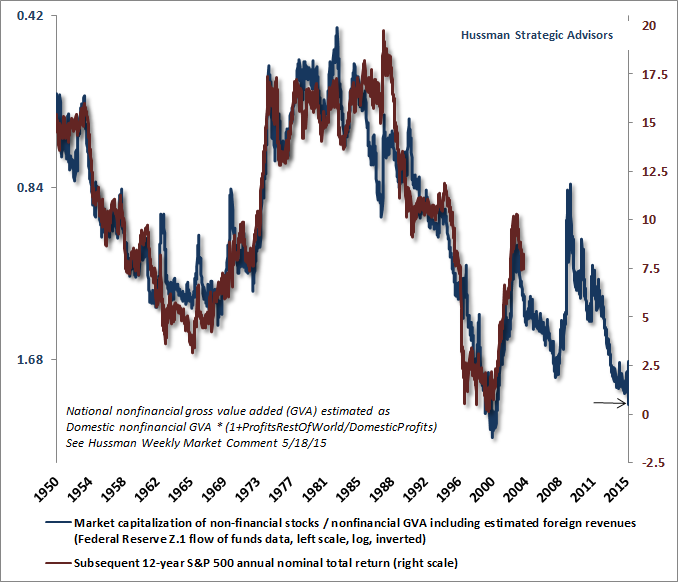
The ratio of nonfinancial market capitalization to corporate gross value added recently peaked at just above 2.0. Now, notice that even over the completion of the two most recent market cycles, when interest rates were quite depressed relative to historical norms, the ratio of MarketCap/GVA fell to just 1.0 or below. That’s certainly not a worst-case scenario (which would be closer to a ratio of 0.45-0.50 as we saw in 1950, 1974, and 1982). Indeed, we’ve never seen a bear market fail to take MarketCap/GVA to about 1.0 or below. For the S&P 500 to lose half of its value over the completion of the current market cycle would merely be a run-of-the-mill outcome given current extremes. A truly worst-case scenario, at least by post-war standards, would be for the S&P 500 to first lose half of its value, and then to lose another 55% from there, for a 78% cumulative loss, which is what would have to occur in order to reach the 0.45 multiple we observed in 1982. We do not expect that sort of outcome. But to rule out a completely pedestrian 40-55% market loss over the completion of the current cycle is to entirely dismiss market history. The following chart is a reminder of the relationship between MarketCap/GVA (blue line, left scale, log, inverted) and actual subsequent S&P 500 annual nominal total returns over the following 12-year period (red line, right scale). At present, investors should expect a 12-year total return from the S&P 500 of essentially zero.
For more on why I view the present moment as a speculative extreme that is likely to end the same as others in the past, see When You Look Back On This Moment In History. We’ve certainly adapted during this cycle in ways that are supported by historical evidence (in particular, requiring explicit deterioration in market internals before adopting a hard-negative market outlook). I remain adamant that this sort of evidence-driven adaptation is a far better strategy than to blindly embrace the notion that “this time is different.” As usual, my intent in these comments is not to encourage investors to sell everything, but instead to at least allow for what are, in fact, reasonable possibilities. If you are a buy-and-hold investor, if you recognize the potential for a steep market loss (even if you don’t expect it as the most likely outcome), if you could tolerate that outcome without abandoning your investment strategy, and if you have a sufficiently long investment horizon (or plan to make sufficiently meaningful future investment contributions) that your spending plans would not be substantially derailed by either a 50% intermediate-term loss or a zero 10-12 year total return on stocks from current levels, do nothing. For my part, I have little doubt there will be points over that horizon where substantially higher prospective long-term returns will be available in the equity market. I expect that the best opportunities to increase market exposure will emerge at points where a material retreat in valuations is coupled with an early improvement in broad measures of market action. Those opportunities will emerge soon enough. In any event, provided you are following a historically-informed discipline that recognizes current market risks in a historical context, and provided your portfolio is aligned with your own risk tolerance, trading disposition, and investment horizon, stick to your discipline. There’s no question that at speculative extremes, recent history always temporarily belongs to the reckless herd that has ignored concerns about valuation and risk at every turn. Fortunately, the future has always belonged to those who take discipline, analysis, and the lessons of history seriously. Decide which investor you want to be.The foregoing comments represent the general investment analysis and economic views of the Advisor, and are provided solely for the purpose of information, instruction and discourse. Please see periodic remarks on the Fund Notes and Commentary page for discussion relating specifically to the Hussman Funds and the investment positions of the Funds. --- The foregoing comments represent the general investment analysis and economic views of the Advisor, and are provided solely for the purpose of information, instruction and discourse. Prospectuses for the Hussman Strategic Growth Fund, the Hussman Strategic Total Return Fund, the Hussman Strategic International Fund, and the Hussman Strategic Dividend Value Fund, as well as Fund reports and other information, are available by clicking "The Funds" menu button from any page of this website. |
||||||||||||||||||||||||||
|
For more information about investing in the Hussman Funds, please call us at
1-800-HUSSMAN (1-800-487-7626) 513-326-3551 outside the United States Site and site contents © copyright Hussman Funds. Brief quotations including attribution and a direct link to this site (www.hussmanfunds.com) are authorized. All other rights reserved and actively enforced. Extensive or unattributed reproduction of text or research findings are violations of copyright law. Site design by 1WebsiteDesigners. |