|
|
||||||
|
|

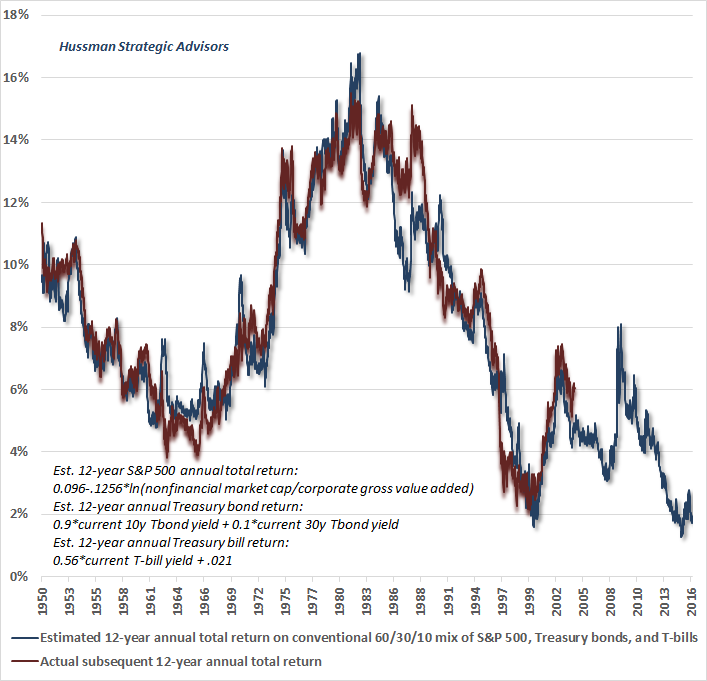
June 13, 2016 Like Water Out of a Sponge Last week, the 10-year Treasury yield dropped to just 1.6%. Technician Walter Murphy noted that his index of global 10-year yields also plunged to an all-time low. The overall structure of global bond yields is undoubtedly the outcome of years of aggressive monetary easing, though the break to fresh lows among European bank stocks may convey some additional information content. Of course, the compression of prospective investment returns isn’t limited to bonds. On the basis of the valuation measures best correlated with actual subsequent S&P 500 total returns across history, prospective 10-12 year S&P 500 nominal total returns have declined to just 0-2% by our estimates, with negative real expected returns on both horizons. The compression of long-term expected returns on stocks and bonds is as much a statement about future returns as it is about past ones. What follows is a discussion of valuation measures, profit measures, and the prospects for investment returns from current extremes. Some of this is a refinement of recent comments, but the risk of repetition is far outweighed by the urgency of this discussion. Investors should not get this moment wrong. Understand that strong past returns, rich valuations, and low prospective future returns all go hand-in-hand. They are all part of the same phenomenon - one I often call the Iron Law of Valuation. The higher the price one pays for a given set of future cash flows, the lower the long-term return one can expect on the investment. With every increase in security prices, what was “prospective future return” a moment earlier is instantly converted into “realized past return,” like water being squeezed out of a sponge. As a result, realized past returns always appear the most compelling at exactly the point where prospective future returns are the most dismal. The chart below presents our best estimate of prospective 12-year total returns on a conventional portfolio mix of 60% stocks, 30% Treasury bonds, and 10% Treasury bills. The 12-year horizon is used because that’s the point where the autocorrelation profile of valuations reaches zero (see Valuations Not Only Mean-Revert; They Mean-Invert). The chart below uses the ratio of nonfinancial market capitalization to corporate gross value-added to estimate prospective S&P 500 total returns. This measure has a 93% correlation with subsequent market returns at this horizon, significantly exceeding that of the Fed Model, price/forward operating earnings, the Shiller P/E, Tobin’s Q, and apples-to-oranges measures such as the ratio of the S&P 500 to scaled profits from the National Income and Products Accounts (NIPA). Conventional investment portfolios - meaning most of those held by reasonably long-horizon, growth-focused investors - are presently likely to return just 1.6% annually over the coming 12-year period.
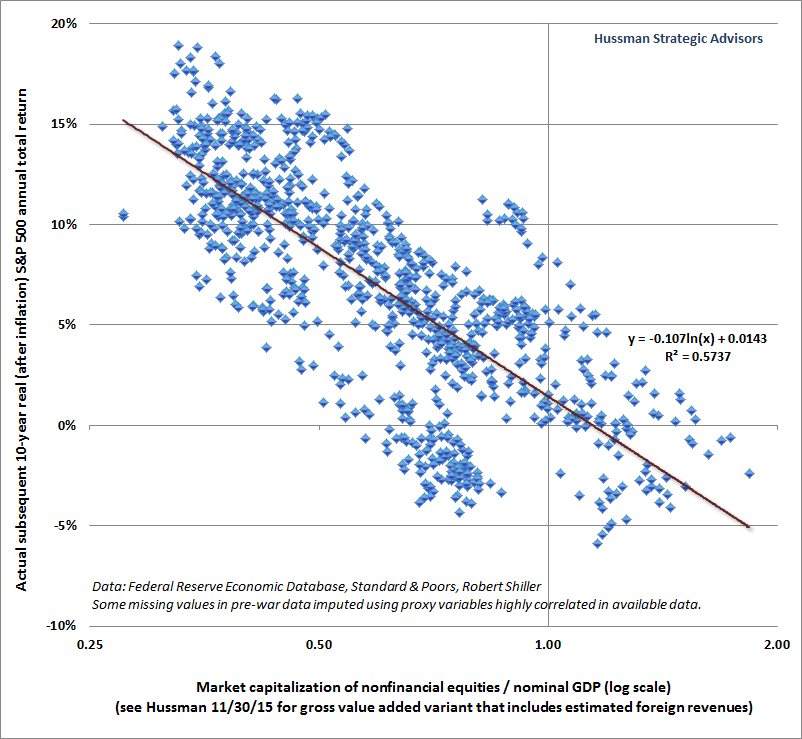
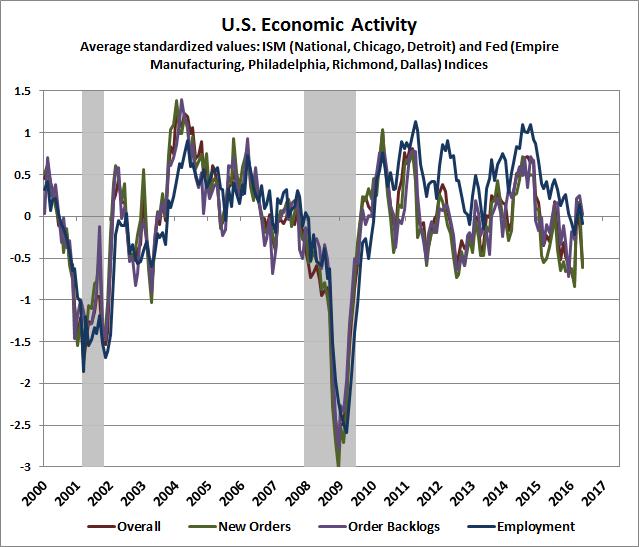
As a side note, we continue to see the same reliable signal of bubble peaks that appeared in 1929, 2000, and 2007: the emergence of novel valuation measures encouraging investors to believe that current extremes are still reasonable. This practice repeats because, to use John Kenneth Galbraith’s timeless phrase, “as in all periods of speculation, men sought not to be persuaded by the reality of things but to find excuses for escaping into the new world of fantasy.” While I’m not a great adherent of the Shiller cyclically-adjusted P/E (CAPE), I periodically cite it since it’s a widely followed and reasonably useful measure. To the extent the Shiller P/E can be improved, the best way to do so isn’t to use a different profits measure in the denominator; it’s to correct for the variability of the implied profit margin that even the Shiller P/E demonstrates over economic cycles (see the Hussman May 5, 2014 market comment). Using normalized profit margins (which significantly increases the relationship to actual subsequent market returns across history), the current CAPE would not be just 25, but a much more obscene 34, more than double the historical norm. Instead, the most recent iteration involves switching out the denominator of the S&P 500 P/E by replacing the earnings of S&P 500 companies with economy-wide earnings reported in the NIPA tables. This makes for a lower P/E, and benefits from the fact that NIPA profits have been unusually elevated in recent years (see the economic notes below for more on economy-wide profits). On the positive side, the outcome of this incoherent shift to apples-and-oranges comparisons is to raise the proportion of 10-year real returns explained by the novel measure to 40% (a correlation of about 63% with subsequent real returns), which is somewhat higher than the proportion of 10-year real returns explained by the raw Shiller CAPE. Yet, as shown below, market capitalization to nominal GDP explains 57% of the variation in subsequent 10-year real returns (a correlation of 75%), and market cap to gross value added is even stronger. It's entirely unnecessary to resort to an apples-and-oranges measure to improve the CAPE. Put simply, the best way to “improve” the CAPE is to mute the residual impact of profit margin variations over time. Moreover, if economy-wide measures are preferred, the most reliable measures are also those that mute or are unaffected by cyclical variation in profit margins, and better reflect corporate revenues (for more, see Margins, Multiples, and the Iron Law of Valuation). In the face of the lowest prospective long-term returns in history for a conventional portfolio mix, matched only by the 2000 and 1929 peaks, an understanding of valuation should lead investors to recognize that the financial markets are like a pendulum drawn to an extreme; like stones in a slingshot that is stretched into the sky, but pointed straight at the ground. Our future selves, and future generations, will both marvel and shudder at the profound ignorance and recklessness of monetary authorities, in the same way that we deride misguided medical practices like bloodletting to treat disease, or performing frontal lobotomies to cure depression. Central banks haven’t created wealth or prosperity. They’ve only created profound distortion and a world of pain for investors, pension beneficiaries, and the global economy in the form of future payback. Any security is simply a claim on some stream of future cash flows that will be delivered to the holders over time. The true “wealth” represented by any security is embodied in that stream of future cash flows; in the value-added production that generates those cash flows. Raising the current price that investors pay for those future cash flows doesn’t create “wealth” - it just converts what were previously future prospective returns into realized past returns. Unfortunately, somebody still has to hold those low-return securities from today until the securities are retired. Likewise, lowering borrowing rates to rock-bottom levels doesn’t create economic growth; it creates a candy store of opportunities for unproductive malinvestment across the globe. What distorting financial markets really does is to provide an opportunity for wealth transfer. Specifically, when valuations are stretched to overvalued extremes, sellers have a temporary ability to obtain a transfer of existing wealth from hapless buyers who happen to be sucked in at the top, and then end up holding the bag. Somebody has to do so. For those that do, I fully expect that this deal will include a 40-55% market retreat over the completion of the current market cycle, on the way to zero returns over 10-12 years. That same expectation also means that we anticipate strong investment opportunities in the coming years, at lower valuations and higher prospective returns. Every market cycle in history has brought prospective 10-12 year S&P 500 total returns into the 8-10% range or beyond over the completion of that cycle. Such an outcome today implies an S&P 500 in the 1050-1250 range (see Choose Your Weapon), so a 45-50% market loss would be wholly run-of-the-mill cycle completion from present valuations. It has taken a return to one of the most extreme levels of valuation in history to bring the annual nominal total return of the S&P 500 to even 4% in the 16 years since the 2000 peak. This speaks to the consequences of overvaluation, and to future investment prospects for a passive investment approach from current levels. A run-of-the-mill completion of the current market cycle would erase the entire total return of the S&P 500 since 2000. Economic notes I’ve regularly noted over time that economic deterioration typically follows a well-defined sequence, with weakness in what I call the “order surplus” (new orders + backlogs - inventories) followed by deterioration in industrial production (which retreated again last month) and by real retail sales (which have declined for two consecutive months), then real personal income (which is the next measure to watch here), and typically followed only then by weakness in employment indicators. From the standpoint of that sequence, deterioration in the order surplus has been evident for several quarters now, and in January, our views shifted from concern to expectation of an imminent likelihood of recession. From that standpoint, the “surprising” weakness in May payroll employment was actually a fairly standard reflection of lags in the employment data. Still, it’s fair to say that economic data in recent months have been weak enough overall to maintain our recession concerns, but sufficiently mixed to temper a confident expectation. Our expectations of recession would become substantially more pointed in the event we observe more deterioration in real retail sales, real personal income, new claims for unemployment, and the equity market. The chart below illustrates the mixed activity we’ve observed in recent months. Again, overall conditions maintain our recession concerns, but a more uniform deterioration across regional and national Fed and purchasing manager’s surveys, coupled with material equity market weakness, would produce more well-defined expectations. The fresh deterioration in new orders over the past month bears watching.
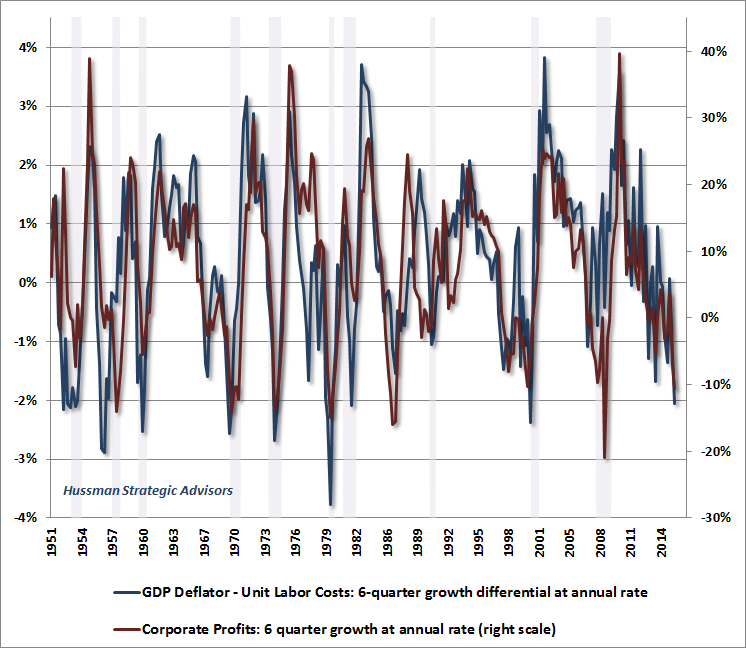
It’s ironic that some observers are eager to base valuation measures on the 10-year average of economy-wide profits, because the same factors that elevated corporate profits as a share of GDP over this period are now reversing. To understand the drivers of economy-wide profits from a savings-investment perspective, see An Open Letter to the Fed: Recognizing the Valuation Bubble in Equities. The short story is that the deficits of one sector always emerge as the surplus of another. In recent quarters, gross domestic investment has declined, government savings (currently a negative figure) have been relatively stable, household savings have increased, and the trade gap has widened (effectively an import of foreign savings). In order for the savings-investment identity to hold (which it must, because it’s an accounting identity), lower gross investment coupled with higher savings outside of the corporate sector can be observed as a decline in corporate profits in recent quarters. This isn’t some seasonal anomaly. It’s a fully-anticipated reversal of the cyclical factors that temporarily elevated corporate profits in this cycle. The chart below shows a complementary perspective based on the share of output prices represented by labor costs. Clearly, the higher the share that goes to labor, the less that goes to profits. From this perspective, it’s important to recognize that the retreat in corporate profits has a clear underlying driver: a significant increase in unit labor costs (the outcome of rising wages and weaker productivity) relative to increases in output prices, as measured by the GDP deflator. As illustrated below, we’ve never observed such a strong deterioration in these underlying drivers of corporate profits (blue line) except in association with U.S. recessions.
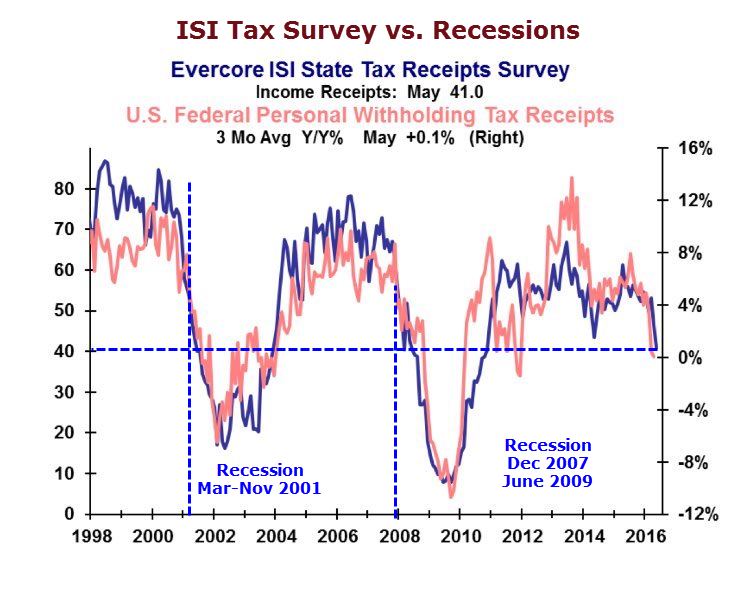
From an employment standpoint, we’re also seeing notable weakness in payroll tax receipts, which has also accompanied prior recessions. Mike Shedlock and Liz Ann Sonders shared versions of the following chart last week. Withholding tax income growth has slowed to nearly zero, suggesting that employment measures are beginning to mirror the sequence of deterioration we’ve observed in more leading measures of economic activity in recent quarters.
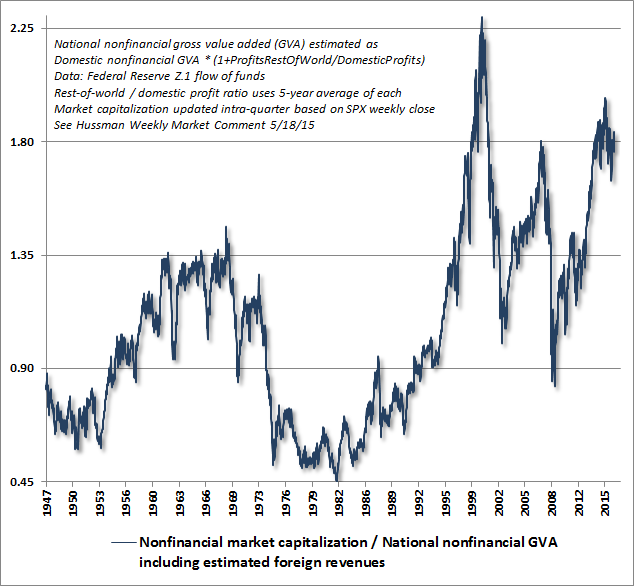
The upshot is that while years of intentional financial distortion by central banks have driven the prospective returns of conventional investment portfolios to less than 2% annually on a 10-12 year horizon, these same distortions have done little for the real economy. Indeed, using a variety of statistical methods (e.g. constrained vector autoregressions), one can show that economic growth, employment and industrial production in recent years have not materially differed from the paths that would have been expected purely on the basis of non-monetary variables. That is, all of this monetary distortion has had minimal effect on the real economy, versus what could have been expected without it. The main outcome of this distortion has been the third financial bubble in 16 years; from which awful consequences over the completion of the current market cycle, and over the coming 10-12 year horizon, are unavoidably baked in the cake. Given the generally tepid behavior of the U.S. economy, many observers continue to assert that it would be a “policy mistake” for the Fed to raise interest rates by a quarter of a point. The fact is that the course of economic activity is unlikely to be affected much either way. The real policy mistake was to enable the third financial bubble in 16 years, which was both intentional and avoidable. There is no escaping the consequences of this madness, because extreme valuations mean that poor subsequent market returns are baked in the cake. The true policy mistake happened years ago. In my view, the best response isn’t to raise rates, or even to defer raising rates (it really doesn’t matter, given the weak relationship with real economic variables). Instead, the best course is to begin the process of rolling off Fed balance sheet holdings as they mature, without reinvesting the proceeds. Given the depressed yields in the Treasury market at present, allowing holdings to roll off realizes a profit on those holdings at a point where Treasury debt is in high demand, whereas reinvesting the proceeds at present yields maintains a grotesque balance sheet and runs a very high risk of capital losses unless those holdings are held to maturity. The Fed has an opportunity to truly normalize the policy environment here. It would be wise to seize that opportunity. When one recognizes that aggressive and persistent monetary easing had no effect at all in halting the 2000-2002 and 2007-2009 market collapses, it should be clear that the notion of “Fed support” is illusory. Fed easing certainly encourages speculation when investors are already inclined to speculate, but has very little impact on markets when investors have shifted toward risk-aversion. The best measure of this shift is the uniformity of market internals across a broad range of individual stocks, industries, sectors, and security types, including debt securities of varying creditworthiness. That’s because when investors are inclined to speculate, they tend to be indiscriminate about it. The chart below shows the valuation measure we find best correlated with actual subsequent S&P 500 total returns: the ratio of nonfinancial market capitalization to corporate gross value-added, including estimated foreign revenues (see my 5/18/15 comment for more details on this measure). The most reliable valuation measures across history are currently well beyond twice their historical norms. Even if the S&P 500 will never again be priced for expected returns in the 8-10% range, a return to expected 10-12 year nominal returns of merely 5% annually would require the market to lose more than a quarter of its value. The central "policy mistake" of the Fed has been to enable the third financial bubble in 16 years, from which we expect outcomes no better than from the last two (or from lesser extremes across history, for that matter).
Shifts in investor risk-preferences come just as night follows day, and have done so over a century of U.S. data, and over the expanse of human history. Presently, our measures of market internals continue to indicate that the shift toward risk-aversion that we observed in mid-2014 has not reversed. Since then, the major indices have essentially gone sideways, though the greater deterioration in equal-weighted and value-focused stocks (relative to the large, capitalization-weighted indices) has created some short-run headwinds for hedged equity strategies. We can’t rule out a resumption of risk seeking, but we’ll take that evidence from market action as it arrives. For now, our outlook remains defensive. Tracing the molecular pathway of multiple sclerosis I’m pleased to note that my research labor of love for those living with multiple sclerosis, with collaborators at the Hussman Institute of Human Genomics at the University of Miami, was published last week in Nature - Genes & Immunity. Research in statistical genetics and molecular biology may seem odd to those who don’t know my whole narrative, but I honestly believe that life should be in service to others, and this is one of the ways I can work at that, temporarily free from the reckless and misguided behavior of central bankers. Family and shareholder responsibilities always come first, but most of my limited time outside of those is spent in charitable work through the Hussman Foundation. Existing research on the genomics of multiple sclerosis has identified numerous high-confidence genes, but the molecular pathway in which those genes operate has not been as well-defined. This new research paper, GWAS analysis implicates NF-kB-mediated induction of inflammatory T-cells in multiple sclerosis, uses the noise-reduction method I developed several years ago to identify and prioritize existing and novel gene candidates, and constructs a coherent molecular pathway by which those genes cooperate. My hope is that articulating this pathway will help to inform efforts at developing targeted therapies.The foregoing comments represent the general investment analysis and economic views of the Advisor, and are provided solely for the purpose of information, instruction and discourse. Please see periodic remarks on the Fund Notes and Commentary page for discussion relating specifically to the Hussman Funds and the investment positions of the Funds. --- The foregoing comments represent the general investment analysis and economic views of the Advisor, and are provided solely for the purpose of information, instruction and discourse. Prospectuses for the Hussman Strategic Growth Fund, the Hussman Strategic Total Return Fund, the Hussman Strategic International Fund, and the Hussman Strategic Dividend Value Fund, as well as Fund reports and other information, are available by clicking "The Funds" menu button from any page of this website. |
|||||||||||||||||||||||||
|
For more information about investing in the Hussman Funds, please call us at
1-800-HUSSMAN (1-800-487-7626) 513-326-3551 outside the United States Site and site contents © copyright Hussman Funds. Brief quotations including attribution and a direct link to this site (www.hussmanfunds.com) are authorized. All other rights reserved and actively enforced. Extensive or unattributed reproduction of text or research findings are violations of copyright law. Site design by 1WebsiteDesigners. |