|
|
||||||
|
|

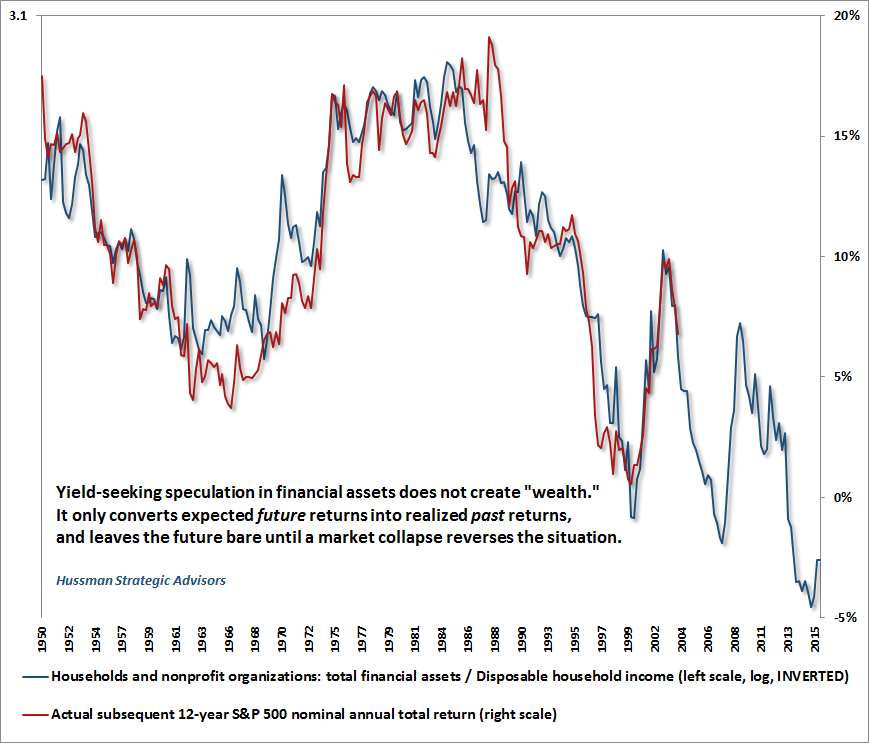
November 14, 2016 Judging Economic Policy Despite the market volatility of the past week, our classification of expected market return/risk profiles shifted only modestly for most asset classes. In stocks, we observed a great deal of internal dispersion, which continues to suggest a subtle shift toward risk-aversion among investors. The global equity markets remain well below their mid-2015 peak, and the U.S. markets remain in what we would continue to describe as the extended top formation at the third most extreme valuations in history (and the single most extreme valuations from the standpoint of the median stock). In terms of leadership, we observed a new high in the Dow Jones Industrial Average last week, along with speculation in banks and pharmaceuticals that are expected to benefit from deregulation, and transportation stocks seen as potential beneficiaries of transport-related infrastructure spending. Conversely, Treasury securities plunged on expectations of larger deficits resulting from both higher spending and lower taxes. We continue to expect 10-12 year nominal total returns for the S&P 500 averaging about 1.5% annually, with a likely market retreat of 40-55% over the completion of this cycle. Nothing in the recent election results materially changes those expectations. Indeed, my sense is that equities should build in a substantially higher, not lower, risk premium at present - if only because the stated objectives and policies of the new administration are intentionally disruptive to the status quo. It’s not clear that the fiscally-conservative side of the Republican party will embrace a large expansion of deficit spending, nor that the more moderate elements in the party will embrace aggressive deregulation, so my sense is that much of last week’s activity was driven more by a combination of hope and fear than by evidence. Still, we don’t need to make assumptions about the success or failure of various policies. It’s just that we find no historical evidence that the mapping from reliable valuation measures to subsequent long-term and full-cycle market outcomes has any correlation with the political party in office, or even with changes in fiscal policy over those horizons. That’s also not at all to say that economic policy changes don’t have economic outcomes, but the impact on the stock market is more nuanced. As I’ve demonstrated before, since higher economic growth tends to be associated with higher interest rates and lower terminal valuations on say, a 10-year horizon, the two effects systematically wash out over time (see Rarefied Air: Valuations and Subsequent Market Returns). We’ve used a variety of historically reliable metrics, including several of our own, to demonstrate the strong link between valuations and actual subsequent market returns, particularly on a 10-12 year horizon (which is the point where the autocorrelation of valuations drops to zero - see Valuations Not Only Mean-Revert; They Mean-Invert). While several metrics have an even tighter correlation and are available over a longer data set, the chart below is perhaps the easiest way to demonstrate that the Fed-induced elevation of financial assets is nothing but illusory “paper wealth.” It may appear that American households are “wealthier” than they have ever been, in the sense that financial assets held by households have never been higher as a fraction of disposable income (the Federal Reserve Z.1 flow of funds data used below also include non-profit organizations, but their impact is comparatively small). The blue line on the chart below shows this ratio on an inverted log scale (left). One might imagine that a high value of financial assets to disposable income reflects greater saving by households. Unfortunately, since 2000, saving as a fraction of household income has plunged to half the savings rate observed in the previous half-century. No, what we have here is a Fed-induced disparity between what is paper and what is real, and that disparity is wider than at any point in history. When Americans perceive a gap between “Wall Street” and “Main Street,” they’re 100% correct. Not surprisingly it turns out that the best moments for paper wealth are also the worst moments for future investment returns. The red line (right scale) on the chart below shows actual subsequent 12-year S&P 500 nominal total returns. However one views other issues, Donald Trump was correct in his September 26, 2016 statement “Believe me. We’re in a bubble right now. We are in a big, fat, ugly bubble.” An administration can do a lot of good, or a lot of damage through its policies, but like the collapse of the tech bubble and the housing bubble, my expectation is that the collapse of the present bubble is already baked in the cake.
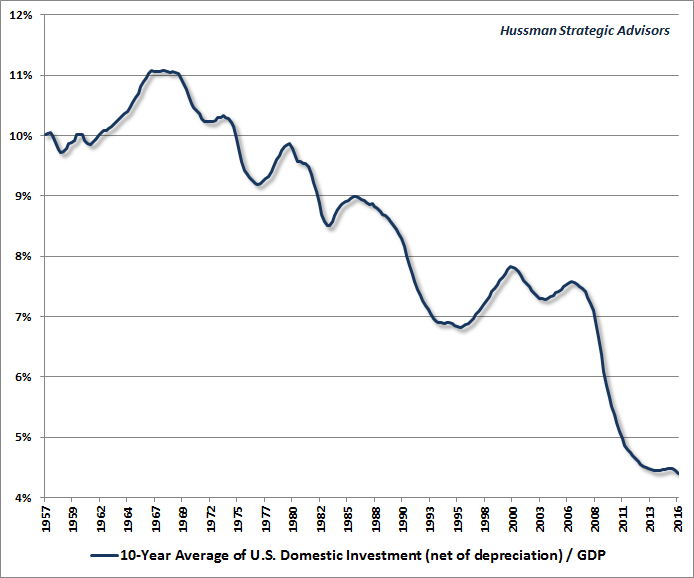
The 10-year Treasury bond yield jumped to 2.15% last week, which even at these levels is higher than the expected return we estimate for the S&P 500 over the same horizon. Meanwhile, Treasury bill yields increased to just under 0.5%, which is the highest level since October 2008. While we still identify a fairly neutral expected return/risk profile for bonds, the increase in yields improved that very modestly. Likewise, the weakness in precious metals shares modestly improved our expected return/risk profile for that sector, but our outlook remains fairly conservative relative to our much stronger conviction early this year. Put simply, aside from possibly increasing the appropriate risk-premium across financial assets, last week’s election results don’t materially change our full-cycle our long-term expectations for the stock market. I recognize that it’s a great temptation to speculate about policy changes and their effects on various sectors, but we prefer evidence to opinions. Judging economic policy If you spend virtually any time at all with economic data, you can quickly prove to yourself that more often than not, economic relationships that are endlessly discussed as fact actually have no basis in historical data. That goes for presumed relationships between unemployment and inflation, deficits and interest rates, money supply and inflation, interest rates and economic growth, and a score of others. For example, it’s often taken for granted that lower interest rates are associated with stronger economic growth. The problem is that while lower interest rates may encourage some amount of real investment in housing and capital goods, the level of interest rates is only a small part of the reason one chooses to go ahead with those investments. Mainly, low interest rates encourage activities where the primary cost of business is interest itself, and those activities are generally forms of financial speculation. Meanwhile, suppressed interest rates reduce the incentive for individuals to save. They also lower the “hurdle” needed to make a given investment profitable, and thereby allow fairly unproductive projects to be funded that otherwise would not. Finally, depressed interest rates are generally a symptom of sluggish demand for new investment. For all of these reasons, you’ll find a very weak relationship between the level of interest rates and economic growth, and the relationship you do find is actually positive; it’s actually higher interest rates that tend to be associated with higher economic growth. So how should we think about economic policy, and which directions would be most beneficial? From my perspective, the answer is straightforward. We define the “standard of living” of a nation by the amount of goods and services that a person can obtain for an hour of work. We define “productivity” by the amount of goods and services that a person can produce with an hour of work. While real wages ebb and flow over the economic cycle, over the long-term, “standard of living” and “productivity” go hand in hand. Increase productive investment, and you increase the amount of output that an employee can produce with an hour of work. Moreover, the great irony of economics is that as productive investment becomes less scarce, each unit of it becomes less profitable. So output increases, and a greater share of output goes to wages instead of profits. Expanding productive investment at every level of the economy gives you both a larger pie and an improved income distribution. If you net out all the assets and liabilities in an economy, you’ll find that the nation’s accumulated stock of real investment is the only thing that remains. That’s the central driver of a nation’s productivity, and the true basis for a nation’s wealth. Broadly defined, it includes a nation’s accumulated stock of real private investment (e.g. housing, capital goods, factories), real public investment (e.g. infrastructure), intangible intellectual capital (e.g. education, inventions, organizational knowledge and systems), and its endowment of basic resources such as land, energy, and water. Encourage, incentivize, and protect all of those, and you’ll find an economy that delivers prosperity. Fail to encourage productive investment at every level, and you’ll find an economy in long-term decline. In short, the best way to improve both the growth and the distribution of income in the U.S. economy would be to encourage productive investment at every level, including government (productive infrastructure, clean energy), industry (investment and R&D incentives), and individuals (education, employer credits for job training). The primary source of failure in the U.S. economy over the past 15 years has been a policy environment aimed at encouraging consumption over productive investment. Those policies have been dominated by the Federal Reserve’s quest to punish saving, fuel debt-financed consumption, and produce an illusory “wealth effect” from financial speculation. The chart below shows the 10-year average of net domestic investment (gross domestic investment, less depreciation) as a fraction of U.S. GDP. If you’re looking for the root of U.S. economic stagnation, there’s your trouble.
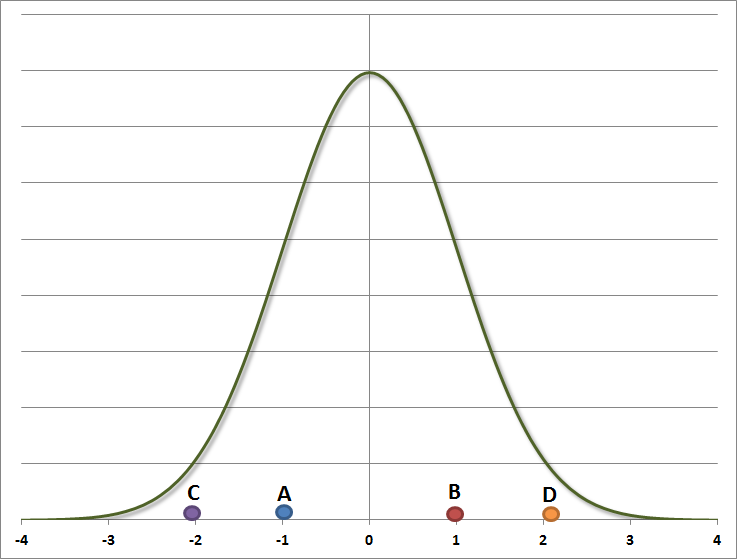
Aside from fiscal policy, the U.S. would benefit from shifting economic policy away from this focus on paper speculation to a focus on real, productive investment. I’m very much in favor of requiring the Federal Reserve to articulate a statistically-defined benchmark, from which it could deviate during crises, but where it would at least bear a requirement to explain those deviations to Congress. One possibility is to use the Taylor Rule. Another is to use a statistically-defined estimate of the systematic component of monetary policy - the portion that can be explained by prior non-monetary variables (output, employment, and inflation) - see Failed Transmission - Evidence on the Futility of Activist Fed Policy. As a final note on economic policy, I’ll repeat something I’ve emphasized regularly over the years. Good policy acts to relieve constraints where they are binding; to coordinate activities that can’t be effectively executed solely by private initiatives; and to provide incentives or impose costs on the activities of those whose actions produce benefits or damages for others. This kind of thinking also reduces to the project level. For example, the most promising infrastructure investments are likely to be those that reduce congestion (lane expansions, bridge renovations) or relax long-term supply constraints (e.g. alternative energy), as opposed to building new systems (e.g. high speed rail) where existing ones aren’t at full capacity, or extending transportation infrastructure to low-population or low-demand areas. In my view, these are the measures by which economic policy should be judged, to estimate whether or not they are likely to benefit the country. Does the policy encourage productive investment, or does it instead encourage consumption, malinvestment, or speculation? Does the policy have high “marginal benefit”? For example does it spend a fairly modest amount per person to improve outcomes for those who have little, or does it spend a large amount per person to produce small improvements for those who already have a great deal? Does the policy relax constraints that are binding, or does it create overcapacity where there is already slack capacity? Does the policy increase incentives for economic activities that have “spillover” benefits for others? Does the policy increase costs for economic activities that impose “spillover” damages on others? Does the policy require those who invest or lend with public funds to have some amount of their own capital at risk? Does the policy tie incentives to tangible economic benefits such as job creation? Whatever the policy, the more directly it encourages productive investment at the private, public, or individual levels, the greater the likely benefit to the country. A few observations on the recent election cycle If we’ve learned one thing from the recent election cycle, it’s that people on both sides of the political spectrum feel both unheard and even threatened by the views of the other. Discontent, on either side, is a signal that we’d better listen to each other to understand those differences. When people feel unheard, their concerns find unexpected and often undesirable ways of expression. Neither side will do much good for the country by treating the other half of the nation as idiots. I spend much of my time working with probability distributions and extracting signals from statistical noise. From that perspective, what happened, I think, in this election, is that people didn’t vote for the candidate that fully represented their views, but rather the candidate that was the “nearest neighbor” to their views. In a typical election cycle, the candidates might be represented by A versus B below. Given a bell-curve of political views, A is the nearest neighbor to the views of the left half of the distribution, and B is the nearest neighbor of the right half. Each candidate gets something close to half of the popular vote, but both candidates are at least tolerable to nearly everyone except those on the far tails of the distribution.
In the recent election cycle, the candidates were not only further from the middle, but had a record of saying and doing things that were seen as jaw-droppingly offensive by one side or the other (and in some cases, both). Conceptually, those candidates represent points C and D. And that’s the problem. If each side votes for the “nearest neighbor” to their own views, it gives the impression that all of the people who voted for C or D actually align themselves with C and D, so each side ends up believing that the other side is insane. Likewise, other countries assume that the whole nation aligns itself with C or D. Whatever the outcome, there’s bound to be a certain level of dissatisfaction. If C wins, most people will feel they’re to the right of that candidate to some degree, and if D wins, most people will feel they’re to the left of that candidate to some degree. Worse, there’s a vastly larger set of people on one side of the distribution who see the outcome as intolerable and even terrifying. My sense is that this is actually where the nation stands at present, and it shouldn’t be a surprise. Some have suggested that it should be the job of Democrats to deal with the distress of Democrats, and the job of Republicans to deal with the distress of Republicans. I wholly disagree. The first act of wisdom, and the first step toward peace and reconciliation, is for each side to listen, nonjudgmentally, to the suffering - real or perceived - of the other side. The job of any true leader, indeed, the mark of any true leader, whatever their political persuasion, is to encourage that understanding. A way forward, I think, is to suspend the inclination to reduce other human beings to labels. Labels are our way of defending our attachments and avoiding any attempt to understand and address the other side’s concerns, fear, anger, misunderstanding, or perceptions of injustice. One usually finds that it’s possible to address the concerns of others in a way that still meets one’s own interests, but it takes a certain amount of courage to open a dialogue when the other side uses labels like “extremist” and “enemy” too. Peace isn't just a random outcome that comes from hope. It's a practice, and is often the strongest and most successful strategy. My friend and teacher Thich Nhat Hanh once said “To love our enemy is impossible. The moment we understand our enemy, we feel compassion towards him or her, and he or she is no longer our enemy. When you begin to see that your enemy is suffering, that is the beginning of insight.” Gandhi said "If we could change ourselves, the tendencies in the world would also change." For me, that change includes a world that focuses less on a dualistic "us vs them" mentality, and more on a recognition of our shared humanity. Ultimately, all of us are made of that same substance. We share the same momentary blink-of-an-eye in the eternity of time, on the same tiny dot in the vastness of the universe. That’s an extraordinary thing to have in common. The sooner we approach each other with that recognition, the stronger we’ll be as a country and as a world.The foregoing comments represent the general investment analysis and economic views of the Advisor, and are provided solely for the purpose of information, instruction and discourse. Please see periodic remarks on the Fund Notes and Commentary page for discussion relating specifically to the Hussman Funds and the investment positions of the Funds. --- The foregoing comments represent the general investment analysis and economic views of the Advisor, and are provided solely for the purpose of information, instruction and discourse. Prospectuses for the Hussman Strategic Growth Fund, the Hussman Strategic Total Return Fund, the Hussman Strategic International Fund, and the Hussman Strategic Dividend Value Fund, as well as Fund reports and other information, are available by clicking "The Funds" menu button from any page of this website. |
|||||||||||||||||||||||||
|
For more information about investing in the Hussman Funds, please call us at
1-800-HUSSMAN (1-800-487-7626) 513-326-3551 outside the United States Site and site contents © copyright Hussman Funds. Brief quotations including attribution and a direct link to this site (www.hussmanfunds.com) are authorized. All other rights reserved and actively enforced. Extensive or unattributed reproduction of text or research findings are violations of copyright law. Site design by 1WebsiteDesigners. |