
|
|
||||||
|
|

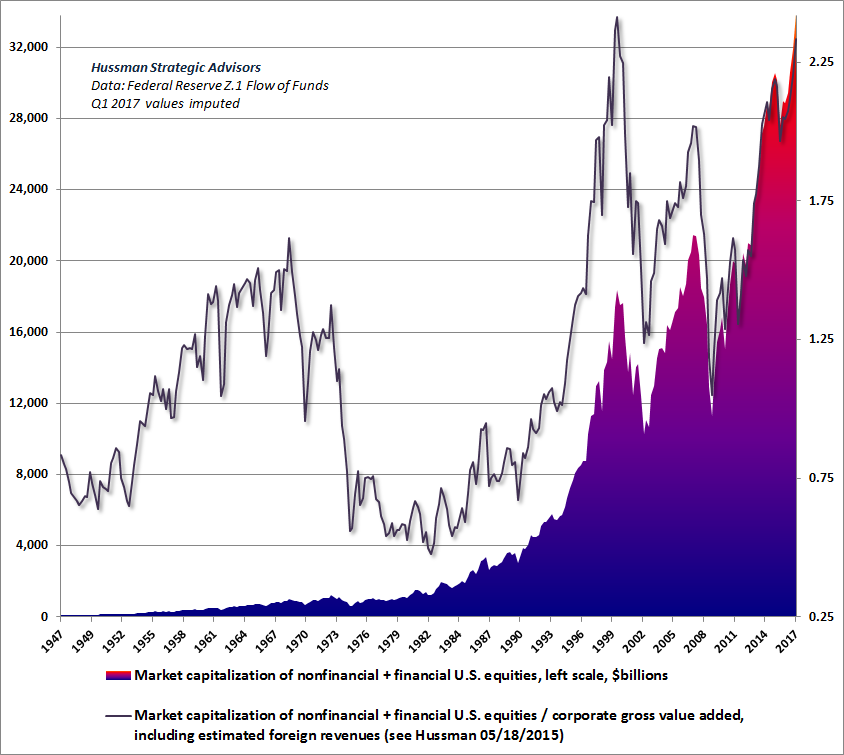
March 27, 2017 Dissolving Musical Chairs On the first day of March 2017, the combined market capitalization of U.S. nonfinancial and financial stocks reached $34 trillion. Those trillions of dollars in paper wealth filter down to the investment statements of millions of investors, reflected in quotes on computer screens and blotches of ink on paper. Over the completion of the current market cycle, we estimate that roughly half of U.S. equity market capitalization - $17 trillion in paper wealth - will simply vanish. Nobody will “get” that wealth. It will simply disappear, like a game of musical chairs where players think they've won by finding chairs as the music stops, and suddenly feel them dissolving as if they had never existed in the first place. As I noted in 2015, because equities are correlated with other assets, the total private net worth of U.S. households and corporations tends to change by about $1.50 for every dollar that U.S. equity market capitalization changes. With total U.S. private net worth currently at about $120 trillion, it would currently take an equity market loss of only about 20% to wipe out $10 trillion in U.S. private net worth (0.2 x 1.5 x 34). By contrast, an expected 50% loss of U.S. equity market capitalization over the completion of this market cycle (a decline that would not even bring historically reliable valuation metrics below their long-term historical norms), would produce an expected loss of over $25 trillion in U.S. total private net worth. To understand how paper wealth vanishes, recognize that market capitalization is merely the product of two objects: the number of shares outstanding, and the price of those shares. For example, there are currently nearly 9 billion shares of General Electric outstanding. If a dentist in Poughkeepsie sells a single share of GE to some buyer, just 10 cents below the price of the preceding trade in the stock, fully $900 million dollars of market capitalization is instantly erased from the U.S. stock market as a result of that one $30 stock trade. Nobody “got” the $900 million. The lost market capitalization didn't "go into" bonds, or real estate, or gold, or cash on the sidelines, or anything else. It just plain vanished. Conversely, if our dentist buys a single share just 10 cents above the preceding trade in the stock, fully $900 million dollars of market capitalization is instantly “created” as a result of that one $30 stock trade. Because of those fluctuations, investors across the nation imagine that they are actually gaining or losing “wealth” as market capitalization appears and vanishes. They alternately celebrate and suffer because they can’t distinguish wealth from the illusion of wealth. When one understands how ephemeral market capitalization can be, it may become clear why I’m so adamant about the actual claim that investors actually obtain by owning a share of stock. See, the actual “wealth” inherent in a share of stock is embodied in the very long-term stream of future cash flows that the company will actually deliver into the hands of investors over time. As long as a share of stock is outstanding, somebody has to hold it at every point in time, and that long-term stream of cash flows is actually what’s being traded. Everyone who owns the stock owns a divided claim to those cash flows. Investors don’t get to claim those future cash flows until they actually buy, and they don’t get to claim the market price until they actually sell. Put another way, the only investor who has a reliable claim to the current market price is an investor who is selling at that price. Let’s pause to recognize the opportunity, and the risk, that investors face at the obscene levels of valuation that have been created by years of Fed-induced yield-seeking speculation, coupled with Wall Street’s enthusiasm over largely imaginary prospects for a sustained acceleration in economic growth (more on that below). The chart below presents the market capitalization of U.S. equities (left scale, $billions). The thin line shows the ratio of market capitalization to corporate gross value added (right scale) to offer an additional valuation perspective. On this measure, current valuations now rival those of the 2000 market extreme, standing at more than double the historical norm (including the bubble period since the late-1990’s), and about 160% above pre-bubble norms. Put simply, the U.S. equity market could lose $17 trillion in value - over 50% of its market capitalization - even without taking reliable valuation measures below their historical norms.
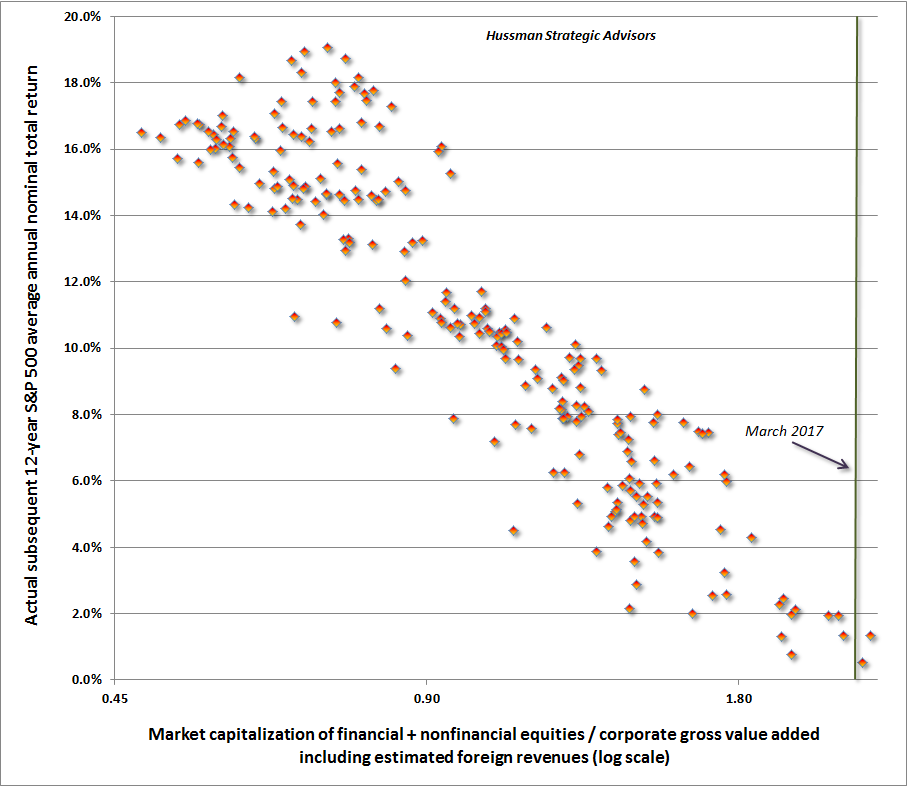
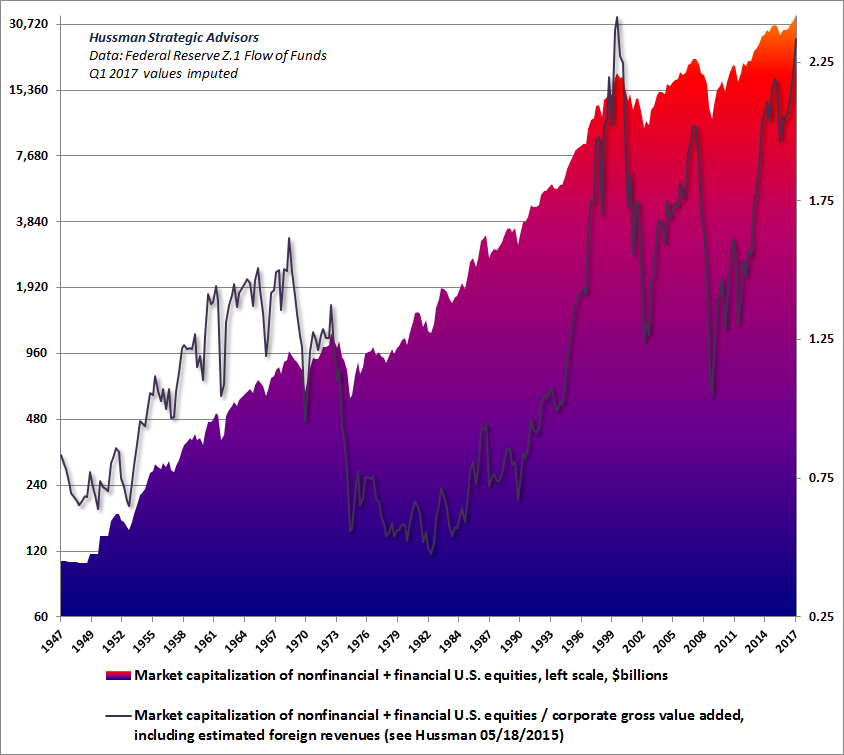
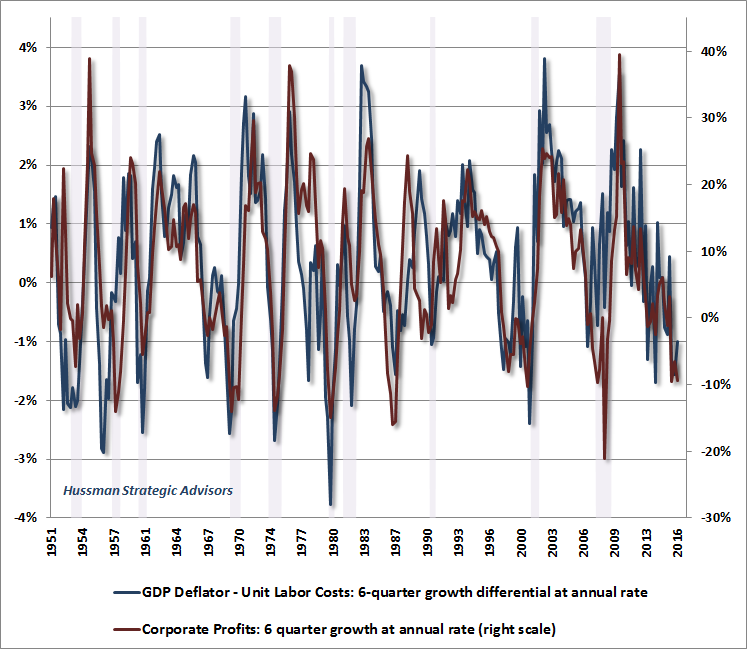
[I also created a chart showing total market capitalization on log scale: click here] A few of the preceding comments will benefit from some amount of additional support (see the links in the text for charts and data). I’ve previously detailed the arithmetic of U.S. real GDP growth, including demographic constraints on labor force growth and productivity relationships that make a sustained acceleration to even 2.7% real GDP growth unlikely. Likewise, I’ve detailed the impact of interest rates on equity valuations, the fact that the Fed Model is wholly an artifact of the 16-year disinflationary period from 1982-1998, and the earnings dynamics that make popular measures such as “forward operating earnings” such poor sufficient statistics for the long-term stream of cash flows that investors actually stand to receive over time. I’ll add that much of the cyclical variation in earnings is tightly (and inversely) linked to fluctuations in real unit labor costs, that is, growth in unit labor costs in excess of inflation in the GDP deflator. These costs can be expected to accelerate given the combination of lower unemployment and economic policies that target a narrowing of the U.S. trade balance (and thereby inadvertently target a contraction in U.S. gross domestic investment). Moreover, even if U.S. real and nominal economic growth were to fully recover to their long-term historical norms, it would take 12-16 years of 6% nominal growth, with zero price appreciation in the interim, to bring reliable valuation measures back to their own historical norms. I have no pointed market expectations over the very near-term here. We presently observe further deterioration in equity market internals, but we've also seen a bit of improvement in interest-sensitive measures. Overall, I view valuations as obscene, measures of overextended prices and sentiment as dangerous, and market internals as negative, but short-term narratives about taxes, health care and so forth are wild cards with regard to day-to-day market behavior. My near-term views will become more pointed if we observe fresh deterioration in either equity-market or credit-sensitive measures. On every other horizon - intermediate-term, full-cycle, and long-term (10-12 years), I am thoroughly convinced that the U.S. equity market is a house of cards. While our preferred valuation metric continues to be the ratio of nonfinancial market capitalization to corporate gross value added, including estimated foreign revenues, I’ve included financial stocks this week, because exuberance about regulatory relief has elevated market capitalizations in that sector. At current extremes, it’s important to provide an overall perspective across all U.S. equities. The chart below shows total market cap / corporate GVA versus the actual subsequent 12-year annual total return of the S&P 500 Index, in quarterly data since 1947. Notice that the current level falls short of only the final two quarters of the market bubble that ended in 2000. Based on this and other reliable measures, we presently estimate S&P 500 nominal total returns to average just 0.6% annually over the coming 12 year period.
So from a long-term perspective, I expect that the coming 12-year period will be wholly unrewarding for investors (from current valuation extremes), though there will likely be strong opportunities in the interim, beginning from lower valuations offering better prospects for long-term returns. From a cyclical perspective, I expect $17 trillion or more of paper wealth in U.S. equities will be erased over the next few years, as the current market cycle is completed. That paper wealth on the portfolio statements of millions of Americans will simply vanish. Nobody will “get” that “wealth” in aggregate, because market capitalization is a purely mathematical object (shares outstanding times the market price). Stocks are a claim on a stream of future cash flows that will be delivered to investors over time. Historically, the most reliable “sufficient statistic” for those cash flows for the U.S. stock market as a whole is not next year’s forecast of S&P 500 operating earnings, but instead, the gross value added produced by U.S. corporations. The comparative reliability is not even close. The next few years are likely to be difficult for those investors who cannot actually tolerate a 50-60% portfolio loss on passive equity investments. Investors who would not be able to maintain a disciplined passive investment strategy over the course of such a loss are encouraged to review their investment exposure based on their actual investment horizon and risk-tolerance. The foregoing comments represent the general investment analysis and economic views of the Advisor, and are provided solely for the purpose of information, instruction and discourse. Please see periodic remarks on the Fund Notes and Commentary page for discussion relating specifically to the Hussman Funds and the investment positions of the Funds. --- The foregoing comments represent the general investment analysis and economic views of the Advisor, and are provided solely for the purpose of information, instruction and discourse. Prospectuses for the Hussman Strategic Growth Fund, the Hussman Strategic Total Return Fund, the Hussman Strategic International Fund, and the Hussman Strategic Dividend Value Fund, as well as Fund reports and other information, are available by clicking "The Funds" menu button from any page of this website. |
|||||||||||||||||||||||||
|
For more information about investing in the Hussman Funds, please call us at
1-800-HUSSMAN (1-800-487-7626) 513-326-3551 outside the United States Site and site contents © copyright Hussman Funds. Brief quotations including attribution and a direct link to this site (www.hussmanfunds.com) are authorized. All other rights reserved and actively enforced. Extensive or unattributed reproduction of text or research findings are violations of copyright law. Site design by 1WebsiteDesigners. |

