|
|
||||||
|
|

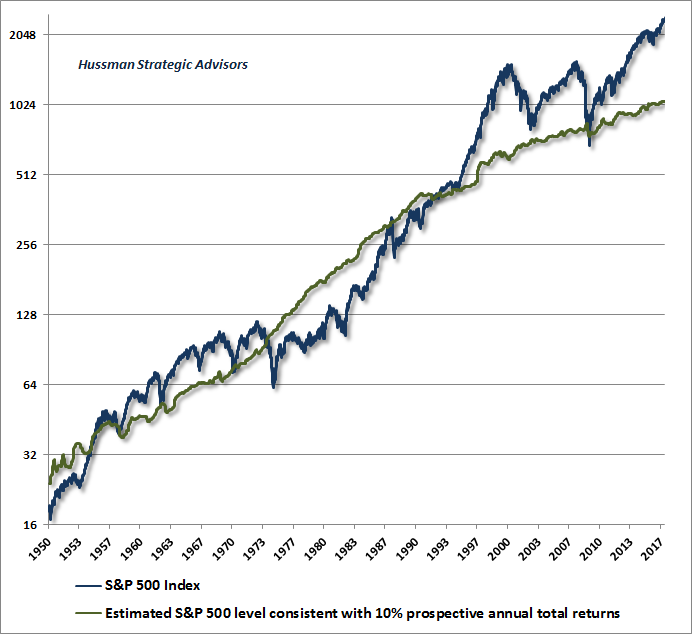
June 12, 2017 Fair Value and Bubbles: 2017 Edition In recent decades, two of the financial concepts that have become most vulnerable to squishy thinking are the notions of “fair value” and “bubbles.” Ironically, but also necessarily, the misuse of these concepts becomes most prevalent exactly during periods of extreme overvaluation that investors identify, in hindsight, as bubbles. One of the reasons why valuations are poorly understood, and their importance is wholly underestimated, is that overvaluation alone is not enough to drive prices lower over shorter segments of the market cycle. For that reason, it’s essential to monitor the speculative inclinations of investors through the uniformity and divergence of market internals. The inclination of investors toward speculation or risk-aversion, as measured by the quality of market internals, is the hinge between an overvalued market that continues higher and an overvalued market that collapses. This is a lesson that was dramatically reinforced in recent years, as deranged Federal Reserve policies encouraged yield-seeking speculation even in the face of warning signs that were reliable in other market cycles across history. In the face of zero interest rates, one had to wait for market internals to deteriorate explicitly before adopting a negative market outlook (we made our own adaptations in 2014 in that regard). Unfortunately, investors seem to have concluded that central bank easing is omnipotent, despite the fact that the Fed eased persistently and aggressively, to no effect, through the entire course of the 2000-2002 and 2007-2009 market collapses. It’s almost impossible for convey how badly investors are likely to regret dismissing valuations and ignoring market internals by the time the current speculative market cycle is completed. This movie has been re-made many times, always with the same ending. The most egregious misuse of “fair value” in recent decades was during the speculative episode that ended in 2000, as Wall Street abandoned historically-informed valuation approaches, and embraced methods that directly conflicted not only with the basics of asset pricing, but with all economic experience. For example, near the peak, James Glassman and Kevin Hassett published a book titled Dow 36,000, which not only treated earnings as dividends, but used a static infinite-horizon model that falls apart with the slightest change in assumptions. As I wrote at the time, their model “assumes that stocks should earn no risk premium, imagines that all earnings are paid out to shareholders with no reinvestment in new capital, and assumes that earnings will grow at 5% annually nonetheless. Of course, there is no plausible, historical, or economic basis for this. But hey, we’re trying to sell a book here. They assume stocks should be priced to offer a 6% long term rate of return, giving a resulting model: Price = Earnings / (0.06 - 0.05), which gives the result that the fair price/earnings ratio of the market = 100. Wow. Now let’s suppose that interest rates go to 7%. Using Glassman and Hassett’s assumptions, we then get Price = Earnings / (0.07 - 0.05), or P/E = 50. In other words, interest rates rise by 1% and stock prices drop by half. No risk. Yeah.” Even at the March 2000 extreme, Wall Street largely denied the possibility that the stock market could, in fact, be experiencing a bubble. While observers often quote Alan Greenspan’s December 1996 lip-service to the possibility of “irrational exuberance” (which was merely a question and not an assertion), the fact is that his views remained quite floppy on the subject years later, when the bubble was full-blown: “Bubbles generally are perceptible only after the fact. To spot a bubble in advance requires a judgment that hundreds of thousands of informed investors have it all wrong. Betting against markets is usually precarious at best. While bubbles that burst are scarcely benign, the consequences need not be catastrophic for the economy. This all leads to the conclusion that monetary policy is best primarily focused on stability of the general level of prices of goods and services as the most credible means to achieve sustainable economic growth.” Still, a few observers recognized the reality of the situation. On March 30, 2000, Nobel Laureate Franco Modigliani published an op-ed in the New York Times, observing: “I can show, really precisely, that there are two warranted prices for a share. The one I prefer is based on such fundamentals as earnings and growth rates, but the bubble is rational in a certain sense. The expectation of growth produces the growth, which confirms the expectation; people will buy it because it went up. But once you are convinced that it is not growing anymore, nobody wants to hold a stock because it is overvalued. Everybody wants to get out and it collapses, beyond the fundamentals.” A few weeks later, I detailed how bubbles can emerge when investors focus on year-to-year returns and not discounted cash flows. Suppose that investors come to expect some annual rate of return k, say 10% annually, and even though the actual stream of cash flows cannot be expected to provide that return, suppose that investors bid prices up at a sufficient pace to produce that rate of investment returns anyway. The result is that prices gradually detach from fundamental values. I wrote: “Mathematically speaking, the defining characteristics of a bubble are 1) price movements satisfy a ‘differential equation,’ in this case, Price = (1+k) x Last Price - cash flow, but 2) the long-term return k expected by investors does not equate price with the present value of future cash flows. In other words, the price contains a ‘bubble component,’ and the present value of that component is not zero. That’s what Modigliani means when he says ‘I can show, really precisely, that there are two warranted prices for a share.’ One is the price based on discounted fundamentals, but as he notes, ‘the bubble is rational in a certain sense. The expectation of growth produces the growth, which confirms the expectation.’ The only question is how long it takes for the gap between price and fundamentals to become intolerably wide. As we’ve seen, it can take a long time. But once the bubble psychology breaks, that gap can close with sickeningly great speed.” Over the following 18 months, the S&P 500 would lose half of its value, and the tech-heavy Nasdaq 100 would lose 83% of its value, both in line with the projections I published at the March 2000 high. Though the broad uniformity or divergence of market internals (the best measure we’ve found of risk-seeking or risk-aversion among investors) greatly impacts market returns over shorter segments of the market cycle, valuations are extremely informative about long-term returns on a 10-12 year horizon, and potential downside risk over the completion of any given market cycle. By 2007, yield-seeking speculation had driven stocks to a second bubble peak. A few weeks before that market extreme, which would be followed by a 55% plunge in the S&P 500, I reminded investors: “Indeed, there is no evidence that historically reliable valuation measures have lost their validity. Though the stock market has maintained relatively high multiples since the late 1990's, those multiples have thus far been associated with poor extended returns. Specifically, based on the most recent, reasonably long-term period available, the S&P 500 has (predictably) lagged Treasury bills for not just seven years, but now more than eight-and-a-half years. Investors will place themselves in quite a bit of danger if they believe that the ‘echo bubble’ from the 2002 lows is some sort of new era for market valuations.” Because Wall Street continued to encourage speculation based on the idea that stocks were “cheap relative to interest rates,” I added: “I've done my best to warn loudly, I've put the data out there, and have analyzed this thing to pieces. The Fed Model has no theoretical validity as a discounting model, is a statistical artifact, would never have been materially negative except in 1987 and the late 1990's (even in 1929 or 1972), yet views the generational 1982 lows as about ‘fairly valued,’ is garbage in data prior to 1980, and vastly underperforms proper discounted cash flow models and normalized P/E ratios. If investors still wish to follow the Fed Model, my conscience is clear, and my hands are clean.” Fair Value and Bubbles: 2017 Edition One of the reasons the concept of “fair value” is so misused is that it depends on what one means by “fair.” Consider a $100 bill that will be received 10 years from today. One definition of the word “fair” is “historically normal.” During the post-war period, 10-year Treasury bonds have had a median yield-to-maturity of 5.2%. On that notion of “fair”, the value of the $100 future payment would be $100/1.052^10 = $60.23. An investor paying that price would then expect a historically-normal 5.2% rate of return over the coming decade. However, the current 10-year Treasury yield is just 2.2%, so one could reasonably argue that the future payment should be priced to deliver only a 2.2% return over the next decade, in which case the appropriate price would be $100/1.022^10 = $80.44. An investor paying that price would then expect a 2.2% rate of return over the coming decade. Assuming the risk is identical to Treasury bonds, this outcome would be fair “relative to similar alternatives.” Either definition of “fair value” is acceptable, but it’s essential for investors to be explicit about which definition they are using. In particular, it would be ridiculously squishy thinking for investors to assert that fair value is $80.44, and at the same time, to expect the long-term return on that 10-year investment to average a “historically normal” level of 5.2% annually. No. If you’re paying $80.44, you should expect a 2.2% 10-year return. Alternatively, if you want to achieve historically normal returns, you should expect your future returns to be disappointing if you pay anything greater than $60.23. The chart below presents our best estimate of S&P 500 fair value across history, where we have defined “fair” as the level of the S&P 500 that would be consistent with historically-normal long-term returns averaging 10% annually. These calculations (estimated based on our measures of U.S. nonfinancial corporate gross value-added, including estimated foreign revenues) provide a consistent benchmark across history. It’s quite reasonable to assert that stocks should be priced to achieve long-term returns lower than a historically-normal 10%, given the current position of interest rates, and the chart that follows will address that issue. Meanwhile, however, it’s important to recognize that no market cycle in history, including the most recent ones, and including cycles that featured similarly low interest rates, has failed to bring prospective S&P 500 12-year expected total returns into the 8-10% range by the completion of the cycle. For that reason, one should hesitate to entirely dismiss a return toward “historically normal” valuations for the S&P 500.
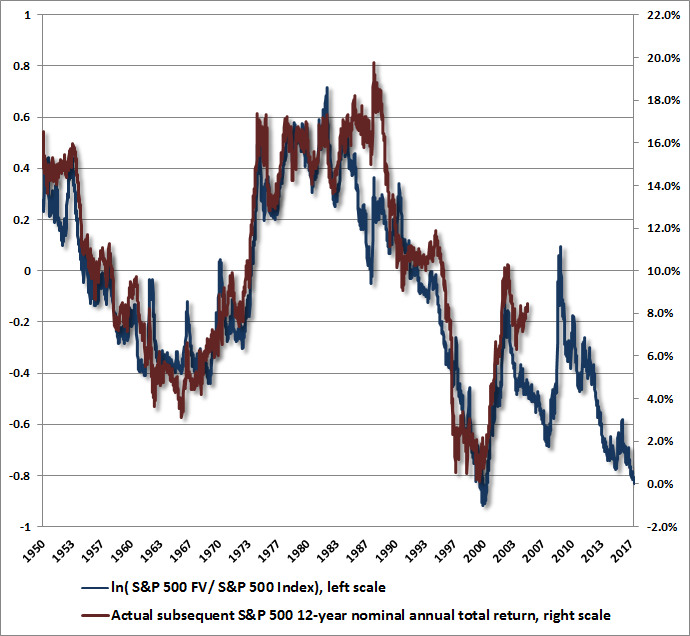
Two features of the above chart are notable. First, the chart implies that from the standpoint of historically-normal expected returns, the S&P 500 has been persistently overvalued for over two decades, with the notable exception of the 2009 market low. This is what has made attention to market internals so essential; because the uniformity or divergence of market internals is the hinge that distinguishes overvalued markets that continue higher from those that drop like a rock. One might argue that “true” fair values are actually higher than our estimates, but that proposition is testable: if stocks have not been overvalued during this period, we should have observed long-term S&P 500 total returns near 10% annually during this period, as a rule. Instead, we find that even using the current extreme as an endpoint, the only points in recent decades that have been rewarded with 10% annual S&P 500 total returns are the horizons that originate at the 1990 low, the 1994 low, the 2002 low, and the 2008-2009 lows (precisely where we would have expected such returns to originate). That’s also why the S&P 500 has averaged total returns of just 4.7% annually over the past 17 years, despite an advance to the second most offensive valuation extreme in history. Without yet another bubble 17 years from now, the coming 17 years are likely to feature even lower average S&P 500 total returns (we’d presently estimate about 3% annually on that horizon). Consistent with the estimates above, the total return of the S&P 500 has indeed averaged less than 10% for the bulk of the period since 1992. Of course, the steepest shortfalls in market returns from a historically-normal 10% originate from the 2000 and 2007 peaks. Because market cycles have always reasonably approached historically-normal values by their completion (even when interest rates have been quite low), I fully expect that S&P 500 total returns, as measured from the 2000 and 2007 peaks, are likely to fall to the 0-2% range by the completion of the current market cycle A second feature of our estimates is that if these fair values are accurate, we should be able to demonstrate that stocks produced long-term returns below 10% annually whenever the S&P 500 was above the fair value estimate, and enjoyed long-term returns greater than 10% annually whenever the S&P 500 was below the fair value estimate. The chart below, computed using the two lines in the preceding chart, confirms this intuition. The blue line (left scale) shows the log ratio of the S&P 500 fair value estimate to the actual S&P 500 Index. The higher the blue line, the cheaper the S&P 500 was relative to estimated fair value. The red line (right scale) shows the actual subsequent S&P 500 annual nominal total return over the following 12 years.
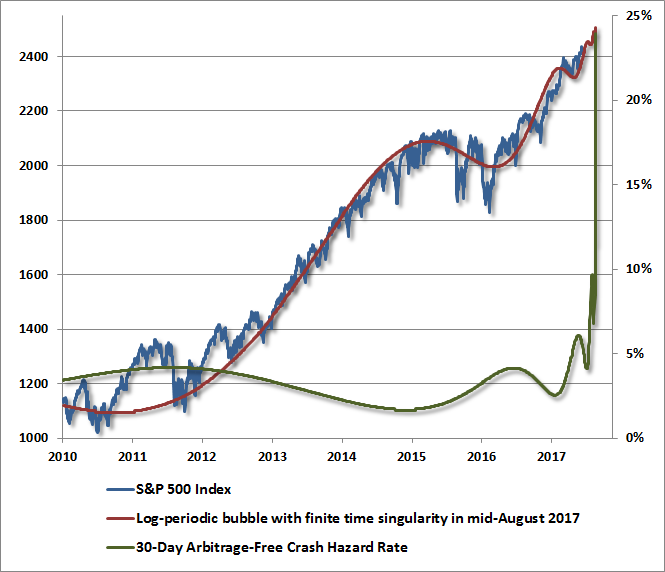
Presently, the S&P 500 stands at an extreme that is nearly 140% above the level that we would associate with historically-normal 10% long-term expected returns. Clearly, investors view some portion of this valuation premium as “justified” based on the low competing level of interest rates. The problem is that while investors give lip service to the idea that lower interest rates “justify” higher valuations, they appear to ignore that valuations are now so extreme that S&P 500 total returns can be expected to average roughly zero over the coming 12-year period. Put simply, investors should expect no total return at all from the S&P 500 for quite a long period ahead. Moreover, based on valuations that have been observed over the completion of every market cycle in history (including cycles prior to 1960, when interest rates were similarly low), investors should also expect interim losses on the order of 50-60% over the completion of this market cycle. The characteristic feature of a bubble is that the long-term return implied by discounted cash flows becomes detached from the higher, temporarily self-reinforcing return that is imagined by investors. As a result, the bubble component accounts for an increasingly large proportion of the total price, and becomes progressively vulnerable to collapse. It is in this precise sense that the current speculative episode can be characterized as a bubble, just as I (and Modigliani) characterized the bubble that ended in 2000. Bubbles and crash hazards In his book “Why Stock Markets Crash,” Didier Sornette formalizes a dynamic model of bubbles and crashes. It’s important, though, to recognize first that Sornette’s model doesn’t reflect valuation considerations, and second, that it doesn’t capture measures of investor risk-seeking or risk-aversion. Our central and hard-won lesson of the advancing half-cycle since 2009 was that the Federal Reserve’s zero interest rate policies were able to encourage continued yield-seeking speculation long after even the most extreme overvalued, overbought, overbullish syndromes emerged. In the face of zero interest rates, one had to wait for explicit deterioration in the uniformity of market internals (reflecting a subtle shift from risk-seeking to risk-aversion among investors) before adopting a hard-negative market outlook. So our present views remain driven by valuations and market action, not by the analysis below. As we approached early-2014, the dynamics of market prices were very well-described by the “log periodic” structure described by Sornette. The problem was that this period also featured aggressive quantitative easing and zero interest rates, while market internals continued to feature broad, uniform strength across a wide range of stocks, industries, sectors and security-types. The adaptations we imposed in 2014 would have substantially softened our defenses during that period. Currently, given obscene valuations and divergent market internals, Sornette’s approach is interesting and probably more relevant. Still, an improvement in the uniformity of market internals would soften our negative outlook even here. Sornette describes bubbles and crashes in terms of probabilities (emphasis mine): “Our key assumption is that a crash may be caused by local self-reinforcing imitation between traders. This self-reinforcing process leads to the blossoming of a bubble. The interplay between the progressive strengthening of imitation and the ubiquity of noise requires a probabilistic description: a crash is not a certain outcome of the bubble but can be characterized by its hazard rate, that is, the probability per unit of time that the crash will happen in the next instant, provided it has not happened yet. “Since the crash is not a certain deterministic outcome of the bubble, it remains rational for investors to remain in the market provided they are compensated by a higher rate of growth of the bubble for taking the risk of a crash, because there is a finite probability of ‘landing smoothly,’ that is, of attaining the end of the bubble without crash.” As Modigliani observed in 2000, the bubble is “rational” in a certain sense, provided that investors are inclined to self-reinforcing behavior. The problem is that as the bubble proceeds, the crash hazard rate begins to increase at an exponential rate. Sornette continues: “This line of reasoning provides us with the following important result: the market return from today to tomorrow is proportional to the crash hazard rate. In essence, investors must be compensated by a higher return in order to be induced to hold an asset that might crash. As the price variation speeds up, the no-arbitrage conditions, together with rational expectations, then imply that there must be an underlying risk, not yet revealed in the price dynamics, which justifies this apparent free ride and free lunch. The fundamental logic here is that the no-arbitrage condition, together with rational expectations, automatically implies a dramatic increase of a risk looming ahead each time the price appreciates significantly, such as in a speculative frenzy or in a bubble. This is the conclusion that rational traders will reach.” It’s difficult to tightly estimate a Sornette bubble that extends as long as the recent one has, without softening the shape parameters and accelerating the estimated rate of price appreciation. Still, here we are, so the following chart presents our best fit to the current episode. This isn’t a prediction by any means; our measures of valuation and market action are already unfavorable, so we would certainly not speculate on a continuation of the recent advance. What’s clear, however, is that any further speculative blowoff would be associated with an exponentially increasing crash hazard rate; to compensate, as Sornette suggests, for the apparent free-lunch.
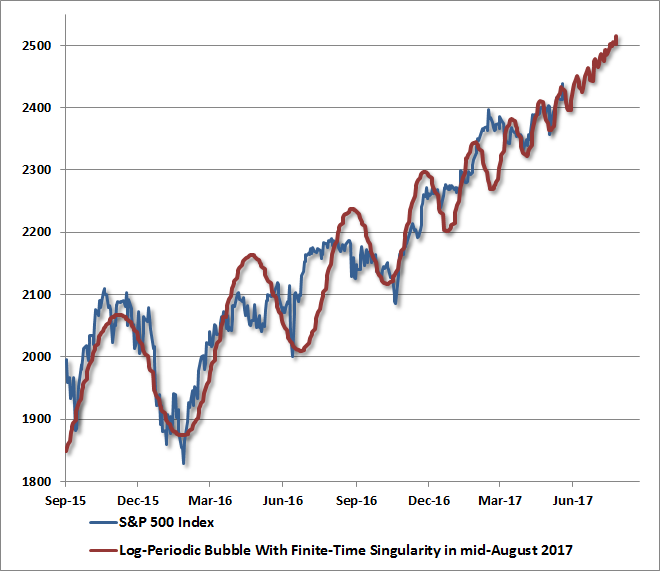
If we’re willing to sacrifice the longer-cycle fit in order to capture more of the local dynamics, we can nicely illustrate the “log periodic” feature that often characterizes bubbles. As I noted in 2004, speculative bubbles are typically marked by “increasingly immediate impulses to buy the dip.” This creates price fluctuations that have an accelerating pitch of urgency to them. This tendency has been very evident in recent months, as corrections have become increasingly shallow. Again, we don’t consider these to be predictive, and our most reliable measures already feature a hostile combination of extreme valuations and unfavorable market internals. Purely from a price-based perspective, however, the log-periodic bubble that best fits recent fluctuations has its singularity in mid-August. The point of this chart is not to forecast a price trajectory, but rather to illustrate the increasingly frequent and shallow character of market retreats, which is a more general feature of speculative blowoffs in market cycles across history.
So while our own discipline already takes a hostile view toward market risk, as the combined result of offensively elevated market valuations and divergent market internals on our measures, the near-term behavior of both market internals and general market fluctuations is worth monitoring. As I observed in real-time at the 2007 market peak, pre-crash markets often take on features of a “phase transition” that includes increasing volatility at short intervals: “I've noted over the years that substantial market declines are often preceded by a combination of internal dispersion, where the market simultaneously registers a relatively large number of new highs and new lows among individual stocks, and a leadership reversal, where the statistics shift from a majority of new highs to a majority of new lows within a small number of trading sessions. “This is much like what happens when a substance goes through a ‘phase transition,’ for example, from a gas to a liquid or vice versa. Portions of the material begin to act distinctly, as if the particles are choosing between the two phases, and as the transition approaches its ‘critical point,’ you start to observe larger clusters as one phase takes precedence and the particles that have ‘made a choice’ affect their neighbors. You also observe fast oscillations between order and disorder in the remaining particles. So a phase transition features internal dispersion followed by leadership reversal. My impression is that this analogy also extends to the market's tendency to experience increasing volatility at 5-10 minute intervals prior to major declines.” Presently, my sense is that investors should pay particular attention to leadership and divergences across groups of stocks, including the broad behavior of new highs and new lows among individual stocks. Any tendency toward increasing short-horizon volatility, particularly an accelerating frequency of progressively shallow corrections, would also be worth monitoring. These considerations don’t imply any need for short-term forecasts, trading, or other actions, but can be instructive about the behavior of speculators, and the potential for abrupt increases in risk-aversion.The foregoing comments represent the general investment analysis and economic views of the Advisor, and are provided solely for the purpose of information, instruction and discourse. Please see periodic remarks on the Fund Notes and Commentary page for discussion relating specifically to the Hussman Funds and the investment positions of the Funds. --- The foregoing comments represent the general investment analysis and economic views of the Advisor, and are provided solely for the purpose of information, instruction and discourse. Prospectuses for the Hussman Strategic Growth Fund, the Hussman Strategic Total Return Fund, the Hussman Strategic International Fund, and the Hussman Strategic Dividend Value Fund, as well as Fund reports and other information, are available by clicking "The Funds" menu button from any page of this website. |
|||||||||||||||||||||||||
|
For more information about investing in the Hussman Funds, please call us at
1-800-HUSSMAN (1-800-487-7626) 513-326-3551 outside the United States Site and site contents © copyright Hussman Funds. Brief quotations including attribution and a direct link to this site (www.hussmanfunds.com) are authorized. All other rights reserved and actively enforced. Extensive or unattributed reproduction of text or research findings are violations of copyright law. Site design by 1WebsiteDesigners. |