|
|
||||||
|
|

December 19, 2011 When "Positive Surprises" Are Surprisingly Meaningless In recent weeks, investors have abandoned all material concern about the likelihood of oncoming recession, largely because U.S. economic reports - though very tepid on an absolute basis - have come in persistently "better than expectations." Objectively, the best showing has been in new claims for unemployment. The 4-week average has eased slightly below 400,000 in recent weeks, to a level that would normally be consistent with slightly positive payroll growth, though not enough to absorb normal labor force growth (the unemployment rate dropped last month partly because hundreds of thousands of people stopped looking for work). My concern here is in taking these labor numbers as predictive, in the face of an abrupt drop in federal withholding tax deposits. As economist John Williams observes, "starting in October, a divergence developed: Whereas year-to-year change in BLS estimated payroll earnings continued at a more-or-less constant, positive level, tax receipts fell quite markedly. Where the Treasury numbers reflect full reporting, the BLS data are sampled, heavily modeled and usually heavily revised. The implication is that the BLS has overstated average earnings and payrolls meaningfully in recent months."
The pattern in withholding tax deposits mirrors what we've seen in a whole ensemble of reliable leading economic measures we track - a sharp initial deterioration in early August, followed by a slight bounce into October, followed by resumed weakness that reinforces our concerns about the economy (see Have We Avoided A Recession? ) Labor figures are subject to strikingly large seasonal adjustments. The seasonal adjustment factors for non-farm payroll employment vary between 1.0157 and 0.9920, which doesn't mean much until you put these numbers in context. Given total non-farm payroll employment of about 132 million workers, these adjustment factors mean that in any given month, the effect of seasonal adjustment on the reported payroll employment figure amounts to something between +2.1 million and -1.1 million jobs. Likewise, two-thirds of the new unemployment claims reports over the past year have been subsequently revised upward by several thousand. That's not to diminish the importance of these figures in economic analysis, but instead to emphasize the importance of smoothing and other forms of noise-filtering that reduce the impact of short-term volatility. Suffice it to say that the improvement in new unemployment claims strikes me as a legitimately hopeful development, but there is too much short-term noise, and inconsistency with other economic evidence (reliable leading indicators, falling tax withholdings) to draw a convincing signal. More broadly, the real question is how much importance should we put on the fact that economic data has delivered consistent "positive surprises" in recent weeks? Don't all these surprises significantly short-circuit the risk of probable recession? On that question, the evidence is very clear. No, they do not. In order to properly understand economic "surprises," it's important to recognize that unlike actual economic data, where fluctuations have to do with, well, the actual economy, economic surprises are - by definition - measured relative to the subjective expectations of economists and Wall Street analysts. Unfortunately, analysts tend to be all-or-none. Instead of allowing for a normal ebb-and-flow of data, they form expectations that overshoot both on the pessimistic side and on the optimistic side. As a result, once the economy experiences an initial softening, expectations turn lower, often very aggressively. Over the following weeks, economic data can continue to be fairly soft, but because expectations have collapsed, the new data is interpreted as being "above expectations." After a while, that experience of positive surprises causes analysts to over-correct by forming overly optimistic expectations, which is predictably followed by a period where the data, unless it is spectacular, almost cannot help but disappoint. My observation is that this cycle of optimism and pessimism tends to run just over 20 weeks in each direction, though that is certainly not a magic number of any kind, and is best interpreted as a tendency. To give you an idea of how this regular pendulum of hope and despair affects the data in practice, the chart below presents the Citigroup Economic Surprises Index (a tally of how often recent economic reports have either beat or fallen short of consensus expectations). The blue line, to the thrill of anyone who enjoys Trigonometry, is a sine wave with a period of 44 weeks.
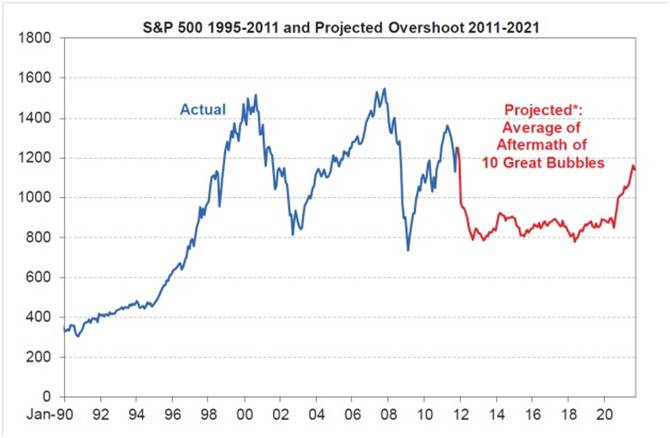
Notably, the Economic Surprises Index was near current levels just as the market was peaking before the 2007-2009 recession, was at a similarly high level just before the market collapsed violently in 2008, and reached a significant peak in March of this year, not far from where the S&P 500 topped out. Suffice it to say that the trend of positive economic "surprises" in recent weeks says more about the tendency of economic analysts to swing too far between optimism and pessimism than it does about the objective economic evidence, which remains tepid at best. How broad is your sample? On the subject of overshooting, Jeremy Grantham of GMO included a section called "No Market For Young Men" in his third quarter investment letter, with some fairly dismal comments about valuation cycles from a historical standpoint: "Historians would notice that all major equity bubbles (like those in the U.S. in 1929 and 1965 and in Japan in 1989) broke way below trend line values and stayed there for years. Greenspan, neurotic about slight economic declines while at the same time coasting on Volcker's good work, introduced an era of effective overstimulation of markets that resulted in 20 years of overpriced markets and abnormally high profit margins. In this, Greenspan has been aided by Bernanke, his acolyte, who has continued his dangerous policy. The first of the two great bubbles that broke on their watch did not reach trend at all in 2002, and the second, in 2009 - known by us as the first truly global bubble - took only three months to recover to trend. This pattern is unique. Now, with wounded [government and central bank] balance sheets, perhaps the arsenal is empty and the next bust may well be like the old days. GMO has looked at the 10 biggest bubbles of the pre-2000 era and has calculated that it typically takes 14 years to recover to the old trend. An important point here is that almost no current investors have experienced this more typical 1970's-type market setback. When one of these old fashioned but typical declines occurs, professional investors, conditioned by our more recent ephemeral bear markets, will have a permanent built-in expectation of an imminent recovery that will not come. "For the record, Exhibit 1 shows what the S&P 500 might look like from today if it followed the average flight path of the 10 burst bubbles described above. Not very pretty."
We can't disagree, though I also believe there still remains some short-run ability of policymakers to distort market forces, to badly misallocate capital in the process, and to wreck the economy more thoroughly in the long-run. The hope for QE3 continues to mount, despite the lack of evidence that QE2 had any meaningful effect except to bring a some pent-up demand forward and create a speculative investment environment that constantly depends on new doses of sugar to prop it up. Regardless, I'm comfortable that we can navigate a very wide range of potential scenarios that could emerge from here. It's worth repeating that our "stall" in 2009 and early 2010 was based on my insistence that our methods should perform strongly in Depression-era data and other periods of credit crisis outside of our traditional post-war U.S. dataset. Admittedly, the resulting ensemble models would, in hindsight, have been much more constructive than we were in practice during that period, but I insisted that we should "First, do no harm" until I felt confident that our methods could navigate arbitrarily extended periods of credit crisis and economic turmoil. I'm convinced that those efforts will prove their necessity in the years ahead. In any event, we now have far less concern over the prospect of the economy throwing something entirely "out of sample" at us. My suspicion is that analysts whose understanding of the investment markets is based solely on experience since the 1990's have absolutely no idea how far outside of that sample most of history lives. Facing a global economic downturn In the past few months, our own measures of economic risk have remained persistently unfavorable, as have the indications from the Economic Cycle Research Institute (ECRI). It is worth emphasizing that we have no hope or interest in seeing an economic recession. Rather, that is a conclusion that the data - at least data that reliably associates with recession - forces on us. As I've previously noted, the typical lead time is in the range of 13-16 weeks. This isn't a hard-and-fast rule. Rather, you estimate the "lead-time" of any indicator by calculating the correlation between the indicator and subsequent data that is observed a varying number of weeks or months later, and then finding where that correlation reaches its peak. For our measures, the signals tend to lead the data by 13-16 weeks (3-4 months). It has been about 15 weeks since our main composites turned negative, so while every cycle is different, I suspect that we are on the cusp of observable economic deterioration. There are undoubtedly lots of indicators that analysts can point at as anecdotal evidence that there is no recession risk. The issue for us is classification accuracy - does the data reliably discriminate between recessions and recoveries? A signal that says "it's always an expansion" will be correct most of the time. A signal that says "the state of the economy is always what it was last month" will always be right except at the crucial turning points, but relies on a "true" determination of recession or recovery that would not have been actually available in real time. What matters is the "confusion matrix" - how often was the observable signal correct when it turns out that there was an actual recession imminent or in progress, how often was the actual signal correct in periods that were later determined to include no recession, and how sparse are the mixed instances where the signal differed from the facts? For our part, we can't reconcile the data we are observing with an ongoing economic expansion. It's that simple. To extend the evidence beyond our own measures and ECRI's analysis, the chart below presents data (through October) from the Organization for Economic Cooperation and Development, an international quasi-governmental agency that sets international standards on a wide range of economic policy issues. The OECD publishes its own set of leading economic indicators on developed and developing countries. Notably, we've never observed deterioration to the extent that we presently observe, except when the U.S. was in or entering a recession.
The chart below is somewhat noisier, but conveys what we observe internationally - a concerted global economic downturn is unfolding here - not simply one or two countries. I should note that the China figures from the OECD typically run much higher than other nations around the world, so they are plotted on the right scale. But even there, the growth rate has dropped to levels that are consistent with a concerted global economic downturn. The composite ("Total") signal has never been at present levels outside of recession. The uniform downturn in these indices (including China on an adjusted basis) is difficult to align with the concept that the U.S. economy faces a near-term expansion.
Market Climate As of last week, the Market Climate for stocks remained characterized by unfavorably elevated valuations and an technical picture best described as a "whipsaw trap." Adding in the continued weakness in our leading economic measures and other factors produces an overall environment that remains "hard-negative." Present conditions cluster with other historical instances that have often accompanied abrupt 10-20% market plunges - not so consistently that we can use that outcome as a forecast for this particular instance, but often enough to define the present return/risk environment as unusually hostile. That said, we continue to recognize a slight seasonal bias to the last 10 days of the year in post-war data. The bias only averages out to 1.2%, and has a standard deviation twice as large, so it is not statistically compelling, and is so widely-anticipated this year that our contrarian skepticism is tweaked. Suffice it to say that seasonal factors slightly mitigate the hard-negative condition of the data, but certainly not by enough to try to snatch a penny off of the train track. Strategic Growth and Strategic International remain tightly hedged here. In Strategic Total Return, we continue to carry an average duration of about 3 years in Treasuries, where the prospect of further credit strains remains favorable for Treasuries, but where yields are already so depressed that small upward blips in yield can quickly wipe out a year or two of prospective interest. The Market Climate for precious metals shares continues to be favorable, but credit concerns, coupled with reduced expectations for ECB money-printing, have weighed on physical gold prices enough to break some widely-followed trend metrics. Given that overall conditions remain very favorable on our measures, our primary concern here is mainly just short-run volatility due to economic and credit concerns. We locked in gains in a few of our holdings, and deferred boosting our overall position back toward 20% just yet. Overall, Strategic Total Return presently holds about 14% of assets in precious metals shares - still a constructive position in light of continued favorable conditions, but restrained enough to accept the possibility of short-term volatility without much worry. --- Peace on Earth Wishing you a wonderful, merry Christmas, a bright, happy Hanukkah, and most of all, peace. Peace - very nice word. Easy to say, nice to envision, and somehow nearly impossible to achieve. Which means that something must be missing in how we think about it. For what it's worth, I think Albert Einstein was right - "Peace cannot be kept by force. It can only be achieved through understanding." My Buddhist friends would say that at its core, peace comes from the recognition that we don't exist as separate selves; from the willingness to see others as not so different, but made of the same substance, which is humanity. Mother Teresa said, "If we have no peace, it is because we have forgotten that we belong to each other." The same idea is there in the Hebrew word "shalom," which means not only peace, but wholeness, where no part is missing or damaged. My friend Thich Nhat Hanh, a Vietnamese Buddhist monk, often says that the first act of peace is for each side to recognize that the other side also suffers - possibly as a result of our own actions, or by our inaction, or as a result of misperceptions or lack of understanding - and out of that compassion, for each to have the desire for the other side to suffer less. To do that, it helps for us first to be in touch with all of the things in our own lives that we have a reason to be grateful for. As Thay says, "If in our daily life we can smile, if we can be peaceful and happy, not only we, but everyone will profit from it. This is the most basic kind of peace work." So wishing you peace - not just a cheerful, happy, beautiful word - but true peace. --- The foregoing comments represent the general investment analysis and economic views of the Advisor, and are provided solely for the purpose of information, instruction and discourse. Prospectuses for the Hussman Strategic Growth Fund, the Hussman Strategic Total Return Fund, the Hussman Strategic International Fund, and the Hussman Strategic Dividend Value Fund, as well as Fund reports and other information, are available by clicking "The Funds" menu button from any page of this website. |
|||||||||||||||||||||||||
|
For more information about investing in the Hussman Funds, please call us at
1-800-HUSSMAN (1-800-487-7626) 513-326-3551 outside the United States Site and site contents © copyright Hussman Funds. Brief quotations including attribution and a direct link to this site (www.hussmanfunds.com) are authorized. All other rights reserved and actively enforced. Extensive or unattributed reproduction of text or research findings are violations of copyright law. Site design by 1WebsiteDesigners. |