|
|
||||||
|
|

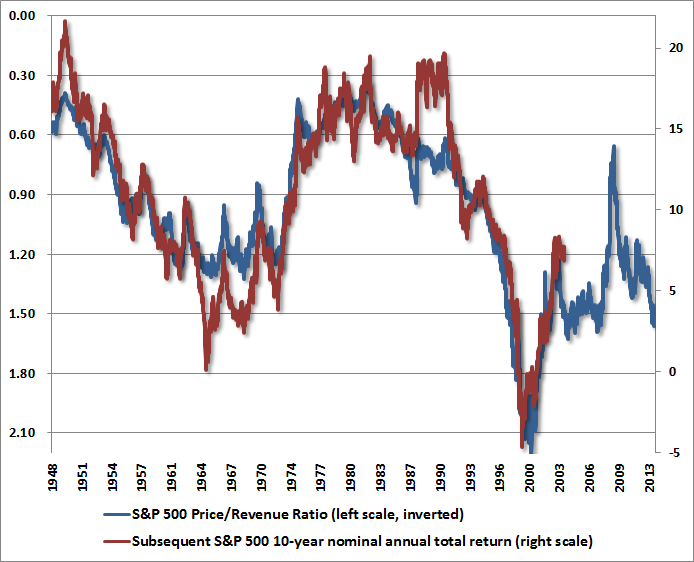
October 14, 2013 Short Horizon, Long Horizon In the midst of the debt ceiling talks, the nomination of Janet Yellen to succeed Ben Bernanke, a coming flurry of third quarter earnings, a government shutdown, and other features of the current situation, there are really only two considerations that we view as essential: one is the big picture from a full-cycle standpoint, and the other is the immediate return/risk profile that we estimate on the basis of prevailing, observable evidence. As always, our approach is to align our outlook with the expected market return/risk profile that we estimate at each point in time (on a blended horizon between about 2 weeks and 18 months), while also remaining aware of the long-horizon expected returns that are embedded into market valuations. Over history, and including the past decade, properly normalized valuations have remained a powerful guidepost for full-cycle and long-term returns, particularly on the horizon of 7-10 years. On that front, the current price/revenue multiple of the S&P 500 of 1.54 is now nearly double the historical norm prior to the late-1990’s bubble. The same is true for other useful metrics such as the market value of nonfinancial stocks to nominal GDP (based on Z.1 flow of funds data). With our broadest estimate of prospective S&P 500 10-year nominal total returns down to just 2.9% annually, 10-year Treasury bond yields at 2.7%, Treasury bill yields pinned at zero, and state and corporate pension assumptions still in the range of 7-8% annually, it appears quite likely that the coming decade will produce a widespread pension funding crisis in the U.S.
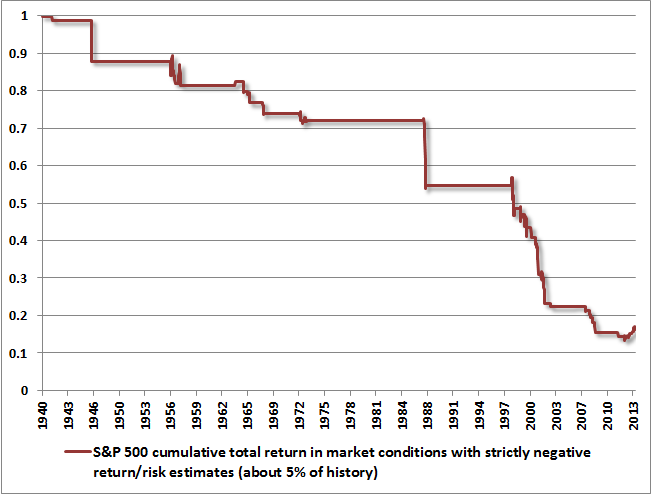
Meanwhile, the current Shiller P/E (S&P 500 divided by the 10-year average of inflation-adjusted earnings) of 24.2 is closer to 65% above its pre-bubble median. Despite the 10-year averaging, Shiller earnings – the denominator of the Shiller P/E – are currently 6.4% of S&P 500 revenues, compared to a pre-bubble norm of only about 5.4%. So contrary to the assertion that Shiller earnings are somehow understated due to the brief plunge in earnings during the credit crisis, the opposite is actually true. If anything, Shiller earnings have benefited from recently elevated margins, and the Shiller P/E presently understates the extent of market overvaluation. On historically normal profit margins, the Shiller P/E would be about 29 here. In any event, on the basis of valuation measures that are actually well-correlated with subsequent market returns, current valuations are now at or beyond the most extreme points in a century of market history, save for the final approach to the 2000 peak. Of course, valuations exert far more effect on long-term returns than on short-term outcomes, where a much larger set of considerations generally apply. Unfortunately, on shorter horizons, the past few years have been unusual. Market conditions that have historically resulted in awful losses over the intermediate-term have instead been associated with positive returns. The chart below shows the cumulative return of the S&P 500, restricted to periods with strictly negative estimated market return/risk profiles, based on our approach. These periods are typically associated with extreme “overvalued, overbought, overbullish” syndromes in which we take a hard-negative view of market risk. Strikingly, the majority of these losses have occurred in periods when the Fed was in an easing mode (see Following the Fed to 50% Flops). Notice the little advance in the red line at the right side of the chart. While this may seem negligible in the broad sweep of history, it has actually been a substantial percentage move. Along with a moderate additional amount of missed returns since 2010 where our estimates were zero rather than strictly negative (see The Lesson of The Coming Decade), and compounded by missed returns as we stress-tested our methods against Depression-era outcomes (despite their success in navigating the credit crisis), the extraordinary half-cycle since 2009 has caused us a great deal of frustration and a substantial fall from grace.
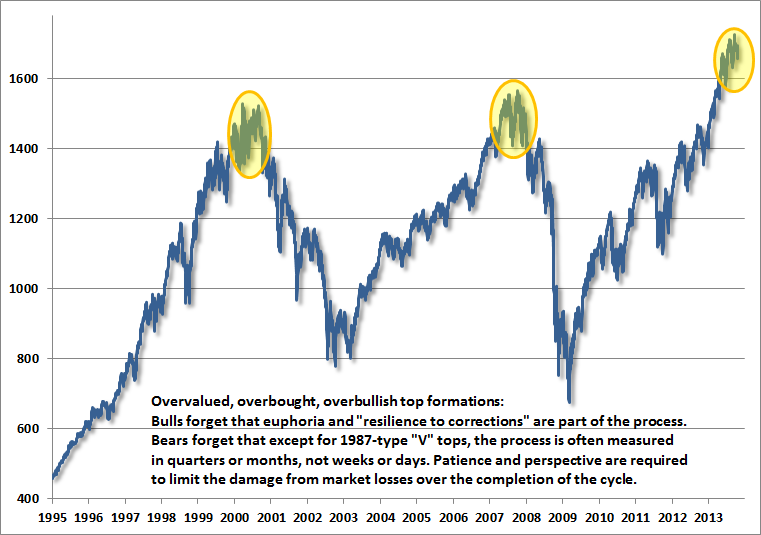
I expect the completion of this cycle to make this whole episode far less memorable, much as the 2000-2002 and the 2007-2009 collapses helped to clarify the basis for our defensiveness approaching those market peaks. Suffice it to say that I consider the stock market to be near the highs of a decidedly unfinished cycle. The upshot is fairly simple. We presently observe both a hostile long-term outlook from a valuation standpoint, and a hostile intermediate-term outlook from an estimated return/risk standpoint. The simple fact is that the market has advanced despite very negative return/risk estimates, particularly in the period since late-2011. While we constantly look for enhancements to our approach, we require them not only to be effective in recent data, but also to prove valid in numerous cycles across history. On all evidence, we’re far more inclined to view the position of stock prices as a temporary overextension of already extreme conditions than some durable change in the workings of the financial markets. So while the novelty and scale of monetary interventions in recent years have weakened the relationship between historically reliable measures and subsequent outcomes, even the Fed's own research suggests that the effects of quantitative easing are progressively diminishing toward zero, as investors increasingly perceive "an unexpected announcement of a more accommodative policy path as coming due to a weaker economic outlook." I continue to believe that much of the impact of QE is based on superstition - the result of investors misattributing the 2009 market rebound to monetary policy. It's certainly true that replacing $3.6 trillion of interest-bearing securities with zero-interest cash encourages investors to reach for yield in riskier securities, but that's not what ended the crisis. In hindsight, the risk of widespread bank insolvency ended the instant the Financial Accounting Standards Board relieved banks of any need for balance-sheet transparency, deciding in early-2009 to abandon mark-to-market accounting. Of course, it seems more heroic to attribute the recovery to courageous monetary policy than to applaud a handful of bureaucrats with green eyeshades for caving in to Congressional pressure and moving the banking system that much closer to a Ponzi scheme. The following chart places current market action in its larger context. Importantly, even assuming that the stock market is completing the upward phase of the present cycle, it may assist both patience and discipline to recognize that top formations can be drawn-out affairs involving months or even quarters of churning and apparent resilience. Given the potential for fiscal and monetary surprises, we can’t entirely rule out a final speculative “blowoff,” but we view that as a small risk warranting a correspondingly small amount of insurance against it. More importantly, we would view any such blowoff as a prelude to more rapid and severe market losses than might otherwise occur.
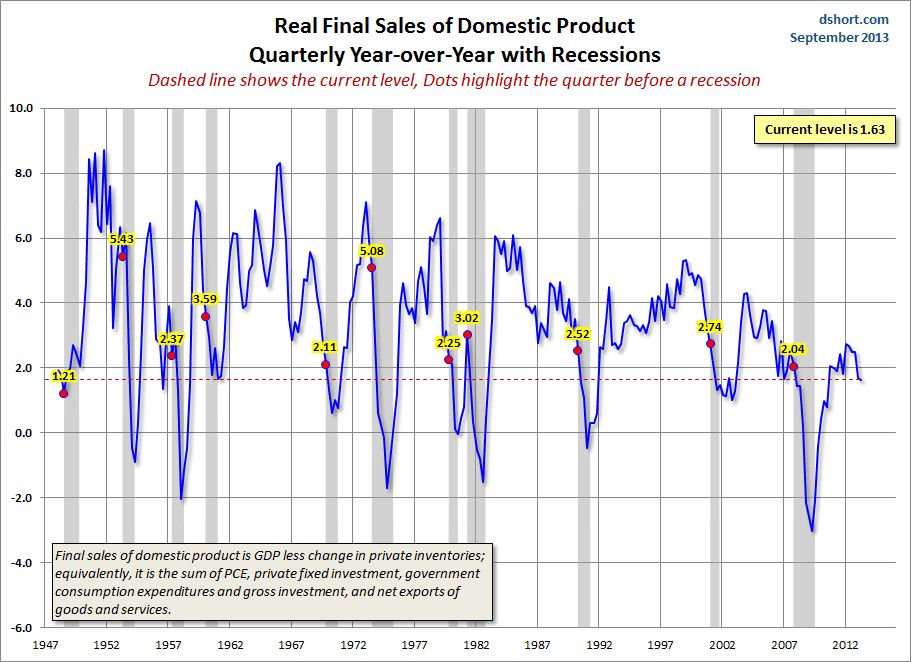
As a final note, we continue to view economic activity as much closer to the border of recession than is widely appreciated. New unemployment claims tend to reach their lows at bull market highs, and are not useful as forward-looking indicators. Moreover, we’ve observed a collapse in the correlation between historically more reliable leading measures (purchasing managers indices, Fed surveys) and subsequent economic outcomes over the past few years (see When Economic Data is Worse than Useless). Probably the most straightforward approach is to cut straight to key measures such as real GDP and real final sales, where year-over-year growth is already below the levels at which recessions have typically started. Given the predictive breakdown in a whole host of measures, it’s not clear that we should draw strong predictive conclusions from this evidence either. Still, it should be evident that the U.S. economy remains at levels of activity that have historically bordered recession. Doug Short always offers useful perspective on a wide range of data. The chart below is no exception.
Our over-arching perspective is that market conditions remain hostile, particularly from the standpoint of the complete market cycle. That perspective comes with the full recognition that the recent advance has occurred largely contrary to our more negative intermediate-term estimates of market return/risk. Our view remains that this is more likely to represent an extreme extension of already speculative and overvalued conditions, rather than a durable change in market dynamics. Frankly, that was also our perspective at the 2000 and 2007 market peaks, despite seemingly unique features of those instances. In any event, trust that we have no intention of abandoning the lessons of history in the belief that they no longer apply. That in itself is one of the lessons of history – every market collapse ultimately comes as a surprise to investors, because something always convinces them that this time should have been different. The foregoing comments represent the general investment analysis and economic views of the Advisor, and are provided solely for the purpose of information, instruction and discourse. Only comments in the Fund Notes section relate specifically to the Hussman Funds and the investment positions of the Funds. Fund Notes As of last week, Strategic Growth Fund remained fully hedged, with a “staggered strike” position that places the strike prices of its index put options close to prevailing market levels. The Fund continues to carry a small fraction of 1% of assets in out-of-the-money index call options as a contingency against near-term events (such as fiscal resolution) that might provoke a speculative blowoff, but this position is minimal and will not significantly affect day-to-day fluctuations in Fund value except in the event of a large and fairly immediate market advance. Strategic International remains fully hedged. Strategic Dividend Value remains hedged at about 50% of the value of its stock holdings. Finally, Strategic Total Return continues to carry a duration of just over 6 years (meaning that a 100 basis point move in interest rates would be expected to impact Fund value by about 6% on the basis of bond price fluctuations, though interest income, the shortening of maturity as time passes, and “convexity” all contribute to more favorable asymmetry between potential return and risk as time passes). On weakness in precious metals shares, among other factors, we also bumped the Fund’s holdings in that sector to about 8% of assets, with a small additional position in utility shares. --- The foregoing comments represent the general investment analysis and economic views of the Advisor, and are provided solely for the purpose of information, instruction and discourse. Prospectuses for the Hussman Strategic Growth Fund, the Hussman Strategic Total Return Fund, the Hussman Strategic International Fund, and the Hussman Strategic Dividend Value Fund, as well as Fund reports and other information, are available by clicking "The Funds" menu button from any page of this website. |
|||||||||||||||||||||||||
|
For more information about investing in the Hussman Funds, please call us at
1-800-HUSSMAN (1-800-487-7626) 513-326-3551 outside the United States Site and site contents © copyright Hussman Funds. Brief quotations including attribution and a direct link to this site (www.hussmanfunds.com) are authorized. All other rights reserved and actively enforced. Extensive or unattributed reproduction of text or research findings are violations of copyright law. Site design by 1WebsiteDesigners. |