|
|
||||||
|
|

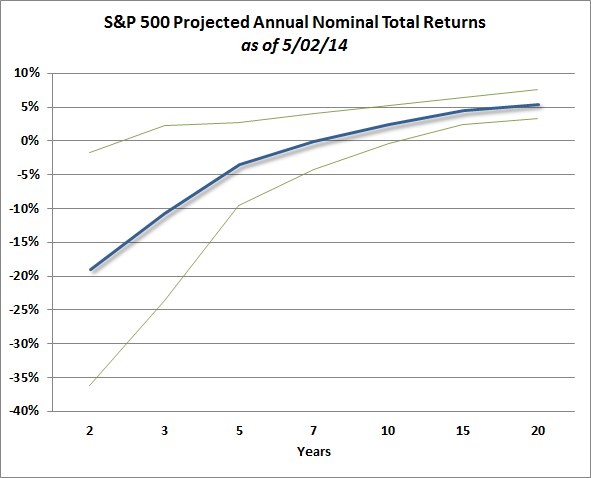
May 5, 2014 Cahm Viss Me Eef You Vahn to Live “Observation over many years has taught us that the chief losses to investors come from the purchase of low-quality securities at times of good business conditions. The purchasers view the good current earnings as equivalent to ‘earning power’ and assume that prosperity is equivalent to safety.” Benjamin Graham “I got wiped out personally in 1968, which was the last really crazy, silly stock market before the Internet era... I became a great reader of history books. I was shocked and horrified to discover that I had just learned a lesson that was freely available all the way back to the South Sea Bubble.” Jeremy Grantham “Cahm viss me eef you vahn to live.” Arnold Schwarzenegger, Terminator 2: Judgment Day We’ve recently emphasized that our estimates for probable S&P 500 nominal total returns have now declined below zero on every horizon of 7 years and shorter. At longer horizons, the 6.3% growth rate that we’ve assumed for nominal GDP over the coming years will begin to bail investors out given enough time, and as a result, our projection for 10-year S&P 500 nominal total returns peeks its head up above zero, at about 2.4% annually from current levels. Looking out 15 years, the expected 15-year total return approaches 4.4% annually, and at that horizon, investors are unlikely to lose money even if actual returns are a standard deviation below our expectations. To the extent that 6.3% growth in nominal GDP seems too high (and there are certainly reasons to think so), just reduce those annual return projections accordingly. The key point is this – everything that investors can expect to obtain from selling stocks 7 years from now is already on the table today. Valuations might move higher over the very short run, but at present valuations, investors would require a positive surprise more than one standard deviation above expectations just to pull the likely 2-year return out of negative territory. The chart below provides a quick summary of our return expectations for the S&P 500 – from current price levels – over a variety of investment horizons. I emphasize the phrase “from current price levels,” as a significant retreat in valuations is likely to dramatically shift this profile, as it has over the completion of every market cycle in history.
I was grateful last week for some very kind words from Jeremy Grantham at GMO, who is certainly one of my mentors despite having never actually met. Back in the late-1990’s, one of the ways that Grantham operationalized the word “bubble” was to ask if valuations were at least two standard deviations above their norm. On a bell-curve, about 95% of your observations will be within two standard deviations one way or another, so only about 2.5% of your observations will be beyond “two sigma” on the upside. Grantham observes that Robert Shiller’s “cyclically adjusted P/E” or CAPE is presently less than two sigmas above its historical norm, allowing for the potential for a bubble – under that definition – to carry the S&P 500 to 2250 if we allow an ugly CAPE to turn really ugly. Not that Grantham is actually bullish about this prospect, noting instead that it can be useful for prudent investors to imagine future pain “so that they can more easily process it and be less likely to do something foolish.” Still, for reasons noted below, we believe that stocks are already more overpriced than meets the eye. We very much agree with Grantham’s sentiment in that investors can only be expected to adhere to a given discipline if they fully understand the potential risks that might emerge over the course of the market cycle. The greatest discomfort for us is that in speculative, overvalued, overbought, overbullish markets, we’ll often look like idiots, lose credibility, and later recover a flood of followers who were bloodied in a completely predictable collapse that makes us look like evil geniuses. Years ago, Grantham noted the same tendency to “arrive at the winning post with good long-term results and less absolute volatility than most, but not necessarily the same clients that we started out with.” Having addressed our earlier stress-testing concerns, we certainly expect a much easier time in future cycles even if Fed-induced bubbles become the rule. We have the reverse concern about buy-and-hold investors in the major indices here – they seem to have entirely forgotten that there’s quite a good chance from current valuations that they’ll lose about half of their money in the next few years, even if stocks turn out to recover those losses with enough time (though probably more than about 7 years). As I noted in 2000 and 2007, the phrase “I’m a long-term investor” and the commitment to passive strategies often does not survive the full course of a bear market. While there’s no question that our own discipline has been subject to the most reckless bout of Fed-induced speculation in history, we also have reason to believe that valuations are much closer to a two-sigma event than may be apparent. The main reason is profit margins. Perhaps Grantham taught me too well, but I have always taken these words of his very seriously: “Profit margins are probably the most mean-reverting series in finance, and if profit margins do not mean-revert, then something has gone badly wrong with capitalism.” It turns out that he is still right, and the effect of being right is that equities are far more overvalued than may be evident even on measures like the Shiller CAPE (see An Open Letter to the FOMC: Recognizing the Valuation Bubble in Equities). The way to identify mean reversion is not simply to ask whether a variable has recently returned to its mean. The key is to ask whether elevated levels are associated with weak subsequent changes, and depressed levels are associated with strong subsequent changes (at least in evidence up to the present date). I don’t see anything in this dynamic that has changed – at all. All we observe is a half-cycle that is not yet complete.
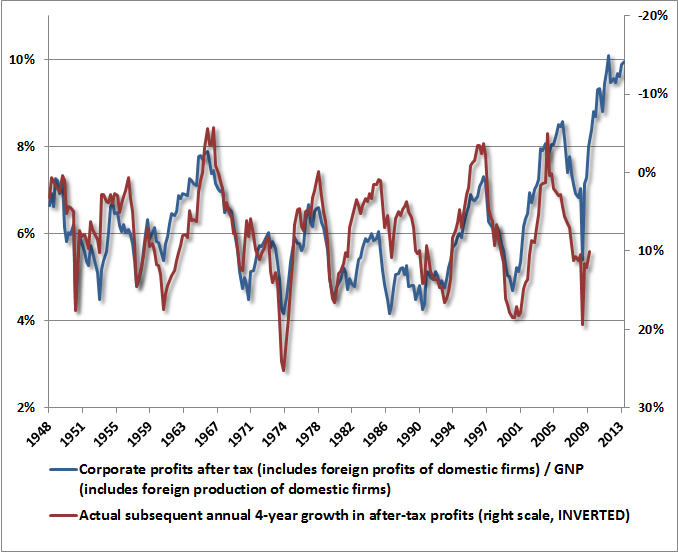
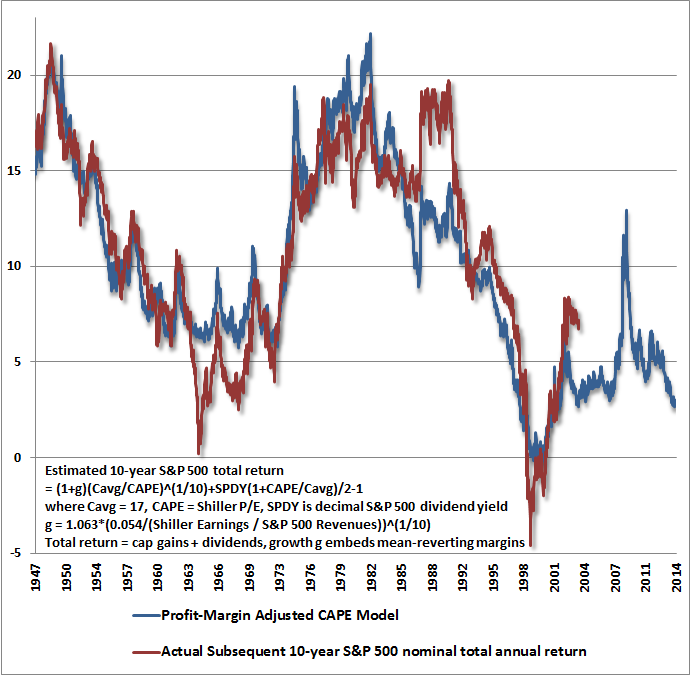
Now there’s no doubt that something has, indeed, gone badly wrong with capitalism in the recent economic cycle, but we hasten to add that stocks are not only a claim on one year or one cycle of cash flows, but are claims on a stream of future deliverable cash flows with an effective duration of about 50 years. Our concern about profit margins is not that earnings will retreat over the short-run and pull stock prices lower. While both may happen, the fact is that there is actually very little correlation between cyclical movements in earnings and cyclical movements in stock prices. Rather, our concern is that investors are pricing stocks on the assumption that current record profits can be used as a “sufficient statistic” for cash flows that will emerge decades and decades from today. That’s exactly what it means to value stocks as a multiple of say, forward operating earnings. It means that you’re taking current earnings as representative of the entire stream. As it happens, recently elevated margins are embedded into nearly every earnings-based valuation multiple, including the Shiller CAPE. We can see this by calculating the profit margin embedded into Shiller earnings (the denominator of the CAPE, divided by current S&P 500 revenues). That figure is about 6.5%, compared with a historical norm of about 5.4%. Adjusted for the level of profit margins, the present CAPE would be above 30. This adjustment has historically been important, as adjusting for that embedded profit margin significantly improves the relationship between the CAPE and actual subsequent market returns (something we can demonstrate both with algebraic return estimates and regression models – see Margins, Multiples, and the Iron Law of Valuation).
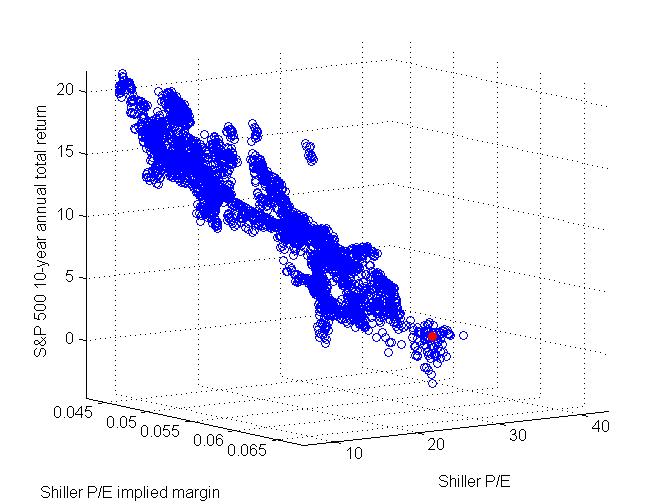
Another nice way to see this is to examine the evidence in 3D. If one creates as scatter plot of the Shiller P/E versus actual subsequent 10-year market returns, one gets a nice scatter, but a good deal of noise as well. But as I noted a few weeks ago, if two variables X and Y cooperate (either as a sum or as a product) in producing outcome Z, you will see that relationship very clearly by viewing a 3D chart of the data from the corner – maximum X and minimum Y, or maximum Y and minimum X. We’ve done that for the Shiller P/E below. The current point is shown in red. The implications for future market returns aren’t encouraging.
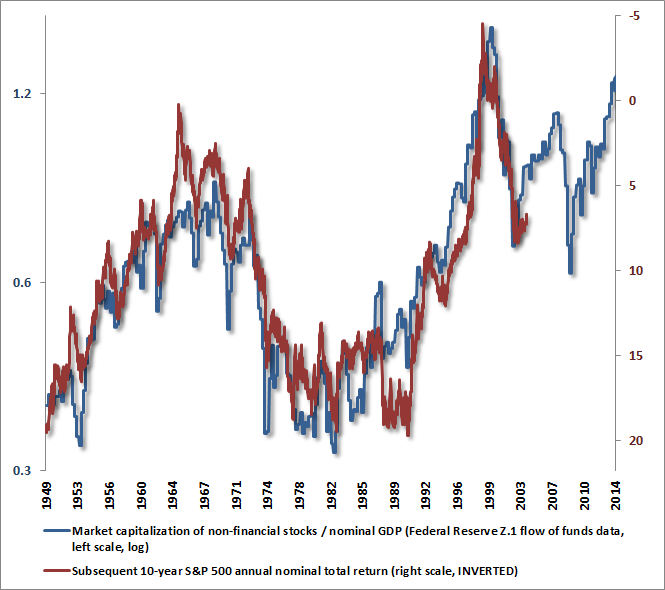
If you think about what we’re really after in valuing stocks, the goal is to estimate the likely future return that we are bargaining for, in order to ask whether that prospect is really worth the risk. The danger, after more than a decade of repeated Fed-induced bubbles, is that we allow ourselves to believe that valuation “norms” have drifted higher, without recognizing that these richer valuations are still associated with dismal long-term returns. For example, the following chart shows the relationship between market capitalization / GDP and actual subsequent S&P 500 total returns over the following decade. Notice that market returns are plotted on an inverted scale – higher levels on the graph imply negative returns. Now, it’s easy to see that market cap / GDP hasn’t reverted back to its mean for quite a long time. As a result, one might mistakenly assume that higher levels are now “normal.” The critical observation, however, is this metric is no less correlated with actual subsequent returns than in the past. Investors who assume that valuation measures have drifted higher should recognize that those higher valuations will still be associated with awful market returns over the coming decade.
What about interest rates? Don’t lower interest rates “justify” higher valuations? The answer is a qualified “yes” – the qualification being that current rich valuations will still produce dismal returns for stocks. It’s just that the Federal Reserve’s zero-interest rate policy makes investors feel forced to accept these dismal prospects. What is emphatically not true is that these higher valuations can somehow still be expected to be followed by “normal” long-term returns in stocks. Nothing could be further from reality. These Fed-induced speculative valuations are now evident across the board, as the median price/revenue multiple on S&P 500 components (as well as S&P 1500 components) is now the highest in history, easily exceeding the 2000 peak. The average price/revenue multiples of S&P 500 components are nearly the same as in 2000. It’s true that the largest of the large-cap stocks are less overvalued today than in 2000, but even on a capitalization-weighted basis, the difference is far smaller than one might think once profit margins are taken into account. Investors and even the Fed seem oblivious to the risks because they assume that recent earnings can be taken as a sufficient statistic for decades and decades and decades of future cash flows. Unfortunately, one does not obtain reliable measurements using a yo-yo. Taking the broad stock market as a whole, and considering all stocks – not simply the largest of the large caps – investors are now making the broadest and most leveraged bet on overvalued equities in U.S. history. Conditions somehow do not feel so dangerous because profit margins are cyclically extreme, but I suspect that this only means that investors will be surprised by the depth of the markets losses, as they were in 2000-2002 and 2007-2009. The lessons on this really are freely available all the way back to the South Sea Bubble. Meanwhile, with Bernanke out, the Federal Reserve no longer appears inclined to pursue his wildly experimental and financially distorting policies. That’s not a good mix for speculators, and there may not be much time left until Judgment Day. With regard to Fed policy, Janet Yellen seems far more concerned about employment than about monetary experiments, and as Axel Merk observes, she seems most inclined to show leadership on the regulatory side. On that front, changes in capital availability to small business would have a far greater effect than any amount of quantitative easing. With respect to the too-big-to-fail problem, Yellen has already emphasized the need for tougher bank capital standards – and we’d be particular fans of greater openness to impose capital requirements in the form of convertible debt with mandatory conversion provisions. Though I do think that Yellen is incorrect to believe that suppressed interest rates are de facto stimulatory to the economy or the labor market, I’m pleasantly surprised by the tone she has struck otherwise. I suspect the Yellen Fed (correctly) has a much higher tolerance for stock market losses than Bernanke, and that interventions in the case of market losses and economic weakness will take a different form than quantitative easing. As I also warned in 2007, investors relying on a “put option” from the Federal Reserve are likely to discover that the strike price is way out of the money. The foregoing comments represent the general investment analysis and economic views of the Advisor, and are provided solely for the purpose of information, instruction and discourse. Only comments in the Fund Notes section relate specifically to the Hussman Funds and the investment positions of the Funds. Fund Notes The Hussman Funds maintain a strongly defensive stance toward stocks, with a moderately constructive stance toward Treasury bonds and a modestly constructive stance toward precious metals shares. We're often asked "What's the alternative" to stocks, despite extraordinarily rich valuations on a broad variety of historically reliable metrics. It is important to recognize that it is precisely this question, and the repeated decision by investors that there is not alternative, that has driven stocks to these valuations. The legendary value investor Benjamin Graham --- The foregoing comments represent the general investment analysis and economic views of the Advisor, and are provided solely for the purpose of information, instruction and discourse. Prospectuses for the Hussman Strategic Growth Fund, the Hussman Strategic Total Return Fund, the Hussman Strategic International Fund, and the Hussman Strategic Dividend Value Fund, as well as Fund reports and other information, are available by clicking "The Funds" menu button from any page of this website. |
|||||||||||||||||||||||||
|
For more information about investing in the Hussman Funds, please call us at
1-800-HUSSMAN (1-800-487-7626) 513-326-3551 outside the United States Site and site contents © copyright Hussman Funds. Brief quotations including attribution and a direct link to this site (www.hussmanfunds.com) are authorized. All other rights reserved and actively enforced. Extensive or unattributed reproduction of text or research findings are violations of copyright law. Site design by 1WebsiteDesigners. |