|
|
||||||
|
|

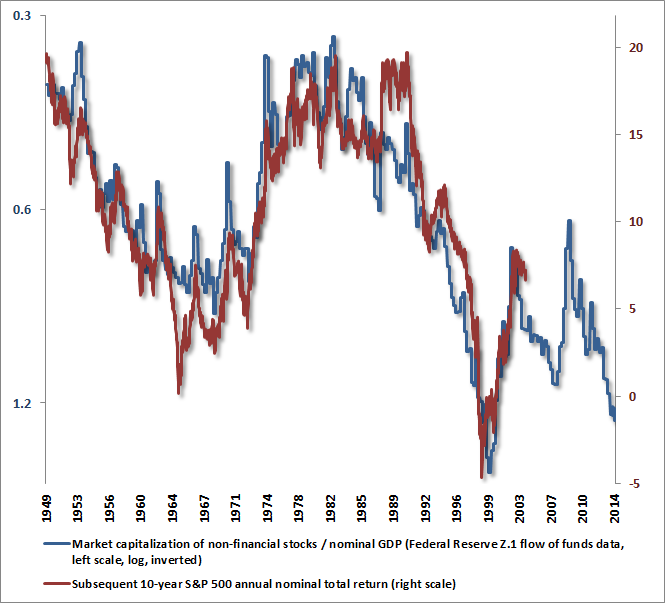
June 23, 2014 This Time is Different, Yet with the Same Ending There is one critical feature of the market advance of recent years that differs from prior bull market advances, and while it’s related to quantitative easing, the distinction is not quite as simple as that. In the market advances that culminated in the 1929, 1972, 1987, 2000 and 2007 pre-crash peaks, a combined syndrome of overvalued, overbought, overbullish conditions emerged in each instance. These syndromes can be defined in numerous and largely overlapping ways (see our October 2007 comment Warning: Examine All Risk Exposures for an example), but in general, once these syndromes appeared, steep market losses typically followed in fairly short order. In instances where they didn’t, the syndrome was usually a one-off outlier driven by a short spike in bullishness. Still, in no case did one observe repeated, increasingly severe overvalued, overbought, overbullish syndromes persisting entirely uncorrected and without consequence. The fact that there have been no historical exceptions to this pattern prior to the recent half-cycle has posed quite a challenge for us in recent years. As I detailed in Formula for Market Extremes, it forced us to adapt by imposing restrictions (based on factors such as market action across a range of risk-sensitive instruments) to mute our defensiveness even in conditions where historically-informed measures of prospective market return/risk are blazing red. We don’t get to re-live the recent cycle in a way that shows the effectiveness of any of that, but I expect it to be evident enough over the completion of the present cycle and the ones that follow, even in the event quantitative easing becomes a more frequent policy (though the unwinding challenges appear likely to make the whole episode regrettable). The Federal Reserve’s policy of quantitative easing has produced a historically prolonged period of speculative yield-seeking by investors starved for safe return. The problem with simply concluding that quantitative easing can do this forever is that even speculative assets have to compete with zero. When a safe zero return is above the medium or long-term return that one can estimate for a very risky asset, the rationale for continuing to hold the risky asset becomes purely dependent on expectations of immediate short-term price gains. If speculative momentum starts to break, participants often try to get out the door simultaneously – especially if there is some material event that increases general aversion to risk. That’s the dynamic that produces market crashes. I’m not saying a market crash is imminent, but it is a risk because very reliable valuation methods (that have remained reliable even in the recurring bubbles since the late-1990’s) presently estimate negative prospective nominal total returns for the S&P 500 on every horizon of 7 years or less, and an annual total return of about 1.9% over the coming decade. On the other hand, these same methods projected negative 10-year prospective returns – even on optimistic assumptions – at the 2000 peak (see the August 2000 Hussman Investment Research & Insight). While those projections turned out to be perfectly accurate (indeed, the 10-year total return of the S&P 500 was still negative even after the index had nearly doubled from its 2009 low), it also means that the overvaluation of the S&P 500 Index in 2000 was even greater than it is today. As I’ve noted before, the median S&P 500 component is more overvalued today than in 2000, and the average component is similarly overvalued. It’s only the capitalization-weighted valuation that was higher in 2000, primarily because of eye-popping valuations of large technology companies. In any event, it’s fair to say that valuations could go higher still, and we can’t rule that out. Historically, the emergence of similarly extreme overvalued, overbought, overbullish syndromes (as we also observed in 1929, 1972, 1987, 2000 and 2007) would suggest that the possibility is negligible – but we’ve been punished for our knowledge of history in this cycle. Overvalued, overbought, overbullish syndromes have now been extended without consequence for a much longer period than at any prior speculative extreme. Once you’ve seen a single flying pig, you’re forced to conclude that it’s at least possible for a pig to fly – even if you’re fairly sure it’s only been shot out of cannon. The best we can do here is to choose one of two courses: a) speculate that valuations will move still higher, waiting not only for 7-year but 10-year prospective returns to go negative, understanding that those dismal long-term returns will still emerge, but hoping that we can eke out some gains before the well runs dry and we’re forced to beat millions of other speculators to the door, or b) maintain a defensive stance, recognize that equity risk taken at present levels is likely to produce negative returns on horizons of 7 years and less, and that a 10-year expected annual nominal total return of 1.9% for the S&P 500 is not worth the commensurate risk, but adapt to a world of flying pigs by allowing them to float a bit more freely without raising the safety nets further. Our choice would be b). So yes, this time is different. It is different because the Federal Reserve’s zero-interest rate policy has starved investors of all sources of safe return, forcing them to accept risk at increasingly higher prices and progressively dismal long-term prospective returns. More importantly, this time is different because warning signs that appeared at every major pre-crash market peak have persisted and escalated, without resolution, far longer than they have done so historically. Reckless? Shortsighted? Probably. But like dot-com speculation, flipping overpriced houses, and getting a “yield pickup” by holding subprime mortgage debt on margin, reckless and shortsighted speculation always looks like enlightened investment genius until the hammer drops. Unfortunately, what is not different is that rich valuations are predictably followed by dismal long-term returns, even if short-term consequences are held in suspended animation for a period of time. What is not different is that compressed risk-premiums have a tendency to surge abruptly on events that are either entirely unexpected or, more often, that stem from recognized sources of risk that produce outcomes decidedly more negative than investors had assumed. What is not different is the habit at market extremes for investors to assign elevated price/earnings multiples to earnings that are themselves elevated and unrepresentative of the long-term stream of cash flows their investments will deliver (see Margins, Multiples, and the Iron Law of Valuation). We made these same observations (and debated them with many of the same analysts who deny them today) at the 2000 and 2007 pre-crash peaks, just before the market lost half its value. With the most reliable valuation measures more than 110% above their historical norms, on average (and allowing that numerous historically unreliable measures look just fine, as Janet Yellen will attest), we remain concerned that equities are no longer competitive even with a very long period of zero risk-free returns. Again, our broad measures of valuation imply a 10-year S&P 500 nominal total return averaging just 1.9% annually, and negative total returns on horizons of 7 years and less. Certain measures imply even worse, including the ratio of market capitalization to GDP, which Warren Buffett observed in a 2001 Fortune interview is “probably the best single measure of where valuations stand at any given moment.” The chart below shows that measure (left scale, log, inverted) against actual subsequent 10-year S&P 500 total returns (right scale). For greater detail on this and other measures, see my Wine Country Conference presentation “Very Mean Reversion” – and of course, a donation in any amount to the Autism Society of America, the beneficiary of that Conference, would be greatly appreciated.
Taken individually, we can find points in history where either market valuations, or bullish sentiment, or overbought conditions have been more extreme at one time or another than they are at present. Taken together, a syndrome of overvalued, overbought, overbullish conditions has uniquely identified the most extreme market peaks in history, and we’ve never observed this entire syndrome extended to more persistent and uncorrected excesses than we have in the present cycle. We’ve been forced to learn from that and to adapt to that continued risk. The problem for investors, again, is that as valuations have become increasingly extreme, prospective multi-year returns for risky securities have gradually moved to the point where they are below a zero risk-free return. On a risk-adjusted basis – that is, subtracting off some amount of prospective return as compensation for probable volatility and drawdown – we estimate that equities, corporate bonds, and junk debt are all uncompetitive with a zero risk-free return. We’re quite aware that in the short-run, they could become even less so as a result of even higher prices. The thing to remember is that poor long-term returns, along with volatility and deep drawdowns, are no less likely to arrive over the coming years. Quantitative easing has increased the pressure on investors to chase yield and drive securities to historically rich valuations in the short run. It has not, however, changed the fact that rich valuations imply dismal long-term market returns from here. This time is different, yet with the same ending. The half-cycle since 2009 has left us as confident about our discipline as it has left us humbled by the challenges that forced us to adapt. What Galbraith called “the extreme brevity of the financial memory” applies not only to the memory of how prior speculative episodes were completed, but also to the memory of how well our discipline guided us prior to our awkward stress-testing transition since 2009. We don’t expect similar challenges in the future – we’ve stress-tested our methods across a century of market history including Depression-era outcomes, and we’ve adapted to allow for the possibility that the quantitative easing experiment becomes a regular policy tool. Our present methods of estimating return/risk profiles aren’t terribly tolerant of risk-taking here, but they are far more flexible to accept market exposure over the full course of the market cycle than I think observers widely imagine. Those constructive opportunities will emerge soon enough, even if valuations never return to “normal” levels. As I’ve noted frequently, the strongest estimated market return/risk profiles are associated with at least a moderate retreat in valuations coupled with an early improvement in measures of market internals. We don’t rule out a retreat to historically undervalued levels at some near or distant point in the future, but very constructive investment opportunities in the interim would not require the market to retreat anywhere near historical valuation norms (which are presently more than 50% below current market levels). Meanwhile, we expect that the completion of the present cycle will be a welcome reminder that patient, informed discipline is as vital as ever. The foregoing comments represent the general investment analysis and economic views of the Advisor, and are provided solely for the purpose of information, instruction and discourse. Only comments in the Fund Notes section relate specifically to the Hussman Funds and the investment positions of the Funds. Fund Notes The Hussman Funds presently maintain a defensive stance toward equities and Treasury securities, with a continued constructive stance toward precious metals shares. The persistent amplification of overvalued, overbought, overbullish conditions appears much like games such as “Don’t Break the Ice” or “Don’t Break the Camel’s Back” – the latent risks increase progressively, but everything seems fine until it suddenly isn’t. Even with adaptations that could often have allowed a more aggressive investment stance in the half-cycle since 2009, our methods of estimating prospective market return/risk profiles are quite averse to accepting market risk at present extremes. Strategic Growth Fund remains fully hedged, but barring a decided widening of credit spreads or deterioration in market internals, we expect to be slow in raising the strike prices of the index put option side of our hedge further in the event that this speculative advance continues to greater extremes. From our perspective, this is an appropriate way to align ourselves with a negative expected return/risk profile and to maintain defense, while still allowing for further persistence of speculative conditions. In Strategic Total Return Fund, day-to-day fluctuations in net asset value are likely to be driven primarily by the Fund’s moderate holdings in precious metals shares, as we significantly reduced the Fund’s exposure to long-term Treasury bonds when 10-year yield fell well below 2.5%. The Federal Reserve appears to be taking a benign view not only toward speculation in equities, but also to the upward pressure in intermediate-term inflation pressures. That pressure accelerated after Yellen’s press conference, particularly as measured by inflation expectations implied by Treasury Inflation Protected Securities (TIPS). Our present expectation is that inflation pressures are likely to persist into about November, but a weakening of economic activity would reduce our inflation expectations beyond that point. As always, we’ll respond to the evidence as it emerges. For now, we maintain a fairly muted view toward Treasury debt, and a moderately constructive stance toward precious metals.--- The foregoing comments represent the general investment analysis and economic views of the Advisor, and are provided solely for the purpose of information, instruction and discourse. Prospectuses for the Hussman Strategic Growth Fund, the Hussman Strategic Total Return Fund, the Hussman Strategic International Fund, and the Hussman Strategic Dividend Value Fund, as well as Fund reports and other information, are available by clicking "The Funds" menu button from any page of this website. |
|||||||||||||||||||||||||
|
For more information about investing in the Hussman Funds, please call us at
1-800-HUSSMAN (1-800-487-7626) 513-326-3551 outside the United States Site and site contents © copyright Hussman Funds. Brief quotations including attribution and a direct link to this site (www.hussmanfunds.com) are authorized. All other rights reserved and actively enforced. Extensive or unattributed reproduction of text or research findings are violations of copyright law. Site design by 1WebsiteDesigners. |