|
|
||||||
|
|

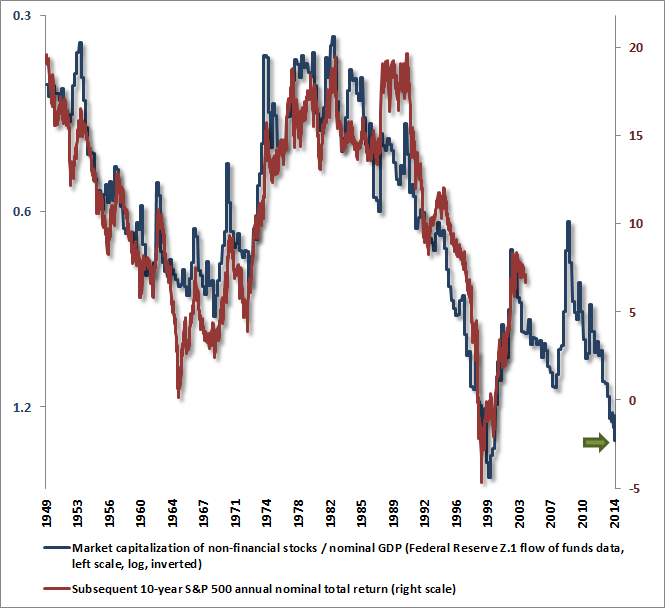
July 28, 2014 Yes, This Is An Equity Bubble After the 2000-2002 recession, the Federal Reserve remained fixed on holding down short-term interest rates in efforts to stimulate demand in interest-sensitive sectors of the economy. Corporations – particularly those with low quality balance sheets – were quick to take advantage of the low interest rates, swapping long-term debt for shorter-term debt. By late-2003 it was already obvious that this process was becoming a threat to longer-term economic stability, prompting me to ask: “the real question is this: why is anybody willing to hold this low interest rate paper if the borrowers issuing it are so vulnerable to default risk? That's the secret. The borrowers don't actually issue it directly. Instead, much of the worst credit risk in the U.S. financial system is actually swapped into instruments that end up being partially backed by the U.S. government. These are held by investors precisely because they piggyback on the good faith and credit of Uncle Sam.” Needless to say, this turned out badly. Meanwhile, deprived of a meaningful return on safe investments, investors looked for alternatives that might offer them a higher rate of return. They found that alternative in mortgage securities. Historically, home prices had never experienced a major and sustained decline, and mortgage securities were AAA credits. On that basis, investors chased mortgage securities in search of higher yield, and hedge funds sought to leverage the “spread” by purchasing massive volumes of higher yielding mortgage securities and financing those purchases using debt that was available a lower interest rate. The key here is that when the demand for securities of a particular type is high, Wall Street and the banking system have the incentive to create more “product” to be sold. So create it they did. In order to satisfy the yield-seeking demand for new mortgage debt that resulted from the Fed’s policy of suppressing the yield of safe alternatives, trillions of dollars of new mortgage securities were created. But how do you create a mortgage security? If you take the money of the investor, you actually have to lend it to someone to buy a home. In order to create enough supply, banks and Wall Street institutions began to lend to anyone with a pulse, creating a housing bubble, an increasing volume of subprime debt, and ultimately, the greatest financial collapse since the Great Depression. One would think the Federal Reserve would have learned from that catastrophe. Instead, the Fed has spent the past several years intentionally trying to revive the precise dynamic that produced it. As a consequence, speculative yield-seeking has now driven the most historically reliable measures of equity valuation to more than double their pre-bubble norms. Meanwhile, as investors reach for yield in lower-quality but higher-yielding debt securities, leveraged loan volume (loans to already highly indebted borrowers) has reached record highs, with the majority of that debt as “covenant lite” issuance that lacks traditional protections in the event of default. Junk bond issuance is also at a record high. Moreover, all of this issuance is interconnected, as one of the primary uses of new debt issuance is to finance the purchase of equities. Now, as we observed in periods like 1973-74, 1987, and 2000-2002, severe equity market losses do not necessarily produce credit crises in themselves. The holder of the security takes the loss, and that’s about it. There may be some economic effects from reduced spending and investment, but there is no need for systemic consequences. In contrast, the 2007-2009 episode turned into a profound credit crisis because the owners of the vulnerable securities – banks and Wall Street institutions – had highly leveraged exposure to them, so losing even a moderate percentage of their total assets was enough to wipe out their capital and make those institutions insolvent or nearly-so. At present, the major risk to economic stability is not that the stock market is strenuously overvalued, but that so much low-quality debt has been issued, and so many of the assets that support that debt are based on either equities, or corporate profits that rely on record profit margins to be sustained permanently. In short, equity losses are just losses, even if prices fall in half. But credit strains can produce a chain of bankruptcies when the holders are each highly leveraged. That risk has not been removed from the economy by recent Fed policies. If anything, it is being amplified by the day as the volume of low quality credit issuance has again spun out of control. Yes, this is an equity bubble A few notes on valuation and investment returns. First, as I’ve noted frequently in recent comments, it’s quite reasonable to argue that lower interest rates can “justify” higher valuations, provided that one also recognizes that those higher valuations will still be associated with commensurately lower future equity returns. At present, we estimate zero or negative nominal total returns for the S&P 500 on horizons of 8 years or less, and about 1.9% annual total returns over the next decade (see Ockham’s Razor and the Market Cycle for the arithmetic here, because such arithmetic has been quite accurate over the past century). If these prospects seem “fair” given the level of interest rates, that’s fine – one can then say that low interest rates justify current valuations – but that doesn’t change the outcome: the S&P 500 can still be expected to experience zero or negative total returns on horizons shorter than about 8 years (and even that assumes that corporate revenues and nominal GDP grow at their historical norm of about 6% annually in the interim). Second, one can quantify the impact that zero interest rates should have on valuations with simple arithmetic. Consider a 10-year zero-coupon bond that would be expected to yield, say, 6% in a world where Treasury bills yield 4%. That bond would trade at $55.84 (100/1.06^10). Now suppose Treasury bill yields were expected to be held at zero for 3 years, returning to 4% thereafter. Given the normal 2% yield spread, it would now be competitive for the 10-year bond to return just 2% for the first 3 years, then 6% thereafter. The price today that would produce that outcome is $62.67. So how much of an increase in valuation does 3 years of expected zero short-term interest rates (versus a normal 4%) have on valuation? 12%. Why 12%? 3 years times 4%. The higher valuation today essentially removes that amount of future returns. The same result holds in every scenario, and holds for equity valuations as well. At present, the most historically reliable valuation measures are more than 100% above pre-bubble historical norms that associate with normal equity total returns (about 10% annually). That implies that stocks are “fairly priced” here provided that short-term interest rates are expected to be held at zero until about 2040. Even if that turns out to be true, stocks will still experience long-term returns well below their historical norms in the interim. In the context of today's valuations, “fairly priced” simply means that investors agree that dismal future returns are “fair.” Investors who dismiss present market valuations by reflexively parroting the phrase “lower interest rates justify higher valuations” haven’t thought carefully about the problem or done the math, and that math is just basic arithmetic. My sense is that investors have indeed abandoned basic arithmetic here, and are instead engaging in a sort of loose thinking called “hyperbolic discounting” – the willingness to impatiently accept very small payoffs today in preference to larger rewards that could otherwise be obtained by being patient. While a number of studies have demonstrated that hyperbolic discounting is often a good description of how human beings behave in many situations, it invariably results in terrible investment decisions, particularly for long-term investors. As one economist put it, “they make choices today that their future self would prefer not to have made.” In effect, zero interest rates have made investors willing to accept any risk, no matter how extreme, in order to avoid the discomfort of getting nothing in the moment. Third, many investors realize that the most reliable valuation measures have never been higher except in the advance to the 2000 peak (and for some measures the 1929 and 2007 peaks), but they have started to treat these prior pre-crash peaks as objectives to be attained. While recent years have diminished our belief that severely overvalued, overbought, overbullish syndromes are sufficient to derail further speculation, it’s worth observing that present valuations are much closer to those prior peaks than is widely assumed. For example, Robert Shiller’s cyclically-adjusted P/E (CAPE) is constructed using the simple 10-year moving average of inflation-adjusted earnings. It turns out that one obtains a somewhat more predictive CAPE using exponential smoothing. This also avoids the jumpiness that sometimes results as elevated or depressed observations exactly 10-years prior are replaced. [Geek’s Note: An N-period exponential smoothing weights the current observation by 2/(N+1) and the prior average by (N-1)/(N+1). Also, when comparing P/E ratios with subsequent market returns, one should either use the log valuation measure or the earnings yield in order to reduce non-linearities]. On the basis of simple 10-year averaging, the current CAPE is 26, compared with 28 at the 2007 peak, 44 at the 2000 peak, and 33 at the 1929 peak. In contrast, on the basis of more reliable exponential smoothing, the current CAPE is still 26, but compares with the same level of 26 at the 2007 peak, 41 at the 2000 peak, and 27 at the 1929 peak. Moreover, the implied profit margin currently embedded in the CAPE (the earnings denominator of the CAPE divided by current S&P 500 revenues) is presently about 6.7% compared with a historical norm of about 5.3%. At normal profit margins, the current CAPE would be nearly 33. By contrast, the implied CAPE margin at the 2000 peak was a below-average 5%. At normal profit margins, the CAPE at the 2000 peak would have been about 38. Of course, we know that considering that embedded profit margin further increases the relationship between valuation measures and actual subsequent market returns (see Margins, Multiples and the Iron Law of Valuation). Make no mistake – this is an equity bubble, and a highly advanced one. On the most historically reliable measures, it is easily beyond 1972 and 1987, beyond 1929 and 2007, and is now within about 15% of the 2000 extreme. The main difference between the current episode and that of 2000 is that the 2000 bubble was strikingly obvious in technology, whereas the present one is diffused across all sectors in a way that makes valuations for most stocks actually worse than in 2000. The median price/revenue ratio of S&P 500 components is already far above the 2000 level, and the average across S&P 500 components is nearly the same as in 2000. The extent of this bubble is also partially obscured by record high profit margins that make P/E ratios on single-year measures seem less extreme (though the forward operating P/E of the S&P 500 is already beyond its 2007 peak even without accounting for margins). Recall also that the ratio of nonfinancial market capitalization to GDP is presently about 1.35, versus a pre-bubble historical norm of about 0.55 and an extreme at the 2000 peak of 1.54. This measure is better correlated with actual subsequent market returns than nearly any alternative, as Warren Buffett also observed in a 2001 Fortune interview. So if one wishes to use the 2000 bubble peak as an objective, we suggest that it would take another 15% market advance to match that highest valuation extreme in history – a point that was predictably followed by a decade of negative returns for the S&P 500, averaging a nominal total return, including dividends, of just 3.7% annually in the more than 14 years since that peak, and even then only because valuations have again approached those previous bubble extremes. The blue line on the chart below shows market cap / GDP on an inverted left (log) scale, the red line shows the actual subsequent 10-year annual nominal total return of the S&P 500.
All of that said, the simple fact is that the primary driver of the market here is not valuation, or even fundamentals, but perception. The perception is that somehow the Federal Reserve has the power to keep the stock market in suspended and even diagonally advancing animation, and that zero interest rates offer “no choice” but to hold equities. Be careful here. What’s actually true is that the Fed has now created $4 trillion of idle currency and bank reserves that must be held by someone, and because investors perceive risky assets as having no risk, they have been willing to hold them in search of any near-term return greater than zero. What is actually true is that even an additional year of zero interest rates beyond present expectations would only be worth a roughly 4% bump to market valuations. Given the current perceptions of investors, the Federal Reserve can certainly postpone the collapse of this bubble, but only by making the eventual outcome that much worse. Remember how these things unwound after 1929 (even before the add-on policy mistakes that created the Depression), 1972, 1987, 2000 and 2007 – all market peaks that uniquely shared the same extreme overvalued, overbought, overbullish syndromes that have been sustained even longer in the present half-cycle. These speculative episodes don’t unwind slowly once risk perceptions change. The shift in risk perceptions is often accompanied by deteriorating market internals and widening credit spreads slightly before the major indices are in full retreat, but not always. Sometimes the shift comes in response to an unexpected shock, and other times for no apparent reason at all. Ultimately though, investors treat risky assets as risky assets. At that point, investors become increasingly eager to hold truly risk-free securities regardless of their yield. That’s when the music stops. At that point, there is suddenly no bidder left for risky and overvalued securities anywhere near prevailing levels. History suggests that when that moment comes, the first losses come quickly. Many trend-followers who promised themselves to sell on the “break” suddenly can’t imagine selling the market 10-20% below its high, especially after a long bull market where every dip was a buying opportunity. This is why many investors who think they can get out actually don’t get out. Still, some do sell, and when those trend-following sell signals occur at widely-followed threshholds (as they did in 1987), the follow-through can be swift. By our count, the Dow has gone 709 trading days without a 10% correction, one of the 7 longest spans on record. Another two weeks and we’ll take out the 1929 instance. That said, I don’t view this as a particularly ominous statistic in itself – there’s too much variability – but even the longest ones ended at valuations at or lower than we presently observe. The long span of uncorrected speculation does reflect a lack of volatility that has helped to breed speculation and unrealistically low perceptions of risk. While even a 10% market loss could provide a moderately constructive opportunity provided that it is coupled with positive divergences and early improvement in market internals, be aware that much deeper losses can occur before that opportunity presents itself. Because of the effect of compounding, the 55% market loss in the S&P 500 during 2007-2009 was equal to first losing 25% of your money, followed immediately by another 40% loss. In practice, it was essentially the following sequence: -19%, +12%, -15%, +7%, -30%, +12%, -15%, +19%, -15%, +7%, -18%, +19%, -9%, +15%, -14%, +9%, -23%. Whatever potential gains remain in the present advance are likely to be nothing in the context of the variability (and opportunity) that we expect over the completion of the present cycle. We can’t rule out the possibility that the current advance will take stocks even higher. We just doubt that most investors will retain a bit of it even after the first leg down. If the Federal Reserve is historically informed, it should concentrate now on supervisory oversight of those areas where systemically interconnected institutions have major loans out to entities with thin capital structures and highly leveraged exposure to equities. Hedge funds and private equity firms are often the canaries in that coalmine, because their highly leveraged, lopsided bets typically fail first. Our nation lost its best opportunity to strengthen the financial system when policy makers dropped the ball on changes that might have required banks and other financial institutions to carry a significant portion of their funding in the form of mandatory convertible debt (which would change automatically to loss-bearing equity if the company approached insolvency). The best that can be done is for the Fed to scramble early enough to identify and contain the expansion of loans that directly or indirectly finance leveraged equity positions. There is not much benefit to be gained from surprising the market by ending QE prior to October, but the Fed should also begin talking now about suspending reinvestment of interest and principal payments starting in October. The marginal benefits of QE have already turned sharply negative by encouraging speculation and low-quality debt expansion, Failure to begin drawing down the balance sheet will only make future policy normalization more challenging. As investors, the problem is that we don’t know the point where a shift in risk tolerance will occur. We’re certainly seeing some increase in junk bond yields, and increasingly choppy market internals (where small capitalization stocks have been the clearest divergence), but given that the market has – so far – fought extreme overvalued, overbought, overbullish conditions that have historically been a severe warning for investors, we really have no strong opinion about the timeline. I doubt that the timing will matter even a few quarters from now, but our best response at this point is simply to maintain a defensive stance without fighting the market or taking investment positions that rely on immediacy of negative outcomes. That’s as much capitulation as one is likely to get from us here. Meanwhile, we remain eager to encourage greater exposure to market risk as conditions support it, particularly at the point where a material retreat in valuations is coupled with an early improvement in market internals. The foregoing comments represent the general investment analysis and economic views of the Advisor, and are provided solely for the purpose of information, instruction and discourse. Only comments in the Fund Notes section relate specifically to the Hussman Funds and the investment positions of the Funds. Fund Notes The Hussman Funds maintain a defensive stance toward equities and Treasury debt, with a moderately constructive stance toward precious metals shares. As I’ve noted before, we’ve decided that it is in the best interests of shareholders not to telegraph our investment positions or changes in detail, but given the importance of the present moment for long-term investors, some extended observations may be helpful. In Strategic Growth, we remain slow to raise the strike prices of the index put option side of our hedge in order to reduce their impact in the event of a further market advance. So unless the market declines materially, the major driver of day-to-day fluctuations in the Fund at present levels and higher is likely to be the difference in performance between the stocks held by the Fund and the indices we use to hedge. During earnings season, even one or two positive or negative surprises can jolt this difference a bit, so day-to-day fluctuations should be interpreted with that in mind. For all of the equity funds we manage, the quickest route to a substantially more constructive investment stance would be a retreat in valuations coupled with an early improvement in market action, but a range of moderately constructive responses may be available even on more limited changes in market conditions. We're certainly patient investors with a full-cycle horizon, but I can assure you that my “perma-bear” reputation is an artifact of stress-testing and other specific features of the half-cycle since 2009. After the 1990 bear market, I advocated a leveraged stance for years as the new bull market took hold, earning me a reputation as a "lonely raging bull" (to use the words of the Los Angeles Times). Similarly, following the 2000-2002 market plunge, we removed the majority of our hedges near the beginning of the bull market in early-2003. Though my insistence on stress-testing our methods against Depression-era outcomes eventually interfered, we also demonstrated a clearly constructive shift toward the market after stock prices collapsed as expected in late-2008. As I've frequently noted, our strongest market return/risk estimates are associated with a material retreat in valuations coupled with early improvement in market internals. Those conditions emerge in every market cycle. I should note that the most significant insight resulting from our 2009-early 2010 stress-tests was that both Depression-era data and the recent credit crisis compelled more demanding requirements on those measures of “early improvement.” In contrast, our valuation methods didn’t miss a beat, and have not changed. Though I’ve also always had a tendency to back away from risk too early in conditions where awful consequences have historically followed (and we’ve done a great deal of research to shorten that lead), our approach has been vindicated in cycle after cycle, and this was nicely reflected in our record by 2009. It’s difficult to overstate how dramatically the adaptations we’ve made would have affected our experience in the recent half-cycle since 2009. In historical data, about 52% of all periods reflect market return/risk estimates on our methods that are consistent with an unhedged or leveraged investment position. Frankly, we missed those opportunities during that 2009-early 2010 stress-testing period. On the defensive side, the more recent changes I’ve discussed in our reports have the effect of restricting our most aggressive hedge to only about 5% of all historical periods. In the present market cycle, most of those instances would be constrained to the period since April 2012, and represent only about a quarter of the periods since then, with the majority of those instances within the past 12 months. None of this relieves the difficult experience we’ve had during this half cycle, but one should not assume that this experience reflects a static “perma-bearish” investment approach. I have every expectation that a fully unhedged stance in equities will be within our range of investment positions as the present cycle completes. I doubt that our concerns about market risk will prove wrong over the completion of the present cycle, and if the experiences of 2000-2002 or 2007-2009 are any indication, I don’t expect that investors will have much regret about the path we’ve chosen by the time we complete the current cycle and begin the next bull market (you mean this one won’t last forever?). Meanwhile, there are enough managers willing to provide significant market exposure for investors who seek it here, or who wish to try their skill at timing their exit from a wholly uncorrected diagonal advance in a historically overvalued stock market. In bonds, we could certainly observe lower yields in response to geopolitical concerns or economic disruptions, but those risks appear evenly balanced with the risk of even modest inflation surprises and concerns about reduced Fed absorption of new supply. We don’t anticipate significant inflation in the present economic cycle, but plenty in the next, during the back-half of this decade. Inflation essentially reflects an increase in the “marginal utility” of goods that exceeds the increase in the “marginal utility” of an extra unit of cash. From that perspective, four things produce inflation: an upward shift in the demand for goods, a downward shift or shock in the supply of goods, an increase in the supply of cash to be held, or a reduction in the desire to hold cash balances (i.e. an increase in the “turnover” or “velocity” of money). While the Fed has created a great deal of money, the turnover or “velocity” of money has declined in almost exact proportion, so there has been very little effect on either real GDP or prices. Across history and around the world, a perfect recipe for inflation has been a supply shock, coupled with accelerated government deficit spending that feeds demand, along with a loss of confidence in the currency reflected by rising interest rates (remember that rising interest rates are often a symptom and accelerant, not a cure, for inflation). A good recipe for deflation has been a demand shortfall coupled with credit concerns that trigger a rush to hold cash balances. Federal Reserve policy has done an impressive job promoting the same massive issuance of low-quality debt that we saw during the housing bubble. Though we do expect an upward bias in inflation through about November, speaking more broadly it’s not at all clear that we won’t see a deflation on credit strains and recession in the next couple of years before we see significant inflation on recovery and later supply constraints. In precious metals, we’ve clipped our exposure a bit on strength, but in the context of tepid economic growth, slightly uptrending inflation, negative real interest rates, falling nominal bond yields, and gold stock prices that generally remain depressed relative to the price of physical gold, we remain moderately constructive.--- The foregoing comments represent the general investment analysis and economic views of the Advisor, and are provided solely for the purpose of information, instruction and discourse. Prospectuses for the Hussman Strategic Growth Fund, the Hussman Strategic Total Return Fund, the Hussman Strategic International Fund, and the Hussman Strategic Dividend Value Fund, as well as Fund reports and other information, are available by clicking "The Funds" menu button from any page of this website. |
|||||||||||||||||||||||||
|
For more information about investing in the Hussman Funds, please call us at
1-800-HUSSMAN (1-800-487-7626) 513-326-3551 outside the United States Site and site contents © copyright Hussman Funds. Brief quotations including attribution and a direct link to this site (www.hussmanfunds.com) are authorized. All other rights reserved and actively enforced. Extensive or unattributed reproduction of text or research findings are violations of copyright law. Site design by 1WebsiteDesigners. |