|
|
||||||
|
|

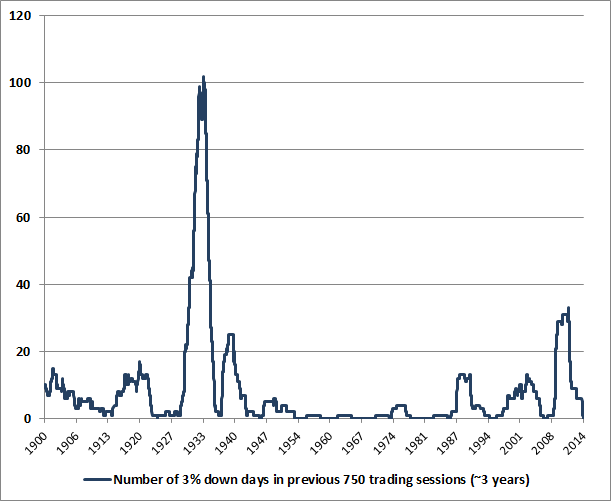
October 20, 2014 On the Tendency of Large Market Losses to Occur in Succession Abrupt market losses typically reflect compressed risk premiums that are then joined by a shift toward increased risk aversion by investors. In market cycles across history, we find that the distinction between an overvalued market that continues to become more overvalued, and an overvalued market is vulnerable to a crash, often comes down to a subtle but measurable shift in the preference or aversion of investors toward risk – a shift that we infer from the quality of market action across a wide range of internals. Valuations give us information about the expected long-term compensation that investors can expect in return for accepting market risk. But what creates an immediate danger of air-pockets, free-falls and crashes is a shift toward risk aversion in an environment where risk premiums are inadequate. One of the best measures of investor risk preferences, in our view, is the uniformity or dispersion of market action across a wide variety of stocks, industries, and security types. Once market internals begin breaking down in the face of prior overvalued, overbought, overbullish conditions, abrupt and severe market losses have often followed in short order. That’s the narrative of the overvalued 1929, 1973, and 1987 market peaks and the plunges that followed; it’s a dynamic that we warned about in real-time in 2000 and 2007; and it’s one that has emerged in recent weeks (see Ingredients of A Market Crash). Until we observe an improvement in market internals, I suspect that the present instance may be resolved in a similar way. As I’ve frequently noted, the worst market return/risk profiles we identify are associated with an early deterioration in market internals following severely overvalued, overbought, overbullish conditions. With respect to Federal Reserve policy, keep in mind the central distinction between 2000-2002 and 2007-2009 (when the stock market lost half of its value despite persistent and aggressive Federal Reserve easing), and the half-cycle since 2009 (when Fed easing relentlessly pushed overvalued, overbought, overbullish conditions to increasingly severe and uncorrected extremes): creating a mountain of low- or zero-interest rate base money is supportive of risky assets primarily when low- or zero-interest rate risk-free money is considered an inferior holding compared with risky assets. When the risk preference of investors shifts to risk aversion, Fed easing has provided little support for prices (see Following the Fed to 50% Flops), which is why we believe it is essential to read those preferences out of the quality of market action. Our most important lessons in the half-cycle since 2009 are not that overvaluation and overextended syndromes can be safely ignored. Historically, we know that these conditions are associated with disappointing subsequent market returns, on average, across history. Rather, the most important lessons center on the criteria that distinguish when these concerns may be temporarily ignored by investors from points when they matter with a vengeance. In other words, our lessons center on criteria that partition a bucket of historical conditions that are negative on average into two parts: one subset that is fairly inoffensive, and another subset that is downright brutal. Central to those criteria are factors such as deterioration in the uniformity of market internals, widening credit spreads, and other measures of growing risk aversion. Once that shift occurs, market declines often bear little proportion to whatever news item investors might latch onto in order to explain the losses. As Didier Sornette pointed out more than a decade ago in Why Stock Markets Crash, “the underlying cause of a crash will be found in the preceding months or years, in the progressively increasing build-up of market cooperativity, or effective interactions between investors, often translating into accelerating ascent of the market price (the bubble). According to this ‘critical’ point of view, the specific manner by which prices collapsed is not the most important problem: a crash occurs because the market has entered an unstable phase and any small disturbance or process may have triggered the instability. Think of a ruler held up vertically on your finger: this very unstable position will lead eventually to its collapse, as a result of a small (or an absence of adequate) motion of your hand or due to any tiny whiff of air. The collapse is fundamentally due to the unstable position; the instantaneous cause of the collapse is secondary. In the same vein, the growth of the sensitivity and the growing instability of the market close to such a critical point may explain why attempts to unravel the local origin of the crash have been so diverse. Essentially, anything would work once the system is ripe... exogenous, or external, shocks only serve as triggering factors. As a consequence, the origin of crashes is much more subtle than often thought, as it is constructed progressively by the market as a whole, as a self-organizing process. In this sense, the true cause of a crash could be termed a systemic instability.” Keep in mind that even terribly hostile market environments do not resolve into uninterrupted declines. Even the 1929 and 1987 crashes began with initial losses of 10-12% that were then punctuated by hard advances that recovered about half of those losses before failing again. The period surrounding the 2000 bubble peak included a series of 10% declines and recoveries. The 2007 top began with a plunge as market internals deteriorated materially (see Market Internals Go Negative) followed by a recovery to a marginal new high in October that failed to restore those internals. One also tends to see increasing day-to-day volatility, and a tendency for large moves to occur in sequence. An interesting feature of the recent air-pocket in stock prices is that many observers characterize the depth of the recent selloff as meaningful. What we’ve seen in recent weeks is very minor in a historical, full-cycle context. The market has not experienced even a single 3% down day in nearly 3 years. The chart below shows the cumulative number of 3% down-days in the Dow Jones Industrial Average over the prior 750 trading sessions, in data over the past century. It’s certainly not an indicator that we would use in isolation, but in given current valuations and the recent deterioration in market internals, we should not be surprised if this absence of large daily losses is short-lived.
I mention large down-days for a reason. A market crash comprises of a series of one-day losses that may be large, but are not particularly extraordinary in and of themselves. The problem is that they tend to occur in sequence rather than independently. In the chart above, you’ll notice that the cumulative total of 3%+ down days often spikes nearly vertically from zero, meaning that large down days tend to cluster. We may wish to believe that a 25-30% market plunge has zero probability since we know that the probability of a one-day loss of several percent is quite low, making a whole series of them seemingly impossible. But that view overlooks the tendency of large losses to occur in succession. It also overlooks the tendency for monetary easing to support stocks only when low- or zero-interest risk-free assets are considered inferior holdings in comparison to risky ones. In Didier Sornette’s words, analyzing a crash in terms of individual daily returns “is like a mammoth that has been dissected in pieces without memory of the connection between the parts... Independence between successive returns is remarkably well verified most of the time. However, it may be that large drops may not be independent. In other words, there may be ‘bursts of dependence’ ... leading to possibly extraordinarily large cumulative losses.” In short, recent weeks have seen a strenuously overbought record high in the S&P 500 featuring the most lopsided bullish sentiment (Investor’s Intelligence) since 1987, coupled with increasing divergence and deterioration across a wide range of market internals, including small-capitalization stocks, junk debt, market breadth, and other measures. With compressed risk premiums now joined by indications of increasing risk aversion, we remain concerned that risk premiums will normalize not gradually but in spikes, as is their historical tendency. Despite our concerns here, there’s no assurance that the present instance will be resolved the same way as similar conditions have been resolved historically. A fresh improvement in market internals would signal an easing of risk aversion or even a resumption of risk-seeking preferences. If that shift occurs following a meaningful retreat in valuations, the combination would represent one of the most constructive investment conditions we identify. So our outlook will shift considerably as the evidence changes. At present, conditions remain unfavorable, and the potential for abrupt and vertical losses should not be taken lightly. The foregoing comments represent the general investment analysis and economic views of the Advisor, and are provided solely for the purpose of information, instruction and discourse. Only comments in the Fund Notes section relate specifically to the Hussman Funds and the investment positions of the Funds. Fund Notes The Hussman Funds remain defensive toward equities, and modestly constructive toward Treasury bonds and precious metals shares. With market conditions in the same hostile configuration as we observed last week, the same considerations about day-to-day fluctuations apply. In Strategic Growth Fund, the recent decline has brought the major indices into the same range as the strike prices of the long index put option side of our hedges. Though those put options currently represent a small percentage portfolio value (and could lose that amount if the market was to advance between now and their late-year expirations if we were to hold them throughout such an advance), they are also likely to change in value if the market declines significantly. In that event, we would expect good amount of “give-and-take” depending on whether the market advances or declines on a given day. So in the event of a significant market loss from here, these positions will tend to account a significant portion of day-to-day changes in net asset value in both directions. We’ve long observed that deterioration in market internals and weakness in the “average stock” often precedes weakness in major indices (which are the most liquid vehicles for hedging). As a result, equity portfolios are likely to be somewhat more susceptible than usual to “tracking” differences between the stocks we hold long and the indices we use to hedge. With the broad NYSE Composite and the Russell 2000 down substantially more since their July 3 peak than the loss in the S&P 500 over the same period, there is something of a headwind to the selection of individual stocks at the moment. Indiscriminate selling may produce further periodic day-to-day headwinds until investors begin picking the wheat from the chaff a bit more deliberately. Day-to-day changes in net asset value will also be affected to some extent as this process – common to the early declines following cyclical market peaks – takes its course. --- The foregoing comments represent the general investment analysis and economic views of the Advisor, and are provided solely for the purpose of information, instruction and discourse. Prospectuses for the Hussman Strategic Growth Fund, the Hussman Strategic Total Return Fund, the Hussman Strategic International Fund, and the Hussman Strategic Dividend Value Fund, as well as Fund reports and other information, are available by clicking "The Funds" menu button from any page of this website. |
|||||||||||||||||||||||||
|
For more information about investing in the Hussman Funds, please call us at
1-800-HUSSMAN (1-800-487-7626) 513-326-3551 outside the United States Site and site contents © copyright Hussman Funds. Brief quotations including attribution and a direct link to this site (www.hussmanfunds.com) are authorized. All other rights reserved and actively enforced. Extensive or unattributed reproduction of text or research findings are violations of copyright law. Site design by 1WebsiteDesigners. |