|
|
||||||
|
|

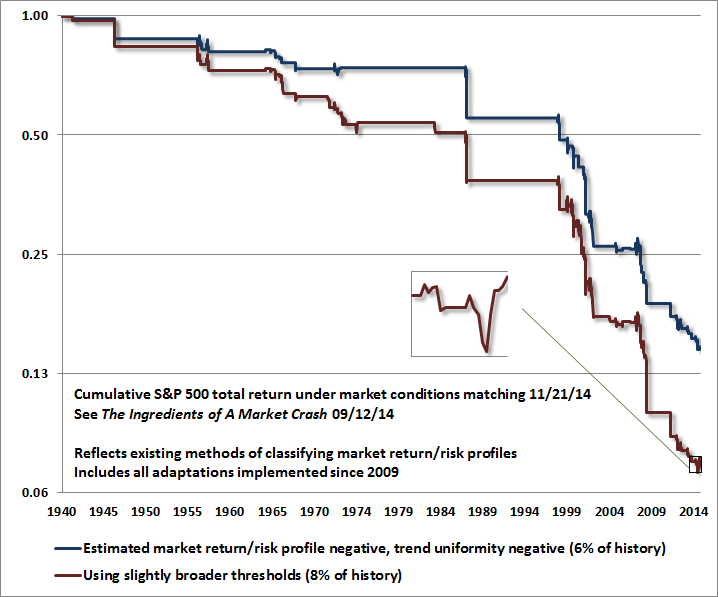
November 24, 2014 A Most Important Distinction “Science is the systematic classification of experience.” – George Henry Lewes I’ve noted frequently in recent months that the lessons to be drawn from the recent market cycle are not that historically overvalued, overbought, overbullish extremes can be dismissed. Rather, the lessons to be drawn have to do with the criteria that distinguish when such extremes have little near-term impact from periods where they suddenly matter with a vengeance. Although we agree, as John Templeton once observed, that the four most dangerous words in investing are “this time it's different,” the fact is that one very specific effect of quantitative easing made the half-cycle since 2009 different from history, and forced us to struggle quite a bit. Market cycles throughout history have demonstrated an important regularity: once a syndrome of overvalued, overbought, overbullish conditions was established (not one condition alone, but the full syndrome), the behavior of the stock market took on what I’ve often called an “unpleasant skew” – the market would typically follow with a few weeks of persistent small advances, followed by an abrupt and steep vertical plunge that wiped out weeks or months of gains in a handful of sessions. In the face of quantitative easing, however, that pattern changed. As short-term interest rates have been held near zero, investors have been drawn into “carry trade” mentality, believing that they must take risk in stocks, regardless of valuation, because they have “no other choice.” Given that mentality – and make no mistake, this is psychology at work, not financial calculation – overvalued, overbought, overbullish syndromes have persisted and extended in the half-cycle since 2009, often with no downside effects at all. Admittedly, I relied too heavily on the wicked historical record of these syndromes. But rather than discarding the lessons of history altogether, we did what we always do when faced with a challenge – which is to look for adaptations that are consistent both with historical fact and with new evidence. The upshot is this. Quantitative easing only “works” to the extent that default-free, low interest liquidity is viewed as an inferior holding. When investor psychology shifts toward increasing risk aversion – which we can reasonably measure through the uniformity or dispersion of market internals, the variation of credit spreads between risky and safe debt, and investor sponsorship as reflected in price-volume behavior – default-free, low-interest liquidity is no longer considered inferior. It’s actually desirable, so creating more of the stuff is not supportive to stock prices. We observed exactly that during the 2000-2002 and 2007-2009 plunges, which took the S&P 500 down by half in each episode, even as the Fed was easing persistently and aggressively. A shift toward increasing internal dispersion and widening credit spreads leaves risky, overvalued, overbought, overbullish markets extremely vulnerable to air-pockets, free-falls, and crashes. What’s rather beautiful about this distinction is that it applies equally well to bubble periods such as the late-1990’s, the housing bubble, and on imputed sentiment data, the advance to the 1929 peak, and these considerations help to identify the shifts that invited subsequent crashes. So unless one believes there’s something magical about quantitative easing that goes beyond any well-articulated or identifiable transmission mechanism, it’s quite a good idea to pay close attention to market internals and risk premiums here. In the June 16, 2014 comment Formula for Market Extremes I discussed the challenges we’ve experienced in the half-cycle since 2009, and how we’ve addressed them. In that comment, you’ll see the particular beast that we’ve had to address in this cycle – the tendency for overvalued, overbought, overbullish syndromes to be followed by persistent advances in recent years (contrary to historical experience). I also describe the overlay restrictions that we developed to partition those environments between instances that were associated with benign outcomes from those that invited collapse. In the September 29, 2014 comment The Ingredients of a Market Crash, I discussed the importance of deteriorating market internals and widening credit spreads in distinguishing overvalued markets that continue to advance from those that are liable to air pockets, free-falls, and crashes. I have no interest in converting anyone to our views (especially the haters, because as Taylor Swift sings, haters gonna hate, hate, hate, hate, hate), but for those who appreciate and trust our work, you can be certain that we’ve addressed these challenges in a way that validates in market cycles across a century of history, including the period since 2009. The chart below shows the cumulative total return of the S&P 500 Index restricted to periods matching the return/risk profile that we presently observe. The flat periods are those where other (neutral or favorable) profiles were observed. The vertical drops are exactly that – vertical market plunges during conditions that match the same return/risk profile that we observe at present. The only difference between the red and blue lines is the severity of conditions that define those profiles. The red line captures about 8% of all historical periods and a larger amount of total downside for the S&P 500, while the blue line captures about 6% of all periods. Current conditions satisfy both the broad and narrow thresholds.
Now, these historical outcomes don’t ensure that future ones will be similar, but given that the S&P 500 has lost value at an average annualized rate of about -35% during these conditions, it’s clear that defensive strategies such as the use of index put options have generally been well supported at such points. It’s the periods outside of these conditions that have been neutral or challenging for defensive stances, on average. Our lessons to that effect have been hard-won. Don’t imagine that we haven’t incorporated them into our work, and don’t imagine that things will go well for those who ignore these distinctions in the unhesitating belief that this time is different. Notice the little inset, which reflects the past few months. While the conditions we presently observe captured the market plunge in October nicely, we’ve observed a low-volume short-squeeze in recent weeks, which has been assisted by the “announcement effect” from the Japanese, European and Chinese central banks. As is evident from careful review, that sort of brief advance is certainly something we’ve observed before under these conditions. These can be uncomfortable in the short-run, even though the severe average market losses in these conditions make those rallies hard to spot. We certainly experienced the same thing in real-time in 2000 and 2007. So, at least for now, the recent advance from the October lows has not changed our concerns. Widening credit spreads remain problematic, and the low volume short-squeeze since mid-October has produced less internal repair than would signify a robust shift toward risk-seeking investor preferences. It’s important to recognize that even in the bull market half-cycle since 2009, periods of overvalued, overbought, overbullish conditions, when coupled with deteriorating market internals and/or widening credit spreads, have been associated with significant market losses on average (as should be evident from the foregoing chart). As a side note, the reason I emphasize that the effect of QE is psychological is that one can calculate the impact that a given period of zero interest rates should have on the discounted value of future cash flows. I’ll say this again – if historically normal equity valuations and prospective returns are associated with short-term rates averaging, say, 4%, one can show with straightforward discounting arithmetic that the expectation of zero interest rates for 3-4 years will result in a justified 12-16% increase in valuations over and above historical norms. On valuation measures that are best correlated with actual subsequent S&P 500 total returns (and many popular measures are quite weak on that record), we presently estimate that the S&P 500 is about 115% above historical valuation norms. Put another way, we estimate nominal total returns of less than 1.4% annually for the S&P 500 over the coming decade, with negative total returns over the next 8 years. So if one believes that zero interest rates are likely to persist for another 8 years, and that stocks should be priced with zero return or premium for risk, stocks are probably fairly valued. If one believes that zero interest rates are likely to persist for another three decades, but stocks should be priced with normal historical risk premiums over and above risk-free rates, stocks are also probably fairly valued. In every other universe, stocks are about double historically normal valuations, even adjusting for the likelihood of several more years of zero short-term rates. In my view, we can be comfortable even with the possibility that central banks will pursue quantitative easing for many years to come. First, we know that valuations are much richer here (and prospective returns much lower) than in recent years where quantitative easing exerted its speculative effects. The expectation of an additional year of QE is only “worth” a bump in prices about 4% above historical valuation norms, and an additional 6 months is only "worth" a bump of about 2%. The way asset pricing works is that those gaps between prices and normal valuations then narrow over time as prices decline or grow slower than fundamentals and fair value. Once prices finally meet historical valuation norms, expected future returns on the security also finally meet their historical norms (for U.S. equities, that's about a 10% expected long-term nominal return). Of course, given equity prices that are already about 115% above historical valuation norms on the most reliable valuation measures, there's already quite a long period of zero or negative returns baked in the cake. While QE might conceivably hold valuations at a higher plateau, we would still expect volatility – if more muted than in normal cycles – around it. My actual expectation is that the S&P 500 will lose half of its value over the completion of this cycle, but even if stocks have reached a “permanently high plateau” it will likely include tradable departures from a diagonal line. More importantly, quantitative easing should not be taken as automatically equivalent to “higher stock prices.” The distinction between periods of speculative risk-seeking and risk-aversion (largely measurable through the behavior and uniformity of market internals) is critical. As noted above, those distinctions have been quite effective at partitioning market losses from market gains even since 2009. Financial markets don't invite assurances, but given the adaptations we've made, we expect our methods of classifying return/risk profiles to navigate the market nicely even in the (unlikely) event that the next few years look quite like the past few. A shift back to risk-seeking would not make stocks any less overvalued, so various hedges and safety nets are still likely to be necessary. But there are many shades of risk-taking between red and green. In short, we need not fear the possibility that various forms of QE could persist for a much longer period. That said, it’s worth noting that the inclinations of central banks toward quantitative easing and interest rate suppression are increasingly taking on a tone of desperation in the face of accelerating economic weakness in Japan, Europe and China. While the stated objective is to increase inflation, low inflation isn’t really the economic problem – low growth, intolerable debt burdens, and misallocated capital are at the core of global challenges here. Unfortunately, QE only misallocates capital toward more speculation and low-quality debt (primarily junk and leveraged loan issuance), without much impact on real growth. China’s move was prompted in part by a surge in bad loans to the highest level in nearly a decade. The largest European banks now have gross-leverage ratios as high as 30-to-1 (during the credit crisis, one could order the sequence of defaults accurately using this metric, with Bear Stearns, Lehman, and Fannie Mae right at the top). But liquidity does not create solvency, and with credit spreads widening, the growing desperation of monetary authorities is more a negative signal than a positive one. This is much like what we saw in 2007-2008: when concerns about default are rising, default-free, low-interest rate money is not considered to be an inferior asset, and as a result, its increased availability does not provoke risk-seeking behavior. If we observe narrowing credit spreads and stronger uniformity in market internals, we will be able to infer a shift toward risk-seeking (and in turn, a greater likelihood that monetary easing will provoke further speculation). That won’t make stocks any cheaper, and downside risk will still need to be managed, but our immediate concerns would be less dire. At present, current market conditions and the lessons of history encourage us to be aware that very untidy market outcomes could unfold in very short order. The foregoing comments represent the general investment analysis and economic views of the Advisor, and are provided solely for the purpose of information, instruction and discourse. Please see periodic remarks on the Fund Notes and Commentary page for discussion relating specifically to the Hussman Funds and the investment positions of the Funds. --- The foregoing comments represent the general investment analysis and economic views of the Advisor, and are provided solely for the purpose of information, instruction and discourse. Prospectuses for the Hussman Strategic Growth Fund, the Hussman Strategic Total Return Fund, the Hussman Strategic International Fund, and the Hussman Strategic Dividend Value Fund, as well as Fund reports and other information, are available by clicking "The Funds" menu button from any page of this website. |
|||||||||||||||||||||||||
|
For more information about investing in the Hussman Funds, please call us at
1-800-HUSSMAN (1-800-487-7626) 513-326-3551 outside the United States Site and site contents © copyright Hussman Funds. Brief quotations including attribution and a direct link to this site (www.hussmanfunds.com) are authorized. All other rights reserved and actively enforced. Extensive or unattributed reproduction of text or research findings are violations of copyright law. Site design by 1WebsiteDesigners. |