
|
|
||||||
|
|

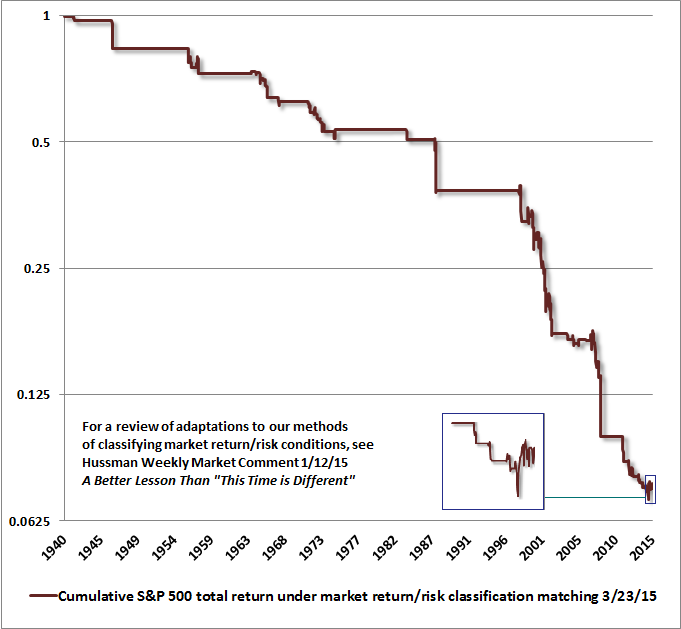
April 27, 2015 Fair Value on the S&P 500 Has Three Digits We continue to classify market conditions among the most hostile expected return/risk profiles we identify. The current profile joins rich valuations with continued evidence of a subtle shift toward risk aversion among investors, which we infer from market internals (a variant of what we used to call “trend uniformity”), credit spreads, and other risk-sensitive measures. Liquidity in both the stock and bond markets is thinning considerably. In bonds, quantitative easing by global central banks has resulted in a scarcity of available collateral, a collapse in repo liquidity, and increasing frequency of delivery failures, all of which is shorthand for a bond market that is becoming less liquid and more fragile to any credit event. Meanwhile, risk premiums are minuscule. Avoiding a negative total return on 10-year bonds now requires that interest rates must not rise by even one percentage point over the next three years. Bond yields have historically covered investors against a meaningful change in yields before resulting in negative total returns. On a one-year return horizon, bond yields presently cover investors for a yield change amounting to only about 0.25 standard deviations – matching mid-2012 as the lowest level of yield coverage in history. In equities, price-volume action continues to show characteristics of distribution and growing illiquidity. The distribution shows up as periodic bursts of high-volume selling, followed by low volume advances as those modest pools of sellers back off and short-covering squeezes prices higher. As we’ve seen across history, the problem with overvalued, overbought, overbullish markets with thinning liquidity and increasing risk aversion is that once a meaningful segment of speculators tries to sell, they find that there’s no natural demand at nearby prices, since value-conscious investors have no inclination to accumulate overvalued equities except at far lower prices that remove that overvaluation. Market crashes always reflect two features: extremely thin risk premiums in an environment where investors have shifted toward greater risk-aversion, and lopsided selling into an illiquid market. Under present conditions, we observe the precursors for both. That doesn’t force or ensure a crash, but it creates the underlying fragility that allows one. Even at presently wicked overvaluation, a favorable shift in market internals and credit spreads could move us to a fairly neutral or marginally constructive market outlook, and at least defer the immediacy of our concerns about vertical market losses. More flexibility for a constructive outlook would result from even a modest clearing of overvalued, overbought, overbullish conditions, coupled with improved market internals. A material retreat in valuations, followed by a favorable shift in market internals, would provide scope for a clearly constructive or even aggressive market outlook, as we adopted after the 1990 bear market, the 2000-2002 bear market, and even after the late-2008 market plunge (though that shift was truncated by my 2009 insistence on stress-testing our methods against Depression era data). Those improved conditions are worth waiting for, just as extreme risks presently warrant heightened defenses. The Nasdaq breaks even Last week, the Nasdaq Composite finally clawed its way to breakeven, 15 years after its spectacular bubble peak in 2000. It’s a testament to the overvaluation of technology stocks in 2000 that it has required the third equity bubble in 15 years to reclaim that 2000 high, at least briefly. As you may remember, the Nasdaq Composite reached its intra-day high of 5132.52 in March 2000, plunging to 795.25 (down -78%) by October 2002. The Nasdaq 100, representing the most glamourous of the group, peaked at 4816.25 in March 2000, plunging to 795.25 (down 83%) by October 2002. Even a decade later, in 2010, both indices were still 60-65% below their 2000 highs. The 2000-2002 decline also took the S&P 500 down by half, wiping out the entire total return of the S&P 500 – in excess of Treasury bill returns – all the way back to May 1996. It’s instructive to look back on the comments that we published in 2000 as the bubble, in hindsight, was about to burst: “The issue is no longer whether the current market resembles those preceding the 1929, 1969-70, 1973-74, and 1987 crashes. The issue is only – are conditions more like October of 1929, or more like April? Like October of 1987, or more like July? If the latter, then over the short term, arrogant imprudence will continue to be mistaken for enlightened genius, while studied restraint will be mistaken for stubborn foolishness. We can’t rule out further gains, but those gains will turn bitter... Let’s not be shy: regardless of short-term action, we ultimately expect the S&P 500 to fall by more than half, and the Nasdaq by two-thirds. Don’t scoff without reviewing history first.” - Hussman Econometrics, February 9, 2000 “Investors have turned the market into a carnival, where everybody ‘knows’ that the new rides are the good rides, and the old rides just don’t work. Where the carnival barkers seem to hand out free money for just showing up. Unfortunately, this business is not that kind – it has always been true that in every pyramid, in every easy-money sure-thing, the first ones to get out are the only ones to get out... One of the things that you may have noticed is that our downside targets for the market don’t simply slide up in parallel with the market. Most analysts have an ingrained ‘15% correction’ mentality, such that no matter how high prices advance, the probable maximum downside risk is just 15% or so (and that would be considered bad). Factually speaking, however, that’s not the way it works... The inconvenient fact is that valuation ultimately matters. That has led to the rather peculiar risk projections that have appeared in this letter in recent months. Trend uniformity helps to postpone that reality, but in the end, there it is... Over time, price/revenue ratios come back into line. Currently, that would require an 83% plunge in tech stocks (recall the 1969-70 tech massacre). The plunge may be muted to about 65% given several years of revenue growth. If you understand values and market history, you know we’re not joking.” - Hussman Econometrics, March 7, 2000 As it happened, the SPX dropped by half, and the tech-heavy NDX dropped by 83%. If one was attentive to valuations, the spectacular losses from the 2000 peak were actually right on target. And though the reasons to believe that “this time is different” are not the same as in 2000, the same lessons – and similar risks – are relevant to investors today. Where is “fair value” today? We have to be careful here because the concept of “fair” depends on your assumptions about what a reasonable investment return should be. If I show you a security that’s expected to pay out $100 ten years from today, and I tell you that the current price is $82, you can quickly calculate that the expected return on that security is 2% annually – and you don’t need to know anything about interest rates to do that arithmetic. Interest rates come in after you do that arithmetic. Interest rates then matter only because they give you something to compare with that 2%. Now, if you decide that a 2% annual return over the coming decade is just fine with you, in view of competing alternatives, then it’s fine to call that security “fairly valued.” But even if you decide that the security is fairly valued, you should still expect a 2% annual return over the coming decade. If you viewed a 10-year return of 8% as reasonable, you’d peg “fair value” at $46.32. On the basis of valuation measures best correlated with actual subsequent market returns, we can say with a strong degree of confidence that the S&P 500 would presently have to drop to the 940 level in order for investors to expect a historically normal 10-year total return of 10% annually. That 940 figure for the S&P 500 would not represent some extreme, catastrophic outcome. It’s not a level that would even represent undervaluation from a historical perspective. It’s the level that we would associate with average, historically run-of-the-mill long-term equity returns. As we observed at the 2000 peak, “if you understand values and market history, you know we’re not joking.” That said, if one believes that depressed interest rates warrant not only a low prospective return on stocks, but also virtually no risk premium whatsoever despite their significant full-cycle volatility, then you might be quite happy with the prospect of a 1.4% annual nominal total return on the S&P 500 over the coming decade, which is what we presently estimate from current levels, based on a variety of historically reliable methods (see Ockham’s Razor and the Market Cycle for the arithmetic behind these estimates). In that case, you might consider stocks to be "fairly valued" here. But you should still allow for a 940 level or below on the S&P 500 over the completion of this market cycle. One might think that low interest rates would preclude the possibility of the market losing more than half of its value, but historically, one would be wrong. Outside of the inflation-disinflation cycle from the mid-1960’s to the mid-1990’s, the historical correlation between 10-year Treasury yields and 10-year prospective stock returns has been far weaker than investors seem to believe. Indeed, except for the 2000-2002 cycle, the final low that completes a market cycle has historically taken the market well below run-of-the-mill valuation norms, even in periods prior to the mid-1960’s when interest rates were similarly low and much more stable. One might think that Fed easing would preclude that possibility, until you realize that the Fed was easing aggressively and continuously throughout the 2000-2002 and 2007-2009 collapses. You’ll recall we also made similarly “preposterous” comments in April 2007 (see Fair Value – 40% Off). Though our measures of market internals would finally turn negative in late-July of that year (see Market Internals Go Negative), the S&P 500 was already within 10% of its pre-collapse high. At the time, we estimated that reasonable valuations were already “about 40% below current levels,” adding: “Again, that doesn't imply that stocks have to actually suffer a decline of that magnitude. Nor do we need such a decline in order to justify an unhedged investment stance. It's just that investors should not expect the S&P 500 to reliably deliver long-term returns of 10% annually or better until it does. You'll note that there are also points in history when the S&P 500 traded substantially below that 10% valuation line. Those were points where stocks were priced to deliver long-term returns reliably above 10% annually, and in fact, they did exactly that.” By late-October 2008, the S&P 500 had indeed declined by well over 40% from its peak, at which point we observed that stocks were no longer overvalued (see Why Warren Buffett is Right and Why Nobody Cares). Again, except for the 2000-2002 cycle, we've always seen market cycles reach or exceed a 10% prospective return at their lows, even when interest rates have been similar to current levels. The fact is that our valuation methods haven’t missed a beat. It was my insistence on stress-testing against Depression-era outcomes (which inadvertently de-emphasized the bubble-tolerant impact of factors related to market internals) that led to our stumble in the half-cycle since 2009. I’ve been very open about that stumble, and how we’ve addressed it. It’s an error to imagine that our valuation methods had anything to do with it. A drop to 940 on the S&P 500 or below would be nothing but a run-of-the-mill completion to the current market cycle. Don't confuse valuation with shorter-term trends. For example, a 10-year bond pricing formula will inform you of the exact return you can expect from now until maturity, but even though that estimate will be perfectly correlated with subsequent returns (assuming no default), it doesn't tell you whether prices, or prospective returns, will move higher or lower over the shorter-term. Regardless, you still know the exact return you can expect over the long-term. The same is essentially true for stocks over expected return horizons of about 8 years or more. During our awkward stress-testing transition from our pre-2009 methods to our present methods of estimating market return/risk profiles, I was clearly incorrect that 10-year prospective returns could not get even worse in the shorter-run. They have. But those dismal long-term returns are still baked in the cake and are still likely to emerge as expected over the coming decade. Among the lessons to be learned from the collapses that followed the 2000 and 2007 peaks (among others) is that one should not conclude that historically reliable, long-term valuation methods are inaccurate simply because a bubble has not yet burst. Keep in mind that these estimates already embed expected nominal growth in GDP and corporate revenues of about 6% annually over the coming decade. Though Lakshman Achuthan of ECRI notes, correctly in my view, that trend growth in nominal GDP is likely to slow to closer to half that rate (reflecting 0.5% trend productivity growth, 0.5% trend labor force growth, and 2% inflation), we’re not inclined to make an already dismal projection worse by embedding a slower growth rate. While an improvement in market internals – if it emerges – might defer our concerns somewhat, dismal long-term market returns are already baked in the cake. Understanding this now will be the key to avoiding very steep losses over the completion of the current cycle. We can hardly overstate these extremes, which we discussed in last week’s comment (see Profit Margins: Is the Ladder Starting to Snap?): “On the valuation front, we should begin by emphasizing that the most historically reliable valuation measures – those most closely related to actual subsequent market returns over full-cycle horizons of about 7 years or more – are those that adjust for the cyclical variation of profit margins (see Margins, Multiples and the Iron Law of Valuation). Indeed, on a 10-year horizon, these measures are generally about 90% correlated with actual subsequent total returns in the S&P 500, and this relationship has persisted even in recent market cycles. Though it’s not widely recognized, measures such as the ratio of market capitalization/nominal GDP and the S&P 500 price/revenue ratio are actually better correlated with actual subsequent total market returns than price/operating earnings ratios, the Fed model, and even the raw Shiller P/E (though the Shiller P/E does quite well once one adjusts for the embedded profit margin). To fully understand the present valuation extreme, recognize that the market cap/GDP ratio is currently about 1.29 versus a pre-bubble norm of just 0.55, with “secular” lows such as 1982 taking the ratio to about 0.33. To fully understand the present valuation extreme, recognize that the S&P 500 price/revenue ratio is currently about 1.80, versus a pre-bubble norm of just 0.8, with “secular” lows taking the ratio to about 0.45.” Ad Hominem The knee-jerk reaction to our valuation concerns is to substitute any consideration of historical evidence itself with a criticism of me, personally. Although this strategy overlooks some remarkably useful lessons that can be drawn from our experience in the recent half cycle, it won’t bother me if that’s what one needs to relieve the cognitive dissonance created by inconvenient historical evidence. As in 2000-2002 and 2007-2009, every share of stock outstanding will have to be held by someone during the downward completion of this cycle. Many speculators have volunteered to take one for the team (with margin debt hitting a record high last month, they’re in crowded company), and I understand why they don’t want to hear about downside risk. As for making things personal, criticizing others has no bite when they’ve already admitted their stumbles, and especially when they’ve addressed them. So, as usual, I’ll follow the above with a full recognition of the points where I’ve been most incorrect (at least a while) in the past three decades. None of this is new to those who follow our work, but that kind of balance is always appropriate, and it may help to avoid the mistake of shrugging off current extremes. While I was a raging, leveraged bull after the 1990 bear market, encouraged a constructive stance in early 2003 after the 2000-2002 plunge, and even shifted to a constructive stance in late-2008 after the market plunged more than 40%, the fact is that I was unprepared as a value investor for the late-1990’s bubble, and had to develop new bubble-tolerant tools to deal with it. We did so by developing measures of market internals that convey information about investor preferences toward risk. My 2009 insistence on stress-testing our methods against Depression era outcomes (what I called our “two data sets” problem in 2009) inadvertently exposed us to the same problem a second time, because the resulting methods of classifying market return/risk profiles incorporated – but didn’t sufficiently capture – the bubble-tolerant features of our pre-2009 methods. We ultimately imposed them explicitly as an overlay in mid-2014 (see A Better Lesson Than "This Time Is Different" ). As for other investors, the worst mistake they made prior to the 2000-2002 collapse was to believe Wall Street’s claims that stocks were not in a bubble, and that this time was different. The worst mistake that other investors made prior to the 2007-2009 collapse was to believe Wall Street’s claims that stocks were not in a bubble, and that this time was different. The worst mistake that other investors are making today is to believe Wall Street’s claims that stocks are not in a bubble, and that this time is different. In March 2000, I wrote “When people watch the Nasdaq, there is real pressure to chase performance. It can really seem like defensiveness is an enemy, and speculation is a friend. And again, the same was true in the late 1960’s, when George McBundy of the Ford Foundation directed the managers of university endowments to become more aggressive: ‘We have the preliminary impression that over the long run, caution has cost our colleges and universities much more than imprudence or excessive risk-taking.’ In the plunge that followed, that preliminary impression turned out to be horribly incorrect.” As it turned out, the S&P 500 Index fell to a lower level in August 1982 than in May 1969, and while dividends contributed to a modestly positive nominal total return, the real return on stocks after inflation averaged -3.4% annually during that period. Last month, Stan Druckenmiller recounted his own experience with capitulation and performance chasing when he was the lead portfolio manager for George Soros and the Quantum Fund: “I’ll never forget it. January of 2000 I go into Soros’ office and I say I’m selling all the tech stocks, selling everything. This is crazy... Just kind of as I explained earlier, we’re going to step aside, wait for the next fat pitch. I didn’t fire the two gun slingers. They didn’t have enough money to really hurt the fund, but they started making 3 percent a day, and I’m out. It’s driving me nuts. I mean, their little account is like up 50% on the year. I think Quantum was up seven. It’s just sitting there. “So like around March I could feel it coming. I just – I had to play. I couldn’t help myself. And three times during the same week I pick up a – don’t do it. Don’t do it. Anyway, I pick up the phone finally. I think I missed the top by an hour. I bought $6 billion worth of tech stocks, and in six weeks I had left Soros and I had lost $3 billion in that one play. You ask me what I learned. I didn’t learn anything. I already knew I wasn’t supposed to do that. I was just an emotional basket case and couldn’t help myself. So maybe I learned not to do it again, but I already knew that.”The foregoing comments represent the general investment analysis and economic views of the Advisor, and are provided solely for the purpose of information, instruction and discourse. Please see periodic remarks on the Fund Notes and Commentary page for discussion relating specifically to the Hussman Funds and the investment positions of the Funds. --- The foregoing comments represent the general investment analysis and economic views of the Advisor, and are provided solely for the purpose of information, instruction and discourse. Prospectuses for the Hussman Strategic Growth Fund, the Hussman Strategic Total Return Fund, the Hussman Strategic International Fund, and the Hussman Strategic Dividend Value Fund, as well as Fund reports and other information, are available by clicking "The Funds" menu button from any page of this website. |
|||||||||||||||||||||||||
|
For more information about investing in the Hussman Funds, please call us at
1-800-HUSSMAN (1-800-487-7626) 513-326-3551 outside the United States Site and site contents © copyright Hussman Funds. Brief quotations including attribution and a direct link to this site (www.hussmanfunds.com) are authorized. All other rights reserved and actively enforced. Extensive or unattributed reproduction of text or research findings are violations of copyright law. Site design by 1WebsiteDesigners. |

