
|
|
||||||
|
|

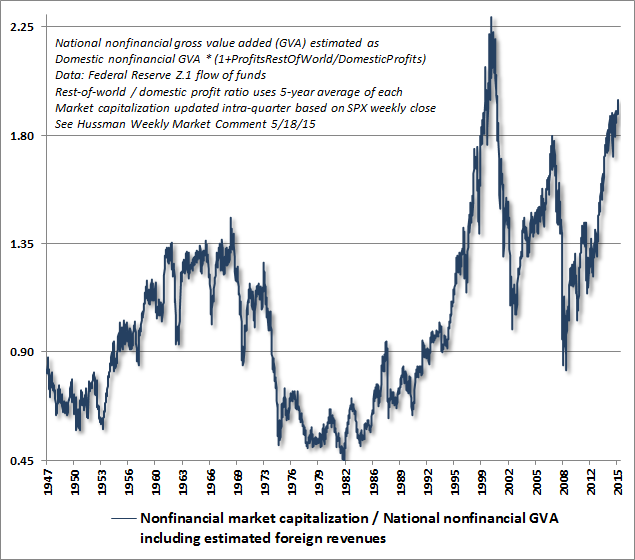
June 15, 2015 When You Look Back On This Moment In History There are moments in time when durable history is made; history that others observe much later, shaking their heads, at a loss to understand how the events that followed could not have been obvious at the time. When you look back on this moment in history, remember these things. When you look back on this moment in history, remember that spectacular extremes in reliable valuation measures already told you how the story would end. Among the measures best correlated with actual subsequent S&P 500 total returns, capitalization-weighted market indices such as the S&P 500 were more richly valued in only 54 weeks of history, 21 of which represented the final advance to the 2000 market peak, with the remaining 33 representing the retreat from that high to present valuation levels, on the way to a 50% loss in the S&P 500 Index and an 83% loss in the Nasdaq 100 Index. Presently, the market has already lost the momentum and favorable market internals that were evident during that final run, so we doubt that the 2000 extreme should be viewed as an objective. The chart below shows the ratio of market capitalization to national nonfinancial corporate gross value added (which includes estimated foreign revenue of U.S. companies). MarketCap/GVA is better correlated with actual subsequent S&P 500 total returns than price/forward earnings, the Fed Model, the Shiller P/E, price/book, price/dividend, Tobin’s Q, market capitalization to GDP, price/revenue and every other valuation ratio we’ve developed or examined in market cycles across history.
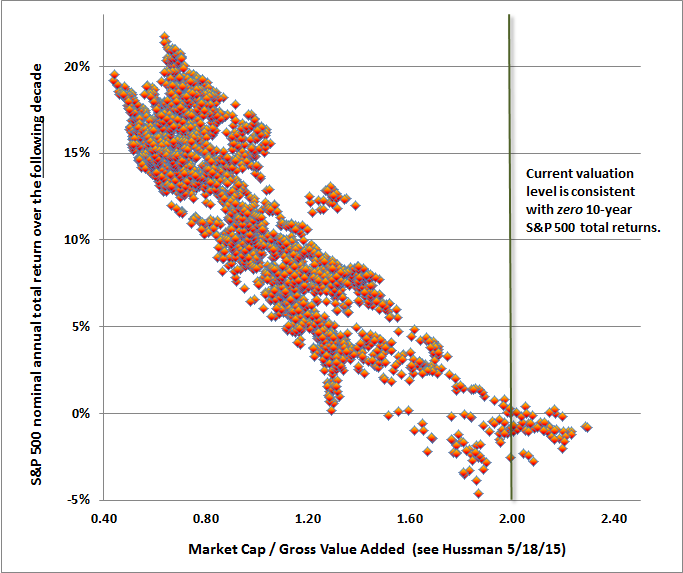
When you look back on this moment in history, remember that the valuation of the median stock was never higher. Ever. Even at the 2000 peak. As we’ve noted previously, MarketCap/GVA has a correlation of about 92% with actual subsequent 10-year S&P 500 total returns, even in recent market cycles. Look carefully at the chart above, and notice that secular valuation lows such as 1950 and 1982 occurred at valuation levels just one quarter of current levels. Forget, for a moment, about the next 5 years, 10 years, or even 15 years. Suppose that the market was to experience a secular low no sooner than 20 years from today. What would the total return of the S&P 500 be in the interim? Well, we know that earnings, revenues, and nominal GDP have historically proceeded at a peak-to-peak growth rate of 6% annually across economic cycles. That growth rate has been gradually slowing in recent decades, and there are strong reasons beyond inflation – rooted in labor force growth and real productivity growth – to be more conservative. But suppose, as optimists, we assume the same 6% nominal growth rate in the future. In that case, the percentage change in the S&P 500 over the 20 year period to that secular low would be (1.06)*(1/4)^(1/20)-1 = a loss of -1.1% annually. Fortunately, one would expect dividend yields to contribute enough to bring the total return of the S&P 500 just above zero. You can understand market returns over every span of history using the same basic arithmetic. In the 33 years since the 1982 low, valuations have quadrupled, and the S&P 500 has enjoyed an average price increase of 9.5% annually, even though nonfinancial gross value added has increased by only 5% annually. Do the math: (1.05)*(4/1)^(1/33)-1 = 9.5%. Kick in the average 2.8% dividend yield since 1982, and you arrive at the 33-year total return since 1982 of 12.3% annually. Understand how much of that long-term return is owed to depressed starting valuations. When you look back on this moment in history, remember that S&P 500 returns had never materially exceeded zero over the decade following similar valuations. The following chart presents a historical scatter plot of MarketCap/GVA versus actual subsequent 10-year returns for the S&P 500. The present level is associated with zero subsequent 10-year returns – with no alternate outcomes. Just a cluster of returns at zero or below, and nothing but blue sky above.
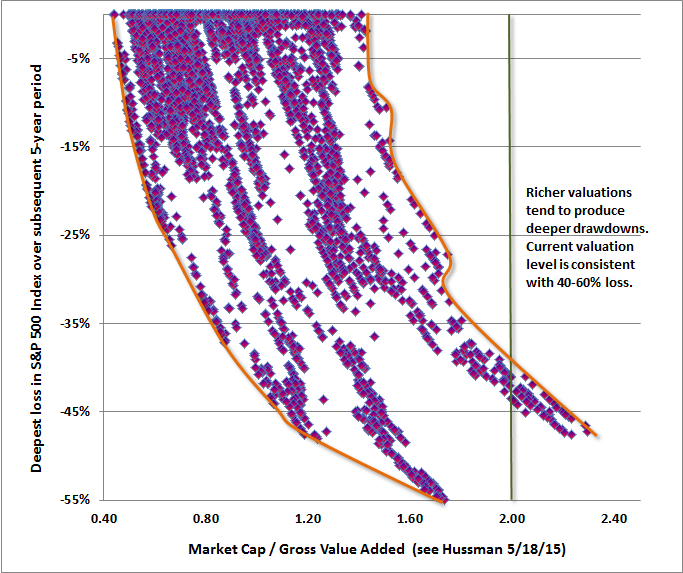
In a nutshell, the normal run-of-the-mill expectation for S&P 500 total returns from present valuations is zero over the coming 10 years, but in the event of a secular low in the future, total returns from current valuations may turn out to be about zero for the coming 20 years. Future generations will likely recognize the current precipice, in hindsight, as The Last Gasp of the Bubble Era. I have little doubt that we will likely observe strong or outstanding investment opportunities even over the completion of the current cycle, because severe market losses can dramatically change this arithmetic. Presently, however, the prospects for long-term investors remain dismal. Even the 4% annual total return of the S&P 500 in the 15 years since the 2000 peak has been made possible only by driving current valuations to the second most extreme point in U.S. history. When you look back on this moment in history, remember that rich valuations had not only been associated with low subsequent market returns, but also with magnified risk of deep interim price losses over shorter horizons. The chart below plots valuations at each point in history against the deepest loss in the S&P 500 during the following five-year period. While there is more dispersion in outcomes, from the standpoint of deepest losses, the pattern should still be clear. The boundaries are shown by the orange lines. Current valuations are consistent with a market loss in the coming 5-year period between 40-60%. Nothing but blue sky above that range.
Remember that while more volatile asset classes are often priced in a way that provides higher average long-term returns to investors as compensation, that general relationship is based on very, very long-term averages. Over the course of the market cycle, the relationship between prospective return and risk of loss is actually inverted, as demonstrated above. Rich valuations are associated not only with weak future return prospects, but with unusually deep prospective losses in the interim. Depressed valuations are associated not only with strong prospective return prospects, but much shallower prospective losses in the interim. Equities are a terrible bargain here from the standpoint of probable return and risk. When you look back on this moment in history, remember that dismal return/risk prospects were grounded in objective historical evidence, not simply opinion. Of course, a handful of observers are so self-satisfied with pointing out the challenges since 2009 that I’ve regularly admitted and already addressed that they confuse the message with the messenger; ignoring objective evidence as a consequence. This unfortunately dismisses the central lesson to be drawn from the awkward transition that resulted from my 2009 decision to stress-test our methods against Depression-era data, not to mention the fact that concerns similar to my present ones were rather stunningly vindicated over the completion of prior market cycles. Remember that the 2000-2002 market loss wiped out the entire total return of the S&P 500 – in excess of Treasury bill returns – all the way back to May 1996. Remember that the 2007-2009 market loss wiped out the entire total return of the S&P 500 – in excess of Treasury bill returns – all the way back to June 1995. As I’ve frequently noted since mid-2014, there’s one lesson that I inadvertently had to learn twice in my career. That lesson is emphatically not that valuations are irrelevant, but rather that the shorter-term outcome of extreme valuations depends on the prevailing risk-preferences of investors, which can be inferred from the behavior of market internals. Fortunately, I learned that lesson before the crash. The following section of Hussman Investment Research and Insight from October 3, 2000 captures this idea. I inadvertently had to learn that lesson a second time in the half cycle since 2009. After the 2008 collapse that we had anticipated, the behavior of the markets and the economy became “out of sample” from the standpoint of post-war data, and I insisted on stress-testing our methods against Depression-era data. The resulting methods picked up a key regularity in market cycles across history: the emergence of extreme syndromes of overvalued, overbought, overbullish conditions were regularly accompanied or closely followed by deterioration in market internals. As a result, those methods encouraged a defensive response immediately when those syndromes emerged. Unfortunately, if quantitative easing made anything “different” in the recent cycle, it was to disrupt that regularity by encouraging persistent yield-seeking speculation regardless of those extremes. Yet even since 2009, the market has lost net ground following points where market internals have actually deteriorated. The primary lesson from our stress-testing stumble is that the emergence of an extreme “overvalued, overbought, overbullish” syndrome alone is not sufficient to warrant a hard-defensive outlook in the face of quantitative easing. In mid-2014, we imposed the requirement that a hard-defensive outlook requires a negative shift in market internals or credit spreads (see A Better Lesson Than “This Time is Different”). We could have avoided a lot of difficulty without that issue, but even without considering market internals, history teaches that the longer value-conscious investors are wrong, the more seriously their views should be taken (remember Roger Babson). Worse, to ignore obscene valuations, when market internals have now deteriorated clearly, is to knowingly invite the risk of severe market losses. When you look back on this moment in history, remember that extreme valuations had already been joined by deterioration in market internals and credit spreads. The only true function of quantitative easing has been to manipulate the risk-preferences of investors, but even that link is not reliable. Risk preferences are rooted in what investors think, and feel, and perceive. Risk preferences aren’t measured by what the Fed does, but by what investors do. When investors are risk-seeking, they tend to be risk seeking toward everything, so we have to evaluate those preferences directly on the basis of the uniformity of market internals and credit spreads. If those factors were positive here, our concerns about immediate downside risks would be less pointed, regardless of current valuation extremes. At present, a hard defensive outlook is appropriate. When you look back on this moment in history, remember that the strongest historical prerequisites for a market crash were already in place. With the spike in bond yields and breakdowns in corporate credit, yield pressures have turned higher. The following segment is again from my October 3, 2000 commentary.
When you look back on this moment in history, remember that many investors ruled out the possibility of major losses over the completion of the current market cycle because they presumed relationships that could not be established in the data, and assumed the absence of any material economic or financial shock in the coming years. Many investors seem to believe that the cyclical factors that have brought valuations to the current precipice will maintain valuations at a permanently high plateau, or even allow them to advance indefinitely. If market internals and credit spreads were favorable, we would agree that speculative pressures might sustain these extremes further over the short-run. But to believe that valuations will sustain a permanently high plateau at these extremes is madness, and given the present deterioration in market internals, even the short-run bets are off. As for popular beliefs – what I call “investing by aphorism” – if one examines the historical evidence, one will discover that “Don’t fight the Fed” is quite a poor investment guide. The fact is that some of the worst market losses in history were accompanied by persistent and aggressive Federal Reserve easing, including the entire 2000-2002 and 2007-2009 collapses. In contrast, “The trend is your friend” is quite useful in reducing the depth of bear market losses, but most popular variants underperform the market over time. In order for trend-sensitive measures to have teeth, they have to be broad enough to convey information about uniformity and dispersion across numerous securities and asset classes, and thereby provide a signal about investor risk-preferences. The historical evidence strongly supports the observation that overvaluation becomes a violent risk once it is joined by deterioration in market internals, and undervaluation becomes most rewarding once it is joined by early improvement in market internals. When you look back on this moment in history, remember that the popular “Fed Model” was a statistical artifact, not a “fair value” relationship. The fact is that the correlation between the 10-year Treasury yield and equity yields was only positive during the inflation-disinflation cycle from the mid-1960's to the mid-1990's. The belief that the correlation between Treasury yields and equity yields is one-for-one is an artifact of the specific period of disinflation between 1980 and 1997 (see Recognizing the Risks to Financial Stability), during which time equity valuations moved from extreme secular undervaluation to severe secular overvaluation. The apparent one-to-one relationship between Treasury yields and equity yields during that span (which is the entire basis for the “Fed Model”) is anything but a “fair value” relationship between stocks and bonds. When you look back on this moment in history, remember that many investors implicitly believed that depressed interest rates and high valuations were good for future stock market returns. To the extent that lower Treasury yields are even weakly associated with higher equity valuations, recognize that this effect is also expressed over time as lower subsequent stock market returns. There seems to be a belief that low Treasury yields in recent years have somehow made stocks a better investment. What’s actually true is that yield-seeking speculation in response to quantitative easing and zero-interest rate policies has elevated current valuations, giving investors returns (at least on paper) that they would have waited many more years to accrue. The problem is that with valuations now at obscene heights, future returns are likely to be dismal, and future downside risks are likely to be extreme. There is strong reason to expect the S&P 500 to underperform the 2.4% total return available on Treasury debt over the coming decade, though both asset classes are so richly valued that substantial volatility and interim losses should be expected in both. What makes me shake my head is that we’ve seen this before. If one has the wisdom to question their beliefs by actually testing them against data, thinking carefully about valuations, and studying the course of market cycles across history, none of these points should be surprising. But instead, they seem to be taken as heresy. When you look back on this moment in history, understand that all of this evidence was freely available. I’ve admitted my own stumbles, addressed our own challenges, and have created an open book of data and analysis to support very deep concerns about the risks that investors face over the completion of the current market cycle. As always, the message is not “sell everything.” The message is to encourage investors to think carefully about their risk tolerance, their true investment horizon, the extent to which they experience distress if an overvalued market advances without them, the extent to which they believe that historical evidence should inform investment decisions, and the extent to which they would be able to adhere to their investment discipline in the face of what could very well be a 50% market loss over the completion of this cycle. Investors can have legitimate differences across all of these dimensions, but think carefully about each of them. When you look back on this moment in history, it will be helpful – regardless of the market outcome – to remember that you did so. The foregoing comments represent the general investment analysis and economic views of the Advisor, and are provided solely for the purpose of information, instruction and discourse. Please see periodic remarks on the Fund Notes and Commentary page for discussion relating specifically to the Hussman Funds and the investment positions of the Funds. --- The foregoing comments represent the general investment analysis and economic views of the Advisor, and are provided solely for the purpose of information, instruction and discourse. Prospectuses for the Hussman Strategic Growth Fund, the Hussman Strategic Total Return Fund, the Hussman Strategic International Fund, and the Hussman Strategic Dividend Value Fund, as well as Fund reports and other information, are available by clicking "The Funds" menu button from any page of this website. |
|||||||||||||||||||||||||
|
For more information about investing in the Hussman Funds, please call us at
1-800-HUSSMAN (1-800-487-7626) 513-326-3551 outside the United States Site and site contents © copyright Hussman Funds. Brief quotations including attribution and a direct link to this site (www.hussmanfunds.com) are authorized. All other rights reserved and actively enforced. Extensive or unattributed reproduction of text or research findings are violations of copyright law. Site design by 1WebsiteDesigners. |

