|
|
||||||
|
|

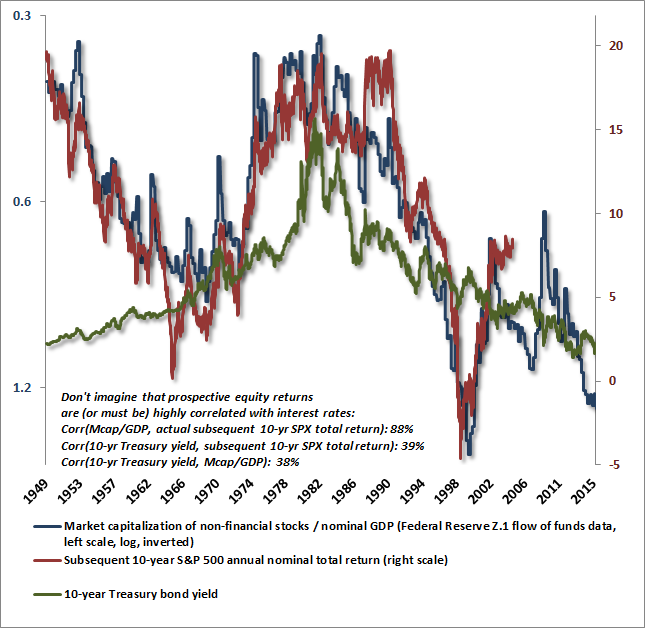
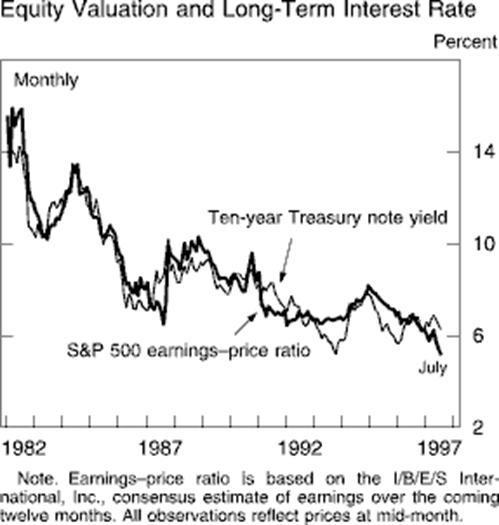
May 11, 2015 Recognizing the Risks to Financial Stability “It was the greatest and boldest operation ever undertaken by the Federal Reserve System, and, in my judgment, resulted in one of the most costly errors committed by it or any banking system in the last 75 years. I am inclined to think that a different policy at that time would have left us with a different condition at this time... Business could not use and was not asking for increased money at that time.” Adolph Miller, former Federal Reserve Board Member, testifying to the U.S. Senate in 1931 about the Federal Reserve’s 1927 interest rate cuts and acceleration of open market purchases – which fueled speculation and low-quality credit expansion that culminated in the 1929 peak, collapse, and ultimately the Great Depression. "Credit expansion cannot increase the supply of real goods. It merely brings about a rearrangement. It diverts capital investment away from the course prescribed by the state of economic wealth and market conditions. It causes production to pursue paths which it would not follow unless the economy were to acquire an increase in material goods. As a result, the upswing lacks a solid base. It is not a real prosperity. It is illusory prosperity. It did not develop from an increase in economic wealth [i.e. the accumulation of savings made available for productive investment]. Rather, it arose because the credit expansion created the illusion of such an increase. Sooner or later, it must become apparent that this economic situation is built on sand." Ludwig von Mises, The Causes of Economic Crisis (1931) Plus ça change, plus c'est la même chose. The more it changes, the more it’s the same thing. One would think that the lessons from policy mistakes that led to the Great Depression and the Global Financial Crisis would have been remembered more vividly, but we can take solace that at least on the surface, it appears that those lessons are at least beginning to be remembered. On Wednesday, Federal Reserve Chair Janet Yellen began to openly recognize the risks to financial stability that have emerged after years of aggressive monetary experimentation by the Federal Reserve: “we’ve also seen a compression in spreads on high-yield debt, which certainly looks like a reach-for-yield type of behavior. I would highlight that equity market valuations at this point generally are quite high. Now, they’re not so high when you compare the returns on equities to the returns on safe assets like bonds, which are also very low, but there are potential dangers there.” We believe that Chair Yellen’s thinking is evolving very much in the right direction. That said, it’s not at all clear that the FOMC more generally has shifted from the theoretical view that there is a Phillips Curve between unemployment and inflation that can be manipulated by the Fed, nor the view that the Fed can exploit a meaningful “wealth effect” from financial assets to the real economy. The empirical evidence on both counts is weak or absent. Indeed, the proper interpretation of the Phillips Curve is one that relates the rate of unemployment to the rate of real wage inflation, not general price inflation (see Will the Real Phillips Curve Please Stand Up? and the chart from Richard Fisher in Eating our Seed Corn). On the "wealth effect," economists have known since Friedman and Modigliani’s work in the 1950’s that consumers don’t respond materially to perceived income that comes in the form of capital gains on volatile assets. Moreover, our impression is that equity valuations are actually only mildly less extreme “when you compare the returns on equities to the returns on safe assets like bonds.” The reason is two-fold. First, the “returns on equities” here are typically taken to be earnings yields, which as we’ve frequently noted, are affected by cyclical variations in profit margins that make them notoriously poor indicators of long-term prospective returns (see Two Point Three Sigmas Above the Norm and Margins, Multiples and the Iron Law of Valuation). Second, if one cares to actually examine reliable measures of prospective equity returns, bond yields don’t have a tight relationship with those prospective equity returns at all – as the chart below should demonstrate. The belief that equity valuations are “not so high when you compare the returns on equities to the returns on safe assets like bonds” is a common one, but is based on overgeneralizing a very limited period of history. Specifically, the “Fed Model” – the notion that equity earnings yields and 10-year Treasury yields should move in tandem – is an artifact restricted to the period between 1980 and 1997, when both equity and bond yields fell in virtually one-for-one lock-step – bond yields because of disinflation, and equity yields because of what was actually a move from extreme secular undervaluation to extreme secular overvaluation. The Fed Model grossly misinterprets this data as if it were a fair value relationship between stock yields and bond yields. The model had its origins in the chart below, which appeared in Alan Greenspan’s July 1997 Humphrey Hawkins testimony to Congress.
Warning: The apparent one-to-one relationship between interest rates and equity yields embodied in the Fed Model is entirely the artifact of this single period in history. If one excludes the 1980-1997 period, the historical correlation between 10-year Treasury yields and 10-year prospective (and actual realized) equity returns is actually slightly negative over the past century, and is only weakly positive in post-war data. I realize that some observers will get upset about that statement, but it's just an empirical fact. The current 10-year Treasury yield says less than investors imagine about the valuation or likely 10-year returns of U.S. equities. I do believe that yields and prospective returns on stocks and bonds are likely to be correlated in strong inflation-disinflation cycles, but prospective equity returns have a far larger and more variable speculative component than investors seem to appreciate. The notion that equity valuations cannot, or will not, revisit normal run-of-the-mill prospective returns (or better) in the coming decade has utterly no support in the historical record. With the exception of the 2002 low (which still followed severe market losses), every market cycle in history has done so. Currently, the S&P 500 would have to decline by about 55% simply to price out at historically run-of-the-mill valuations on the most reliable measures. We made similarly "preposterous" but ultimately accurate statements in 2000 and 2007 about the size of the market loss that would likely complete the cycle (see Fair Value on the S&P 500 Has Three Digits). Still, suppose we believe that short-term interest rates tightly determine the valuations of longer term assets. How much effect should zero interest rate policy have on asset prices? Well, suppose that historically speaking, a run-of-the-mill Treasury bill yield is about 4% annually, run of the mill 10-year bond yields are about 6% annually, and run-of-the-mill returns on stocks are about 10% annually. Now announce that short-term interest rates will be held at zero for the next 5 years, with normal yields thereafter. At this point, leaving risk premiums alone, it would be “reasonable” for current stock and bond prices to be elevated enough to take 4% annually out of the next 5 years of returns in stocks and bonds as well. For bonds, the resulting full 10-year yield would join 5 years at 2% and 5 years at 6%, for an overall 10-year yield of 4%. For stocks, the resulting 10-year prospective return would be 5 years at 6% and 5 years at 10%, for a 10-year prospective return of about 8%. In both cases, you’ve taken 2% out of the 10-year return (which is just 5 years x 4% / 10 years) by raising both of their prices about 20% above what would otherwise be “fair value.” You can prove the same outcome to yourself with a variety of discounted cash flow methods as well. Now, we’re sympathetic to the idea that prospective real growth and inflation may be sufficiently lower in the future to place us into a low nominal growth world, which would also justify lower equilibrium interest rate levels. But as I noted last week (see Two Point Three Sigmas Above the Norm), nominal growth and interest rate variations have historically canceled out over the past century, with little effect on the accuracy of our valuation estimates – matched reductions in the growth rate and the discount rate really don’t affect fair value. We don’t believe a low growth world will be less susceptible to recession or credit strains, so we also don’t believe that equity risk premiums should be razor thin. In short, if one believes that short-term interest rates will be held at zero for the next 5 years, the appropriate premium for long-term assets – over their otherwise typical valuation norms – is about 20%. Even if one assumes that stocks should trade at such a premium to historically reliable valuation norms, the S&P 500 would still have to fall by about 45% to meet that level. We emphasize “historically reliable” because as in every bubble, there are numerous popular measures with quite poor correlation with actual subsequent market returns that Wall Street can offer to convince investors that valuations are just fine. Unfortunately, on the most historically reliable measures, equity valuations are now more than 130% above the levels that would historically be associated with run-of-the-mill 10% equity returns (the premium is about 116% above historical norms if we use a broader though still reliable set of measures). These valuations might be reasonable on the assumption that short-term interest rates will be kept at zero for more than 30 years, but our impression is that what’s actually going on is that investors feel they have “nowhere else to go” and – as in 2000 and 2007 – are speculating without a clear recognition of the dismal long-term returns that are now priced into equities. In effect, investors have priced stocks not only on the expectation of many more years of zero interest rates, but also without any material risk premium at all. As a result, the most historically reliable valuation measures now suggest that the S&P 500 will experience a net loss over the coming decade, while including broader (if slightly less reliable) measures results in projected S&P 500 10-year annual nominal total returns of about 1.4% annually (see Ockham’s Razor and the Market Cycle for the arithmetic behind these estimates). The past several years have featured little more than a gigantic asset swap, the short description being that massive volumes of government debt have been swapped by central banks for massive volumes of idle bank reserves, while massive volumes of low-yielding, covenant-lite debt have been issued into the hands of yield-seeking investors, in order to retire massive volumes of corporate equities at elevated valuations through buybacks. This has left the U.S. economy with a much more leveraged balance sheet than before the last crisis, and with much greater sensitivity to equity risk and debt default than at any point in history. In the midst of the Great Depression, Federal Reserve board member Adolph Miller looked back on the same error in the years before the 1929 peak. We should remember his words: “It was the greatest and boldest operation ever undertaken by the Federal Reserve System, and, in my judgment, resulted in one of the most costly errors committed by it or any banking system in the last 75 years. I am inclined to think that a different policy at that time would have left us with a different condition at this time... Business could not use and was not asking for increased money at that time.” With $2.8 trillion in idle reserves already in the banking system, what binding constraint is relieved by the existing size of the Fed balance sheet? Given the growing scarcity of available collateral among bond dealers, a collapse in repo liquidity, and increasing frequency of delivery failures, all of which is shorthand for a bond market that is becoming less liquid – it seems that QE has begun to create, rather than relieve, meaningful constraints. Given that short-term interest rates would be hard-pegged at zero even with a monetary base/nominal GDP ratio a fraction of the current size, it remains important for the FOMC to consider reducing or terminating the reinvestment of proceeds from maturing holdings sooner rather than later. Meanwhile, we should ask what benefit there really is in zero interest rate policy. Who, really, is the marginal borrower – the user of marginal funding – that emerges at a 0% rate who does not emerge at a fraction of 1%? Simple: speculative carry traders whose primary cost of doing business is interest itself, and those pursuing projects of such dismal productivity that anchoring the hurdle rate to anything above zero would cause the borrower to abandon the effort. Our hope is that Chair Yellen’s growing recognition of speculative risks will continue, and for the sake of the U.S. economy, that the rather baseless hope of manipulating a “Phillips Curve” or a “wealth effect” will fade. If one believes in these things, it is tempting to think that more monetary easing could be “good” for the economy. If the FOMC recognizes how weak those empirical relationships actually are, and how extreme the financial distortions have become, we might still avoid another financial crisis. We can’t express much confidence in that hope, but one can still hope. Goldilocks, catalysts, and sideways distribution Friday’s employment report was something of a mixed bag. On one hand, employment growth picked up from March (which was revised lower), but the composition of the report was striking. The economy lost 252,000 full time jobs, but gained 437,000 part time jobs. More than the entire increase was in workers 55 years of age and older. Overall, it was neither encouraging nor dismal, and as a result, the “Goldilocks” meme quickly took hold, suggesting just enough weakness to keep the Fed on hold, but not enough to endanger the economy. Again, if one actually believes that zero interest policy is helpful to the economy more than it creates harm through financial stability risks (and we certainly view the risks as dominant), it follows that the FOMC may indeed be put on hold for a while. Given Chair Yellen’s recent remarks, we question whether the Fed remains as confident in the effectiveness of QE, or remains unaware of the growing risks to financial stability. Our hope is that at minimum, the June meeting is used as an occasion to reduce the reinvestment of proceeds on maturing holdings. Unfortunately, we have no expectation that this will be the case. In February, we observed evidence of an abrupt slowing in economic activity. In the typical sequence, financial variables, retail sales, and new orders deteriorate first, followed by production, followed by personal income, followed much later by payroll employment, with the unemployment rate the last variable to shift. In recent months, we’ve observed one of the most persistent shortfalls from economic expectations in years, as measured by various “economic surprise” indices. But given that Wall Street economists tend to be the trend-following type, the tendency to overreact tends to produce well-defined cycles in those surprises. As a result, absolute economic prospects may not improve much, but we would actually expect a strong trend toward positive surprises from the standpoint of now-lowered expectations. That might get in the way of the Goldilocks theme in the coming weeks, but we don’t have strong directional expectations about the economy at present, and we don’t observe markers of recession as yet. Suffice it to characterize that outlook as “tepid with downside risks.” From an investment standpoint, market conditions remain characterized both by obscene valuations and still-negative market internals. It’s that combination that continues to suggest potentially vertical downside risks. When people think about crashes, they tend to think about an event – as if some massive, grotesque, red, scaly, fire-breathing, razor-toothed catalyst should be obvious beforehand. But we know from history that that’s not the way it works. Instead, the sequence goes like this: the conditions that create vulnerability to a crash emerge first (elevated valuations coupled with deterioration in market internals and/or widening in credit spreads), the crash emerges second, and catalysts are then identified – often just flashpoints that were consistent with speculative breakdown. Many investors think that “Lehman” caused the global financial crisis, but the mortgage crisis was already unfolding well before that. Lehman and Bear Stearns before it were only symptoms, not causes. The cause is always speculative distortion that was well-known for quite some time: elevated valuations, often accompanied by speculation and new issues of low-quality stocks representing some “new economy” theme, or yield-seeking speculation and heavy issuance of low quality debt. The main reason investors don’t believe that such speculation will end in a crash is simply that a crash hasn’t happened yet. In shorter-term market action, we see a general tendency toward distribution, for example, declines on expanding volume coupled with low-volume recoveries on mixed breadth and narrowing leadership (which was also the pattern last week). We note that prior to Friday, the Dow Jones Industrial Average had gone 40 trading sessions without setting a 20-day high or low. If we look across history for periods of extended range-bound activity in overvalued markets where: a) the DJIA had gone more than a month without setting a 20-day high or low; b) the DJIA was confined to a range of less than 6%; c) the DJIA was within 10% of a 2-year high; and d) the Shiller P/E was 18 or higher, there are only 7 clusters that fit the bill (1929, 1937, 1965, 1973, 1999-2000, 2007-2008, and today). While the full-cycle resolution was repeatedly brutal, I should note that the short-term resolution was not very informative at all, and didn’t depend on whether the initial break out of the range was higher or lower. What’s interesting about the general pattern is that range-bound action often coincides with distribution on price-volume measures. In October 2000, I mentioned similar measures of distribution, such as one that Peter Eliades called the “sign of the bear” based on range-bound market breadth. As I also observed then, neither elevated valuations, nor internals, nor distribution patterns ensure a market crash, but we don’t like the probabilities. Still, we aren’t terribly impatient about the near-term resolution of what we see as a likely topping process here. If we look historically at periods when conditions fell into the most negative return/risk profile we identify (as they are at present), we find that top formations often involve extended runs of severely negative conditions. Though market momentum is typically slowing or flat, the occasional marginal new high can give the appearance of unrelenting strength even at the top (examine the S&P 500 in September 2000 and October 2007, for example). The most severe return/risk profiles we identify have sometimes persisted for several months without a material market correction. These include periods that ended in: July 1957, just before the 57-58 bear market; August 1987; July 1998 just before the Asian crisis; March 2000 as the tech bubble was peaking (followed by a sequence corrections and recoveries before the full bear market unfolded); October 2007 just before the global financial crisis; November 2012 – the one extended period of extremely negative conditions that was not followed by a market loss as the Federal Reserve launched QE3; a 10-week run that was resolved by a nearly 10% loss – though on an intraday basis – last October; and the subsequent run to the recent high, which at six months, is just outside of prior instances in duration. The perception of a Goldilocks economy may drag that out for a bit longer here, so again, we can’t be impatient, and we’ll take our evidence as it arrives. If market internals and credit spreads improve, the immediacy of our downside concerns will ease. Regardless, we believe that the S&P 500 is likely to experience flat returns or losses over the coming decade, and we remain concerned about growing financial distortions driven by yield-seeking malinvestment, as we were in the runup to the global financial crisis.The foregoing comments represent the general investment analysis and economic views of the Advisor, and are provided solely for the purpose of information, instruction and discourse. Please see periodic remarks on the Fund Notes and Commentary page for discussion relating specifically to the Hussman Funds and the investment positions of the Funds. --- The foregoing comments represent the general investment analysis and economic views of the Advisor, and are provided solely for the purpose of information, instruction and discourse. Prospectuses for the Hussman Strategic Growth Fund, the Hussman Strategic Total Return Fund, the Hussman Strategic International Fund, and the Hussman Strategic Dividend Value Fund, as well as Fund reports and other information, are available by clicking "The Funds" menu button from any page of this website. |
|||||||||||||||||||||||||
|
For more information about investing in the Hussman Funds, please call us at
1-800-HUSSMAN (1-800-487-7626) 513-326-3551 outside the United States Site and site contents © copyright Hussman Funds. Brief quotations including attribution and a direct link to this site (www.hussmanfunds.com) are authorized. All other rights reserved and actively enforced. Extensive or unattributed reproduction of text or research findings are violations of copyright law. Site design by 1WebsiteDesigners. |