|
|
||||||
|
|

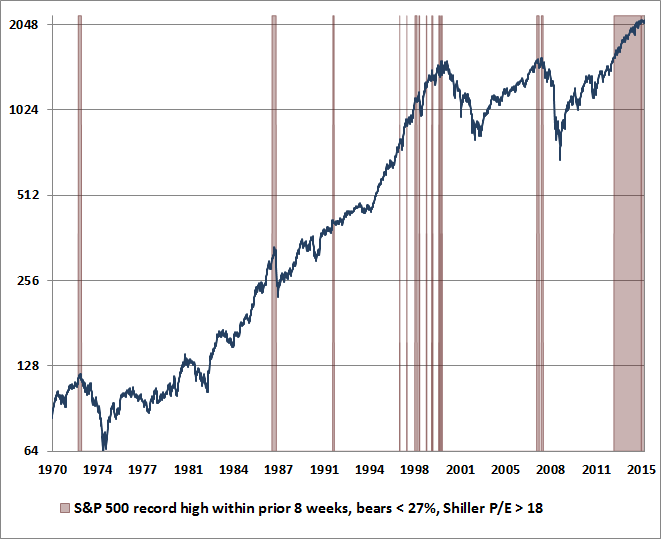
July 27, 2015 Memorize This, Earn a Dollar As a kid growing up in the 1960’s, I earned my allowance the usual way; cutting grass and raking leaves. When there was no grass to cut or other work to do, my parents – who deeply valued education – would give us things to commit to memory. I figure I squeezed more than 30 bucks out of memorizing the multiplication tables up to 12. My brothers were better at memorizing poetry, but I was pretty good at song lyrics, which put me in good position to learn the words to countless 70's songs (e.g. "This really blew my mind. The fact that me, an over-faired, long-haired, leaping gnome, should be the star of a Hollywood movie. But, there I was"). I was not paid for this. Still, I got three bucks for memorizing “If” by Rudyard Kipling. Along with “Desiderata” and Robert Frost’s “The Road Not Taken”, it’s served me well at various points in life. My brothers and I sometimes spontaneously recite the opening lines of Kipling in unison when we remember my dad: If you can keep your head when all about you If I were to choose anything that investors should memorize – that will serve them well over a lifetime of investing – it would be the following two principles: 1) Valuations control long-term returns. The higher the price you pay today for each dollar you expect to receive in the future, the lower the long-term return you should expect from your investment. Don't take current earnings at face value, because profit margins are not permanent. Historically, the most reliable indicators of market valuation are driven by revenues, not earnings. 2) Risk-seeking and risk-aversion control returns over shorter portions of the market cycle. The difference between an overvalued market that becomes more overvalued, and an overvalued market that crashes, has little to do with the level of valuation and everything to do with the attitude of investors toward risk. When investors are risk-seeking, they are rarely selective about it. Historically, the most reliable way to measure risk attitudes is by the uniformity or divergence of price movements across a wide range of securities. I've called these The Iron Law of Valuation, and The Iron Law of Speculation. I've repeated them frequently. They deserve to be repeated. They’re not Kipling, but if you remember both of those principles through the ups and downs of the market cycle, I expect that they’ll replace a great deal of grief with a great deal of success over a lifetime of investing. They also explain virtually every major success and occasional stumble I've experienced in three decades as a professional investor. I should make the point that these principles aren’t new. They capture the same principles I laid out in October 2000, at the beginning of a market collapse that would take the S&P 500 down by half and the Nasdaq 100 down by 83%. They capture the same principles that prompted me to turn constructive in April 2003 after that collapse. They capture the same principles I laid out in July 2007, just before the global financial crisis took the S&P 500 down by 55%. My stumble in the half-cycle since 2009 was all about a single issue: after the market collapse of 2007-2009, I insisted on stress-testing our methods of classifying market return/risk profiles against Depression-era data. While we had moved to a constructive outlook in late-October 2008 after the market had plunged by more than 40%, we discovered vast differences between post-war and Depression-era outcomes under similar conditions - what I called our "two data sets problem." The ensemble methods that came out of our stress-testing efforts performed better across history than any other approach we had ever tested (including against holdout validation data), but we missed a market rebound in the interim. In hindsight, the ensemble methods reconciled the two data sets by demanding stronger measures of what we call "early improvement in market action," and that is what could have moved our constructive shift to March-April 2009. The methods also captured another regularity: in previous market cycles across history, the emergence of an extreme syndrome of overvalued, overbought, overbullish conditions was usually accompanied or closely followed by a breakdown in market internals. That encouraged us to immediately take a hard-defensive outlook when those syndromes emerged. If the Federal Reserve's policy of quantitative easing made one thing “different” in the recent half-cycle, it was to reduce that overlap, by intentionally encouraging continued yield-seeking speculation regardless of overvalued, overbought, overbullish extremes. Importantly, actual breakdowns in market internals have been followed by market losses, on average, even since 2009 (as we saw in the near-20% plunge of 2011). In mid-2014, we imposed the requirement that market internals or credit spreads must actually deteriorate as a precondition to establishing a hard-defensive market outlook. That adaptation brings our present methods back in line with the central considerations that were responsible for our success prior to 2009. Sometimes, they do ring a bell Last week, Bill Hester showed me a few charts, saying, “Here’s something you’re very aware of, but I still found interesting.” The first chart shows points in history when the S&P 500 has registered a record high within the prior 8-week period, with advisory bearishness (Investors Intelligence) below 27%, and the Shiller P/E (S&P 500 divided by the 10-year average of inflation-adjusted earnings) greater than 18. While we certainly believe there are better valuation measures than the Shiller P/E (particularly MarketCap/GVA), we use it below because it is widely followed. With advisory bearishness down to 15.6% and the Shiller P/E recently pushing 27, the market is far beyond these thresholds in any event. Notice something. In prior cycles before 2009, this set of conditions alone (the crudest possible combination of overvalued, overbought, overbullish conditions) was typically followed by moderate to severe market losses. Though it doesn’t look like much on a log scale, that retreat in 1998 approached a 20% market loss, and the series of corrections approaching the 2000 peak were in the range of 8-12% each. In a few cases, the losses were modest and the conditions were quickly cleared, but in 1972, 1987, 2000 and 2007, the follow-through was quite deep. Now look at the solid block of instances in recent years. As the Dixie Chicks would say, there’s your trouble. Measuring overbought conditions by something other than a record high, that red block would extend back even further.
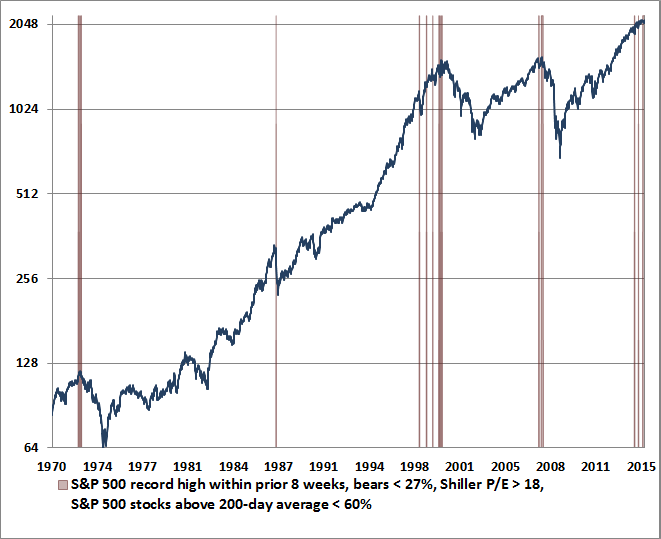
In prior market cycles across history, taking a hard-defensive outlook in response to overvalued, overbought, overbullish conditions rarely kept you on the wrong side of the market for long; either the market declined, or the syndrome was cleared. But in the face of monetary policy that has intentionally encouraged yield-seeking speculation in recent years, what’s needed in the chart above? Go back to the Iron Laws. We need to impose a measure of market internals. You may recall similar charts that I published as late as May 2014, where measures of market internals are also missing. That's the essential requirement that we imposed on our methods in mid-2014, and that ended the awkward transition from our pre-2009 methods to our present methods of classifying market return/risk profiles - avoid a hard-defensive outlook unless unfavorable conditions are confirmed by deterioration in market internals or credit spreads. When investors are risk-seeking, they tend to be risk-seeking in everything, so the uniformity of market action conveys a great deal of information about their preferences. When market internals begin to break down, it’s a signal that investor preferences have shifted toward risk-aversion. In that environment, previously benign overvaluation can quickly become disastrous, and as we saw during 2000-2002 and 2007-2009, even persistent and aggressive monetary easing doesn’t reliably support the market. The chart below imposes one additional condition, showing periods where fewer than 60% of S&P 500 stocks were above their respective 200-day moving averages. This is as clear and simple as the Iron Laws can get. The worst market outcomes in history have always emerged after an overvalued, overbought, overbullish advance has been joined by deterioration in market internals.
Let’s go one step further, and restrict these instances to weeks where the S&P 500 had just set a record weekly closing high. That restriction kicks out 1987. In that instance, the earliest warnings were from weakness in utilities and corporate bonds, but the percentage of stocks above their own 200-day averages didn't fall below 60% until the market itself was already down nearly 10% from its high; less than two weeks before the crash. Many trend-followers were caught off-guard because the warning period was so brief. If one wasn’t following a broad range of market internals, one needed to respond almost immediately to the emerging weakness in order to avoid the collapse. The remaining signals (record high on a weekly closing basis, fewer than 27% bears, Shiller P/E greater than 18, fewer than 60% of S&P 500 stocks above their 200-day average), are shown below. What’s interesting about these warnings is how closely they identified the precise market peak of each cycle. Internal divergences have to be fairly extensive for the S&P 500 to register a fresh overvalued, overbullish new high with more than 40% of its component stocks already falling – it’s evidently a rare indication of a last hurrah. The 1972 warning occurred on November 17, 1972, only 7 weeks and less than 4% from the final high before the market lost half its value. The 2000 warning occurred the week of March 24, 2000, marking the exact weekly high of that bull run. The 2007 instance spanned two consecutive weekly closing highs: October 5 and October 12. The final daily high of the S&P 500 was October 9 - right in between. The most recent warning was the week ended July 17, 2015.
Though advisory sentiment figures aren’t available prior to the mid-1960’s, imputed data suggest that additional instances likely include the two consecutive weeks of August 19, 1929 and August 26, 1929. We can infer unfavorable market internals in that instance because we know that cumulative NYSE breadth was declining for months before the 1929 high. The week of the exact market peak would also be included except that stocks closed down that week after registering a final high on September 3, 1929. Another likely instance, based on imputed sentiment data, is the week of November 10, 1961, which was immediately followed by a market swoon into June 1962. It's often said that they don't ring a bell at the top, and that's true in many cycles. But it's interesting that the same "ding" has been heard at the most extreme peaks among them. Still, we shouldn’t put too fine a point on this. The central issue is much more general: when extreme valuations and lopsided bullish sentiment are joined by deterioration in market internals, one faces an environment that couples compressed risk premiums with increasing risk aversion. Throughout history, severe market losses and crashes have nearly always been the result of an upward spike in previously compressed risk premiums. Understanding that dynamic will help to filter out the noise of talking heads on financial television. When one examines many market collapses in history, it is simply not the case that the bottom had to fall out of earnings or the economy. Yes, sometimes elevated profit margins retreated, but that’s really not what drives cyclical market gains and losses. Our own concern about elevated profit margins is not that earnings will be weak over the completion of the current cycle (though that increasingly appears likely), but that investors are using historically extreme profit margins and record earnings as if they are completely representative of decades and decades of future earnings, and are using those earnings figures as a sufficient statistic for valuation. Stocks are a claim on a very, very long term stream of future cash flows, and even wiping out a year or two of earnings entirely is hardly worth a hill of beans from the perspective of discounted cash flows. What drives the major cyclical swings in stocks isn’t variation in the long-term stream of cash flows investors are likely to receive. Cyclical swings in prices correspond to swings in the valuation, required return, and risk-premiums that investors assign to those cash flows. Put simply, valuation drives long-term returns, and investor risk-preferences drive returns over shorter portions of the market cycle. When measures of both are hard-negative, as they are now, investors should think carefully about their own risk-tolerance and their ability to sustain losses without abandoning their discipline, making sure to align their investments with the actual horizon over which they will need to spend the funds. Every share of stock that has been issued has to be held by someone at every moment in time, so there is no sense in encouraging investors – generally – to sell. What matters is that your own portfolio is carefully aligned with your own tolerance for risk and spending plans. If you follow a carefully considered buy-and-hold strategy, and you don’t believe that market returns can be anticipated regardless of valuations, market action, or other considerations, then by all means stick to your discipline. Our own approach generally aligns our investment outlook with the expected return/risk profile we identify at any given time, so our outlook is hard negative here. In any event, this is no time to be on autopilot. Look at the data, and you’ll realize that our present concerns are not hyperbole or exaggeration. We simply have not observed the market conditions we observe today except in a handful of instances in market history, and they have typically ended quite badly (see When You Look Back on This Moment in History and All Their Eggs in Janet’s Basket for a more extended discussion of current conditions). In my view, this is one of the most important moments in a generation to examine all of your risk exposures, the extent to which you believe historical evidence is informative, your tolerance for loss, your comfort or discomfort with missing out on potential rallies even in a wickedly overvalued market, and your true investment horizon. It’s perfectly fine to decide, after that consideration, to maintain a bullish outlook. Earnest people can disagree, and that’s what makes markets. But do review all of your risk exposures here. The foregoing comments represent the general investment analysis and economic views of the Advisor, and are provided solely for the purpose of information, instruction and discourse. Please see periodic remarks on the Fund Notes and Commentary page for discussion relating specifically to the Hussman Funds and the investment positions of the Funds. --- The foregoing comments represent the general investment analysis and economic views of the Advisor, and are provided solely for the purpose of information, instruction and discourse. Prospectuses for the Hussman Strategic Growth Fund, the Hussman Strategic Total Return Fund, the Hussman Strategic International Fund, and the Hussman Strategic Dividend Value Fund, as well as Fund reports and other information, are available by clicking "The Funds" menu button from any page of this website. |
|||||||||||||||||||||||||
|
For more information about investing in the Hussman Funds, please call us at
1-800-HUSSMAN (1-800-487-7626) 513-326-3551 outside the United States Site and site contents © copyright Hussman Funds. Brief quotations including attribution and a direct link to this site (www.hussmanfunds.com) are authorized. All other rights reserved and actively enforced. Extensive or unattributed reproduction of text or research findings are violations of copyright law. Site design by 1WebsiteDesigners. |