|
|
||||||
|
|

November 16, 2015 The Bubble Right In Front Of Our Faces Cutting immediately to the chase, we continue to believe that the U.S. equity market is in a late-stage top formation of the third speculative bubble in 15 years. On the basis of measures best correlated with actual subsequent S&P 500 total returns across history, equity valuations remain obscene. We fully expect a loss in the S&P 500 in the range of 40-55% over the completion of this cycle; an outcome that would be wholly run-of-the-mill given present market conditions, and would not even bring reliable measures of valuation materially below their longer-term historical norms. Following the steep but relatively contained market plunge in August, the major indices rebounded toward their May highs, but neither the broad market nor high-yield credit participated meaningfully. Only 34% of individual stocks remain above their respective 200-day averages, widening credit spreads suggest growing concerns about low-quality debt defaults, and sectoral divergences (e.g. relative weakness in shipping vs. production) confirm what we observe in leading economic data — a buildup of inventories and a shortfall in new orders and order backlogs. Employment figures lag the economy more than any other series. When investors are risk-seeking, they tend to be indiscriminate about it. If market internals were uniformly favorable, suggesting that investors remained inclined toward yield-seeking speculation, we could at least expect that continued speculation might defer immediate market losses, or possibly drive valuations to even more offensive levels. Fed easing (or the decision not to raise rates) might be bullish in that environment. But as investors should recall from Fed easing in late-2007 and early 2001, just as market collapses were beginning, Fed easing is among the most bearish possible events when it occurs in an environment of rich valuations and unfavorable market internals, as such easing is typically provoked by concern about economic deterioration. In the absence of favorable internals, we conclude not only that risk premiums in equities are razor thin, but that the continued shift toward risk-aversion among investors leaves the market vulnerable to abrupt spikes in risk premiums. This is an environment that has historically left the market open to vertical air-pockets, panics, and crashes. The bubble right in front of our faces
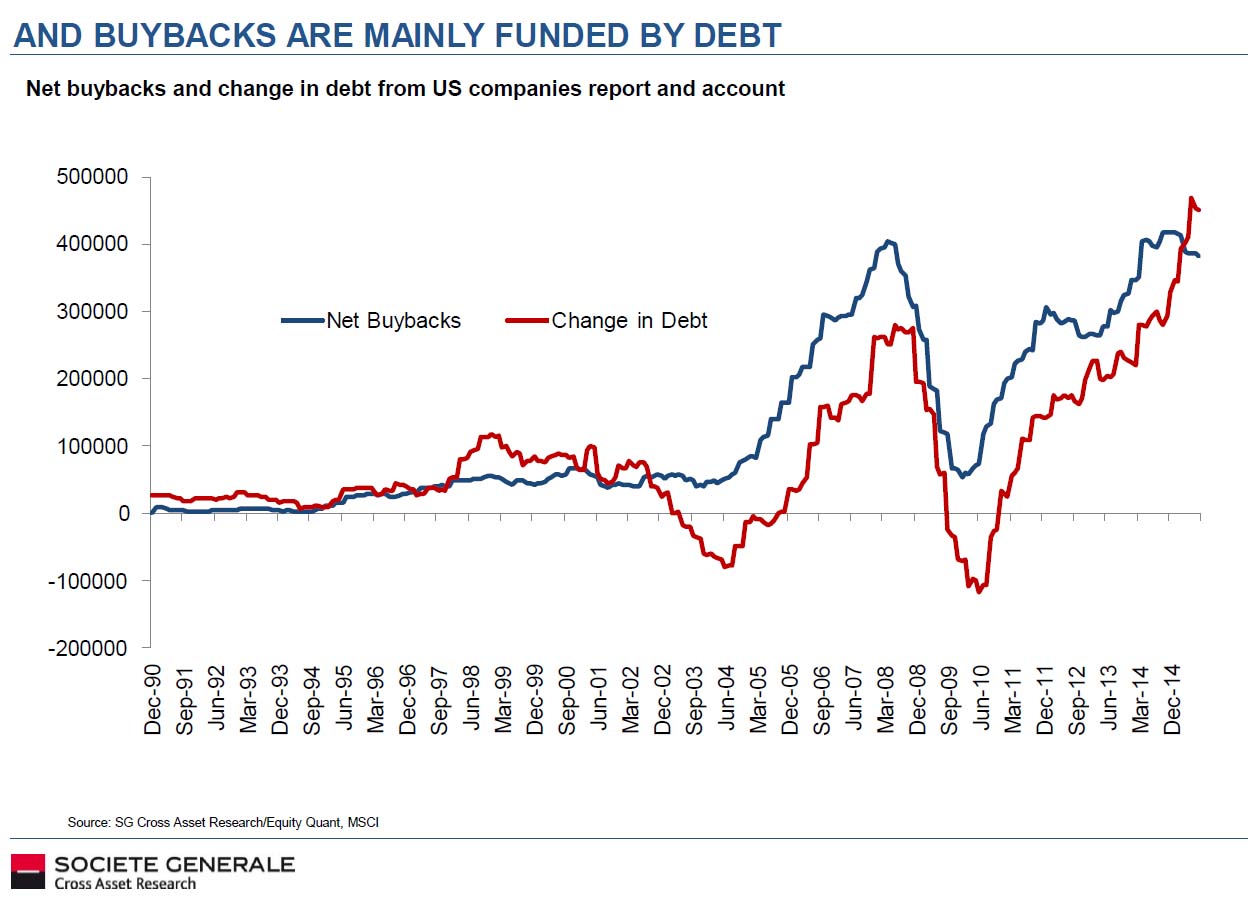
Investors don’t like to acknowledge bubbles. And because they’ve been so prone to deny them, bubbles (and their consequences) have become a recurring part of the financial landscape over the past two decades. During the late-1990’s technology/dot-com bubble, debt-financed malinvestment was mainly directed toward internet-related companies. The end result was a collapse in the Nasdaq 100 of -83%, while the S&P 500 lost half its value. By the 2002 low, the entire total return of the S&P 500 — in excess of Treasury bills — had been wiped out, all the way to back May 1996. It has taken yet another full-fledged multi-year speculative bubble to get the Nasdaq back to even (most likely only temporarily), and to bring the total return of the S&P 500 since 2000 to even 4% (again, most likely only temporarily). By the completion of the current market cycle, we fully expect that the total return of the S&P 500 since the 2000 peak will fall to zero or negative levels for what will then be a roughly 17-year span, and that the S&P 500 will have underperformed Treasury bills all the way back to roughly 1998; what will then be a nearly 20-year span. As a reminder of how unwilling investors are to acknowledge bubbles, one must remember that in 2000, even before the S&P 500 even reached its final bull market high on a total-return basis, a broad range of dot-com stocks had already collapsed by about 80% from their own 52-week highs. Investors were finally willing to acknowledge that bubble only after it collapsed, but somehow continued to believe that the bubble was contained only to dot-com companies, and continued to push the S&P 500 higher. Consider this gem from the Wall Street Journal, which appeared in July 2000 with the title “What were we THINKING?” “For a while it seemed that risk was dead. Now we know better... Why didn’t they see it coming? Arrogance, greed and optimism plus fear of being left out blinded people to the risks. After all, the dot-commers embraced risk. They prided themselves on their willingness to gamble and used it to justify their lucrative stock-option plans. Unfortunately, at the extreme far end of the risk curve, people lose perspective.” All of that apparent learning, stated in the past tense, might have been well and good were it not for the fact that the S&P 500 was still at record highs, at the most extreme valuation in history, and the broader collapse had not even started. The tech-heavy Nasdaq 100 was down -14% from its March 2000 high, but would go on to lose another -80% by its October 2002 low. Many of those companies were, and remain, outstanding businesses. But just as a parabolic stock price advance is no assurance that the underlying business is sound, having a sound underlying business does little to prevent an overvalued stock from collapsing once investors lose their taste for speculation. Investors have a habit of pointing to past bubbles as if they have actually learned something, even when they are in the midst of another one. By 2007, the S&P 500 had again reached record highs, though the market’s total return from the 2000 peak was still only about 2% annually. The preferred object of speculation during the housing bubble was mortgage debt. With the Federal Reserve suppressing yields to just 1% in 2003, yield-seeking investors found higher returns in mortgage securities, Wall Street jumped to create new “product,” credit standards were lowered, debt was “financially engineered” to bundle it in ways that could get a rubber stamp from ratings agencies, and unsound debt filled the portfolios of insurance companies, banks, and hedge funds. By the March 2009 low, the entire total return of the S&P 500 — in excess of Treasury bill returns — had been wiped out all the way back to June 1995. Investors, analysts, and economists look back on that bubble, and the global collapse that followed, as if they have actually learned something. So here we are, in what in hindsight will likely be called the “QE Bubble” — a moment in history where the most reckless and intentional encouragement of speculation by central bankers actually came to be viewed as not only acceptable but welcome. This is tolerated despite the fact that activist departures of monetary policy from simple rules (such as the Taylor Rule) have absolutely no correlation with subsequent economic activity. This is tolerated despite the clear evidence that yield-seeking speculation was the primary driver of malinvestment that created the housing bubble and economic collapse. We’ve still evidently learned nothing. The preferred object of debt-financed speculation this time around is the equity market. As for direct debt-finance of equity speculation, margin debt soared to more than $500 billion in April, 2.8% of GDP, eclipsing the 2000 and 2007 record highs. One should not compare margin debt to equity market capitalization, but rather to a fundamental; otherwise, the existence of a bubble in prices can make even alarming levels of margin debt appear reasonable. The recent level of stock margin debt is equivalent to 25% of all commercial and industrial loans in the U.S. banking system. Meanwhile, hundreds of billions more in low-quality covenant-lite debt have been issued in recent years. As a ratio of corporate gross value added, both corporate debt and the market value of corporate equities have climbed to the highest levels in history. Our friend Albert Edwards shares another interesting observation: the surge in corporate debt maps closely to the volume of net corporate equity buybacks.
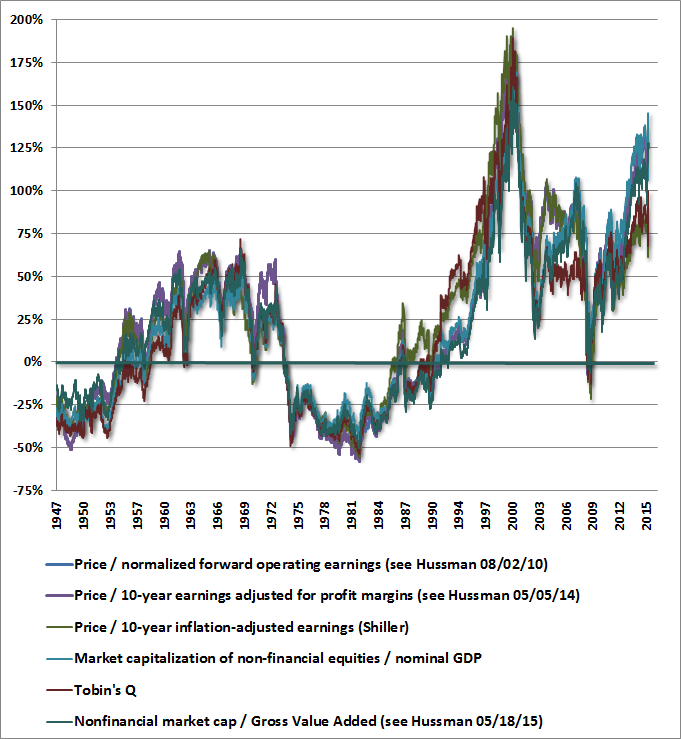
The preferred objects of speculation, and the greatest casualties of the 2000 bubble, were technology and dot-com companies. The preferred objects of speculation, and the greatest casualties of the mortgage bubble, were housing and the financial companies that held those mortgages. Recognize that because QE provoked such indiscriminate speculation, the recent extremes in the median price/earnings and price/revenue ratios, across all stocks, actually surpassed their 2000 peaks. Make no mistake: the preferred objects of speculation during the QE bubble have been low-grade debt and the entire stock market, indiscriminate of industry, sector, quality, or capitalization. We are now beginning to observe internal divergences that signal increasing risk aversion among investors. The greatest casualty of the QE bubble will also likely be low-grade debt and the entire stock market, probably just as indiscriminately. Investors don’t like to acknowledge bubbles. Yet somehow we have little doubt that a few years from now, they will look back at the present moment and ask that tragically perennial question: “What were we THINKING?” Choose your weapon As a brief valuation review, the chart below shows a variety of the most historically reliable valuation measures we identify, charted as percentage deviations from their historical norms. Note that raw price/forward earnings and the Fed Model are not among them, because their correlations with actual subsequent market returns are rather weak (though we’ve seen charts that make them look compelling as long as one ignores enough history). I wrote my August 20, 2007 market comment Long-Term Evidence on the Fed Model and Forward Operating P/E Ratios, to counter what I viewed as misguided claims of “reasonable valuation” at a time when, as now, historically reliable measures were quite extreme. That said, one can obtain a fairly useful valuation measure by adjusting the forward P/E to reduce the impact of cyclical fluctuations in profit margins. To obtain historical data before 1980, one has to impute based on other observable information (as explained in that 2007 article). That’s because forward operating earnings are an object created by Wall Street, not by Generally Accepted Accounting Principles. As I noted in Valuations Not Only Mean-Revert; They Mean-Invert, reliable valuation measures typically fully mean-revert within a 12-year horizon, meaning that there is no relationship between initial overvaluation (or undervaluation) and the level of overvaluation (or undervaluation) 12 years later. It follows that the most reliable horizon to relate valuations with subsequent equity market returns is also about 12 years. It’s also worth noting that since 1950, there has been no material relationship between interest rates and their level 12 years later. The following are the correlations, since 1950, between each valuation measure and actual subsequent S&P 500 nominal total returns over the following 12-year period. The correlations are negative because higher valuations are associated with lower returns: Shiller P/E: -84.7% correlation with actual subsequent 12-year S&P 500 total returns
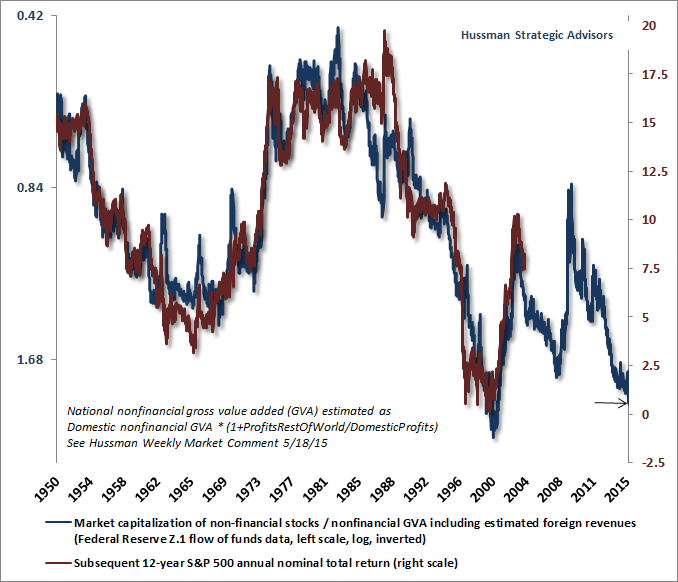
Choose your weapon. We view all of these measures as reasonably reliable (in comparison with a broad range of popular but largely worthless alternatives), but even here there are differences. Tobin’s Q and the Shiller P/E are currently the least extreme relative to their pre-bubble historical norms (75.5% and 99.6% overvalued, respectively), but they are also not as reliable as the other measures. Interestingly, market capitalization to GDP (which Warren Buffett once cited in a 2001 Fortune interview as “probably the best single measure of where valuations stand at any given moment”) is the most extreme among these, at more than 145% above its pre-bubble norm, implying a -59% market drop simply to restore that norm — not even to move to historical undervaluation. While Buffett hasn’t said boo about this indicator in recent years, it’s certainly not because it has lost its correlation with subsequent market outcomes in recent market cycles. Indeed, the correlation of Market Cap/GDP with subsequent 12-year S&P 500 returns since 1980 (capturing multiple recent market cycles) is even stronger at -93.0%. The same is true among all of these measures. Still, even MarketCap/GDP isn’t the most reliable measure presented here. Not surprisingly, if one had to choose a single weapon on the valuation front, my preference would be one of my own: nonfinancial market capitalization to corporate gross value added, inclusive of estimated foreign revenues (see my 5/18/15 comment introducing this measure). At present, MarketCap/GVA is about 128% above its pre-bubble norm, and implies negative 10-year S&P 500 nominal total returns, with expected 12-year S&P 500 nominal total returns averaging only about 1% annually. In the chart below, the blue line shows MarketCap/GVA on an inverted log scale (left). The red line shows the actual subsequent 12-year annual nominal total return of the S&P 500 in percent (right scale).
If it seems preposterous to expect such dismal market returns over a 10-12 year period, recall that the S&P 500 did worse than that after the 2000 market peak. In my view, the most likely path to dismal market returns is the one that has been most typical historically: a major bear market loss, followed by a long period of reasonably positive average returns that recover the loss over time. For example, either of the following possible outcomes would result in a 12-year total return just over 1% annually: a) a -47% market loss over 2 years, followed by a 10-year period in which the S&P 500 achieves a positive total return of 8% annually, or b) a -55% market loss over 2 years, followed by a 10-year period over which the S&P 500 achieves a positive total return of 10% annually. The reason I used those particular figures is that they correspond to the 2000-2002 and 2007-2009 collapses. Interestingly, if this sort of scenario actually emerges, the red line in the preceding chart will fit over the blue line like a glove. I expect we’re in for quite a loss in the S&P 500 over the completion of the present market cycle. What about interest rates? Investors may wish to believe that low interest rates somehow, by their very nature, are sufficient to prevent such losses. They may do well to recall that Japanese stocks plunged by -62% in 2000-2003 and -61% in 2007-2009 despite interest rates that never exceeded half of one percent. There are certainly structural differences between Japan and the U.S., but those differences do not extend to eliminating the iron laws of investing; that every security is a claim on some stream of expected future cash flows, and the higher the price one pays for those cash flows, the weaker the long-term rate of return. Recall also that the historical correlation between interest rates and equity valuations has actually been zero outside of the disinflationary 1980-1998 period. Suppressed interest rates can certainly encourage yield-seeking speculation, helping to drive equities and other securities to extreme valuations that offer similarly dismal prospects for future returns. But when investors turn risk-averse, as they did in 2000-2002 and 2007-2009, those dismal prospects are realized, and even persistent and aggressive Fed easing has not prevented U.S. equities from collapsing. Similarly, it’s tempting to assume that interest rates will remain so low in the future that investors will maintain stocks at extremely high valuation levels, with no tendency toward mean-reversion at all. The fact is that the correlation is very weak between interest rates at one date and interest rates 10-12 years later. More importantly, however, there is a 90% correlation between interest rates at any given date (e.g. the 10-year Treasury bond yield) and nominal economic growth over the preceding decade. So if you’re assuming that interest rates will be low a decade from now, you’re also effectively assuming that nominal economic growth will be dismal. The question of whether interest rates should directly enter a valuation model depends on what one is doing with it. If one wishes to estimate the long-term expected rate of return on a security, all that’s required is the expected stream of future cash flows and current price. In contrast, one might wish to reverse that question, and calculate the price that would be consistent with some required rate of return. In this case, interest rates come into the model only as a way of deciding what return one wishes to obtain. Given expected future cash flows and that required rate of return, it is then just arithmetic to calculate the corresponding price. As I noted in our 2015 Annual Report: “It is important to recognize that while depressed interest rates may encourage investors to drive risky securities to extreme valuations, the relationship between reliable valuation measures and subsequent investment returns is largely independent of interest rates. To understand this, suppose that an expected payment of $100 a decade from today can be purchased at a current price of $82. One can quickly calculate that the expected return on that investment is 2% annually. If the current price is given, no knowledge of prevailing interest rates is required to calculate that expected return. Rather, interest rates are important only to address the question of whether that 2% expected return is sufficient. If interest rates are zero, and an investor believes that a zero return on other investments is also appropriate, the investor is free to pay $100 today in return for the expected payment of $100 a decade from today. The investor may believe that such a trade reflects ‘fair value,’ but this does not change the fact that the investor should now expect zero return on the investment as a result of the high price that has been paid. Once extreme valuations are set, poor subsequent returns are baked in the cake.” As a side note, many of our methods of projecting 10-year S&P 500 total returns embed the assumption of 6% nominal growth in earnings, revenues and the broad economy; a rate that has been fairly consistent when one looks peak-to-peak across historical economic cycles, despite substantial shorter-term variation (see Ockham’s Razor and the Market Cycle). Assuming that interest rates will be strikingly low in the future is essentially equivalent to assuming nominal growth will be strikingly low. Because those two effects tend to offset each other, the relationship between valuations and subsequent 10-12 year returns has typically been unaffected. The long-term outcomes are inevitable; the shorter-run outcomes hinge on market internals When investors are inclined to speculate, they tend to be indiscriminate about it, so strongly speculative markets demonstrate a clear uniformity across a broad range of individual stocks, industries, sectors, and risk-sensitive securities, including debt of varying creditworthiness. In contrast, as risk-aversion sets in, the first evidence appears as divergence in these market internals. Put simply, overvaluation reflects compressed risk premiums and is reliably associated with poor long-term returns. Over shorter horizons, investor risk-preferences determine whether speculation will continue or collapse, and the condition of market internals acts as the hinge that distinguishes those two outcomes. Valuations have been obscene for some time. Historically, the thing that has differentiated an overvalued market that remains elevated or continues higher, and an overvalued market that plunges, is the preference of investors toward risk — which is best inferred from the uniformity or divergence of market internals. Those measures have been unfavorable since the third quarter of 2014, which has opened the door to more frequent air-pockets and vertical losses. As with the 2000 and 2007 top formations, market peaks are often a process, and while recoveries on weak internals tend to be followed by fresh losses, the process can extend for months. Overvalued, overbought, overbullish conditions have also been a rather persistent feature of the market in recent years. In prior cycles across history, similar extremes were typically accompanied or quickly followed by deterioration in market internals, and the overextended extremes were resolved by market losses. In the half-cycle advance since 2009, the Federal Reserve aggressively and intentionally encouraged yield-seeking speculation, and disrupted that overlap. One had to wait for market internals to deteriorate explicitly before adopting a strongly negative market outlook. That, in a nutshell, was our fundamental problem in this half-cycle; I responded directly to overvalued, overbought, overbullish conditions by immediately taking a negative market outlook; just as prior market cycles across history had encouraged. I’ve regularly admitted that error, but it’s equally important to understand why the market advanced despite wickedly overextended conditions. The reason is not that Fed easing can be blindly relied upon to support speculation (it certainly didn’t in 2000-2002 and 2007-2009), but rather because extreme valuation risk is typically only realized once investors become risk averse, as evidenced by deterioration in market internals. We addressed this in mid-2014 by imposing restrictions against adopting a hard-negative market outlook until our measures of market internals have also explicitly deteriorated. We don’t get to re-live the recent half-cycle, but we do have the opportunity to move forward with methods that are historically informed by a century of market cycles, and that resolve the primary issue that made the half-cycle since 2009 legitimately “different” as a result of extraordinary monetary policy. As I’ve noted before (see The Two Pillars of Full Cycle Investing and Air-Pockets, Free-Falls and Crashes), a more demanding emphasis on market internals is the primary factor that, in hindsight, would also have deferred our constructive response after the 40% market plunge in late-2008, holding off that shift until early-2009. Measures of what I’ve often called “early improvement in market action” that were effective in post-war data were too fragile and prone to whipsaw to endure the extremes of the Great Depression and the late-2008 to early-2009 period. More robust factors (particularly relating to risk-sensitive internals such as credit spreads) were necessary, and that was one of the key outcomes of our 2009 stress-testing efforts. In short, market internals are the hinge that not only distinguishes overvalued markets that continue higher from overvalued markets that collapse; they are also the hinge that distinguishes undervalued markets prone to further losses from undervalued markets that give rise to new bull advances. The same sort of hinge operates with regard to economic prospects. As Bill Hester nicely illustrated a few weeks ago, given economic activity similar to the present, the likelihood of a recession has been remarkably higher when the equity market has been fairly weak; for example, below its 12-month average, or its level 6 months earlier. Notably, the S&P 500 is below both levels at present. The same is also true with regard to Fed easing and Fed tightening. In the presence of rich valuations, and the absence of favorable market internals, a Fed easing is actually the most bearish event that can occur (see When An Easy Fed Doesn’t Help Stocks and When It Does), mainly because Fed easing in risk-off conditions is typically a response to continuing economic deterioration. The overall economic and financial landscape, then, is one where obscene valuations imply zero or negative S&P 500 total returns for more than a decade — an outcome that is largely baked-in-the-cake regardless of shorter term economic or speculative factors. Presently, market internals remain unfavorable as well. Coming off of recent overvalued, overbought, overbullish extremes, this has historically opened a clear vulnerability of the market to air-pockets, free-falls and crashes. From an economic standpoint, the most leading measures of economic activity are new orders and order backlogs, followed by sales and production, followed by income, and followed much later by employment measures. From that standpoint, the most leading measures of economic activity are clearly deteriorating, even while many observers look to the lagging employment measures as if they are predictive. In the context of poor market action, similar economic data has been associated with a high risk of recession (though we don’t currently have sufficient evidence to anticipate a recession with confidence). As for Fed policy, in my view, there is — and has been for some time — an immediate case to be made for the Fed to stop reinvesting the proceeds of balance sheet assets as they mature. The Fed could reduce its balance sheet by $1.4 trillion without driving market interest rates higher. The only way to drive market rates higher here is for the Fed to explicitly pay banks interest on excess reserves. Given that there is no empirical evidence that activist departures of Fed policy from a fixed rule (such as the Taylor Rule) have any meaningful effect on the real economy, we’re fairly indifferent to whether the Fed raises rates or not in December. Our primary focus is on market internals here — not because an improvement would change the dismal long-term market outlook a bit, but rather because an improvement would suggest fresh risk-seeking that could defer a collapse in the nearer-term. In the absence of improved market internals, my impression is that the economy is increasingly likely to roll into a recession at the same time the equity market rolls into a rather severe bear market decline. If the Fed raises rates in that environment, the FOMC will likely be blamed for losses that are actually already inevitable as a result of the Fed’s much earlier recklessness. If the Fed fails to raise rates in that environment, after having conditioned investors to expect a rate hike, it will likely be taken as a vote of no-confidence in the economy, and the FOMC will likely be blamed for losses that are actually already inevitable as a result of its much earlier recklessness. A uniform improvement in market internals would suggest fresh speculative pressures that could defer these outcomes, but ultimately, the only way to avoid near-term losses is to make the prospect of longer-term losses that much worse.The foregoing comments represent the general investment analysis and economic views of the Advisor, and are provided solely for the purpose of information, instruction and discourse. Please see periodic remarks on the Fund Notes and Commentary page for discussion relating specifically to the Hussman Funds and the investment positions of the Funds. --- The foregoing comments represent the general investment analysis and economic views of the Advisor, and are provided solely for the purpose of information, instruction and discourse. Prospectuses for the Hussman Strategic Growth Fund, the Hussman Strategic Total Return Fund, the Hussman Strategic International Fund, and the Hussman Strategic Dividend Value Fund, as well as Fund reports and other information, are available by clicking "The Funds" menu button from any page of this website. |
|||||||||||||||||||||||||
|
For more information about investing in the Hussman Funds, please call us at
1-800-HUSSMAN (1-800-487-7626) 513-326-3551 outside the United States Site and site contents © copyright Hussman Funds. Brief quotations including attribution and a direct link to this site (www.hussmanfunds.com) are authorized. All other rights reserved and actively enforced. Extensive or unattributed reproduction of text or research findings are violations of copyright law. Site design by 1WebsiteDesigners. |