|
|
||||||
|
|

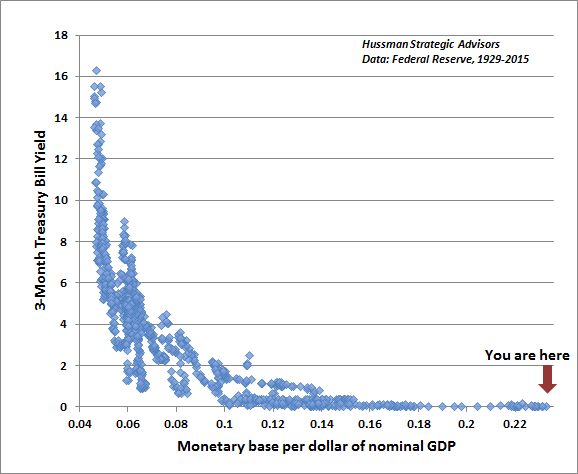
May 16, 2016 Blowing Bubbles: QE and the Iron Laws Look across the room you’re in, and imagine there’s a $100 bill taped in the far upper corner, where the walls and ceiling meet. Imagine you’re handing over some amount of money today, in return for a claim on that $100 bill 12 years from now. Drop your hand toward to the floor. If you pay $13.70 today for that future $100 cash flow, you can expect an 18% annual return on your investment over the next 12 years. Raise your hand a little higher. If you pay $25.60 today for that future $100 cash flow, you can expect a 12% annual return on your investment over the next 12 years Raise your hand just above chest-level. If you pay $39.60 today, you can expect an 8% annual return. Move your hand to the top of your head. If you pay $70.10 today, you can expect a 3% annual return. Raise your hand above your head. If you pay $78.90 today, you can expect a 2% annual return. Now imagine jumping up and touching the ceiling with your hand. If you pay $100 today for that future $100 cash flow, you’ll earn nothing on your investment over the next 12 years. The exercise you just did is the single most important thing to understand about long-term investing. I’ve often called it the Iron Law of Valuation: the higher the price you pay today for a given stream of future cash flows, the lower your rate of return over the life of the investment. As the price goes up, what investors considered “expected future return” only a moment before is suddenly converted into “realized past return.” The higher the current price rises, the more expected future returns are converted into realized past returns, and the less expected future return is left on the table. Notice that the point where a security seems most enticing on the basis of realized past returns is also the point where the security is least promising on the basis of expected future returns. While the Iron Law of Valuation will serve you well over the complete market cycle, it can make for a miserable time over shorter portions of the cycle. Here’s the wrinkle. Even if a security or market seems wildly overvalued, nothing prevents it from becoming even more overvalued in the near term, provided that investors are in a speculative mood. For that reason, we have to join the Iron Law of Valuation with what I call the Iron Law of Speculation: the near-term outcome of speculative, overvalued markets is conditional on investor preferences toward risk-seeking or risk-aversion, and those preferences can be largely inferred from observable market internals and credit spreads (when investors are inclined to speculate, they tend to be indiscriminate about it). In the long-term, investment outcomes are chiefly defined by valuations, but over the shorter-term, the difference between an overvalued market that becomes more overvalued, and an overvalued market that crashes, has little to do with the level of valuation and everything to do with investor risk preferences. One more Iron Law will help to put current market conditions into perspective. It’s what I call the Iron Law of Equilibrium: once a security is issued, it must be held by someone at every point in time, until that security is retired. For example, every dollar of monetary base created by the Federal Reserve has to be held by someone, in the form of base money, until it is retired by the Fed. Buyers never put those dollars “into” the stock market without sellers immediately taking those dollars right back out. So the pile of base money “on the sidelines” never comes “off the sidelines” because it can’t magically transform into something else; it just changes hands. Likewise, the Iron Law of Equilibrium says that there are never “more buyers than sellers” or “more sellers than buyers.” Every share of stock that is sold by a seller goes into the hands of some buyer. Prices aren’t driven up or down by “money flow” or a surplus of buying over selling. Prices are driven up or down depending only on who is more eager, the buyers or the sellers. Together, the Iron Laws help to explain the mechanism behind quantitative easing. They also warn that because of extended zero-interest policy by the Fed, security valuations have advanced to the point where prospective nominal total returns on a conventional portfolio mix are likely to average well below 2% annually, with negative real returns, over the coming 12-year period. Blowing bubbles - QE and the Iron Laws Operationally, the Federal Reserve’s program of quantitative easing involves expanding the “monetary base” (currency plus bank reserves), which it does by buying up Treasury bonds and paying for them with zero-interest base money, which is a “liability” of the Fed. In effect, QE alters the composition of government liabilities, changing their form from Treasury debt to base money. What happens to the base money? Well, the Iron Law of Equilibrium ensures that the base money will stay base money until it is retired by the Fed. But someone has to hold it at every moment in time, and nobody is comfortable holding much of it if there are decent alternatives available. So the holders look for something else to hold instead. The first stop is Treasury bills. As holders of monetary base try to get rid of their hot potatoes by purchasing Treasury bills, T-bill prices rise, and (per the Iron Law of Valuation) their yield declines. Meanwhile, the monetary base simply drops into someone else's hands, and remains a hot potato. The reach-for-yield stops when T-bill yields drop so low that investors are indifferent between zero-interest cash and low-yielding Treasury bills. Here’s what this tradeoff looks like in practice, in data since 1929. This is our version of what economists will recognize as the “liquidity preference curve.” There is a highly systematic relationship between the quantity of hot potatoes outstanding (monetary base as a fraction of nominal GDP) and the level of Treasury bill yields across history. The more zero-interest money the Fed forces into the system, the more investors are inclined chase yields on competing assets toward zero as well.
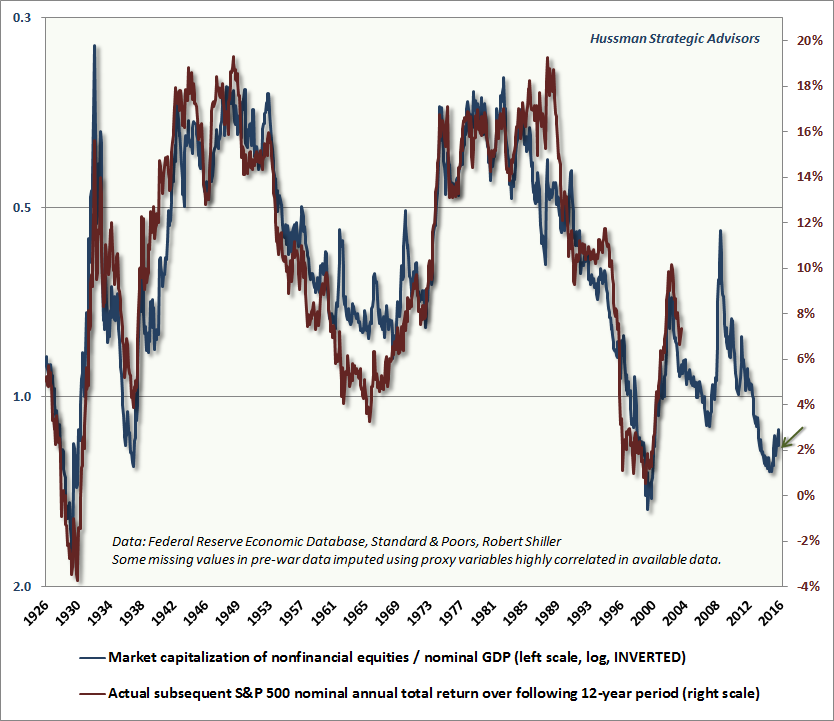
This yield-seeking doesn’t end with Treasury bills. As long as investors aren’t too concerned about the risk of capital losses - that is, as long as investors are in a risk-seeking mood (Iron Law of Speculation), a mountain of zero-interest hot potatoes will also embolden investors to chase yield further out on the risk spectrum, for example, in junk debt, stocks and mortgage securities. As stock prices rise, prospective returns drop (Iron Law of Valuation). Are rich valuations enough to stop the speculation? It depends. In previous market cycles across history, the speculation reliably ended once a syndrome of “overvalued, overbought, overbullish” conditions emerged. Unfortunately, that historical tendency turned out to be our Achilles Heel in the market cycle since 2009. The most challenging lesson for us in recent years was that in the face of QE, even extreme “overvalued, overbought, overbullish” syndromes were not enough to discourage continued speculation. One had to wait until market internals deteriorated explicitly before adopting a hard-negative market outlook (see the Box in The Next Big Short for the full narrative of these challenges in the advancing half-cycle since 2009). Our challenges in the recent half-cycle have invited valid criticisms, but they should be directed at the right issues. Don’t criticize historically reliable valuation measures that have maintained the same tight relationship with actual subsequent 10-12 year market returns that they’ve demonstrated across a century of history. Instead, criticize my insistence on stress-testing our methods against Depression-era data, following a financial crisis that we fully anticipated. Criticize me for the awkward transition that followed, for relying too heavily on the historical implications of “overvalued, overbought, overbullish” syndromes, and for not realizing - until it was too late to help us in this particular cycle - that the recklessness of QE required us to wait until market internals explicitly deteriorated before adopting a hard-negative market outlook. Those were our central issues in this half-cycle, and I’ve admitted and addressed them openly. Still, the fact is that I’ve adopted a constructive outlook after every bear market decline in over 30 years as a professional investor (including late-2008 after the market collapsed by over 40%, though that shift was truncated by my insistence on stress-testing), and I’ve also repeatedly anticipated the steepest losses. It’s easy enough to dismiss our objective concerns about valuations and market action with ad hominem criticisms. But don’t imagine for a moment that current valuation extremes will end in something other than tragedy unless investors shift back from risk-aversion to a fresh round of speculation (which we would infer from market internals). Even then, fresh speculation would, at best, only defer the near-term realization of inevitably dismal long-term consequences. Does anyone really believe that extreme yield-seeking has not already played out in the stock and bond markets? When investors say “there’s no alternative” to overpriced, risky assets, do they not recognize that virtually every investor on the planet has acted on that same belief? Do they not recognize that the absence of yield on short-term money is exactly why stocks and bonds are now also priced to deliver next to nothing over the coming 10-12 years? Do they not recognize that past realized returns have stolen from future prospective returns? Do they not understand that for future prospective returns to normalize even moderately over the completion of the current market cycle (as they have done over the completion of every market cycle in history), much of those past realized returns must be wiped out? Do they not recall that the completion of a market cycle has typically wiped out more than half of the preceding bull market gain? Do they not recall that the 2000-2002 decline wiped out the entire total return of the S&P 500 in excess of Treasury bills, all the way back to May 1996? Do they not recall that the 2007-2009 decline wiped out the entire total return of the S&P 500 in excess of Treasury bills, all the way back to June 1995? Honestly - why is it that at every market extreme, including 2000, 2007, and today, investors have insisted on ignoring the inverse relationship between the prices they pay and the subsequent future investment outcomes they can expect? The chart below is a reminder of this inverse relationship. I’ve included this chart in several recent comments, as it’s probably the most important feature that investors should recognize in present market conditions. While we prefer to compare market capitalization with corporate gross value added, including estimated foreign revenues, the following chart provides a longer historical perspective of where reliable valuation measures stand at present. The chart shows the ratio of market capitalization to nominal GDP on an inverted log scale (blue, left scale). Below, I’ve imputed some of the pre-war data points based on highly correlated proxy data that is available through the full period. Actual subsequent S&P 500 annual total returns are shown in red (right scale).
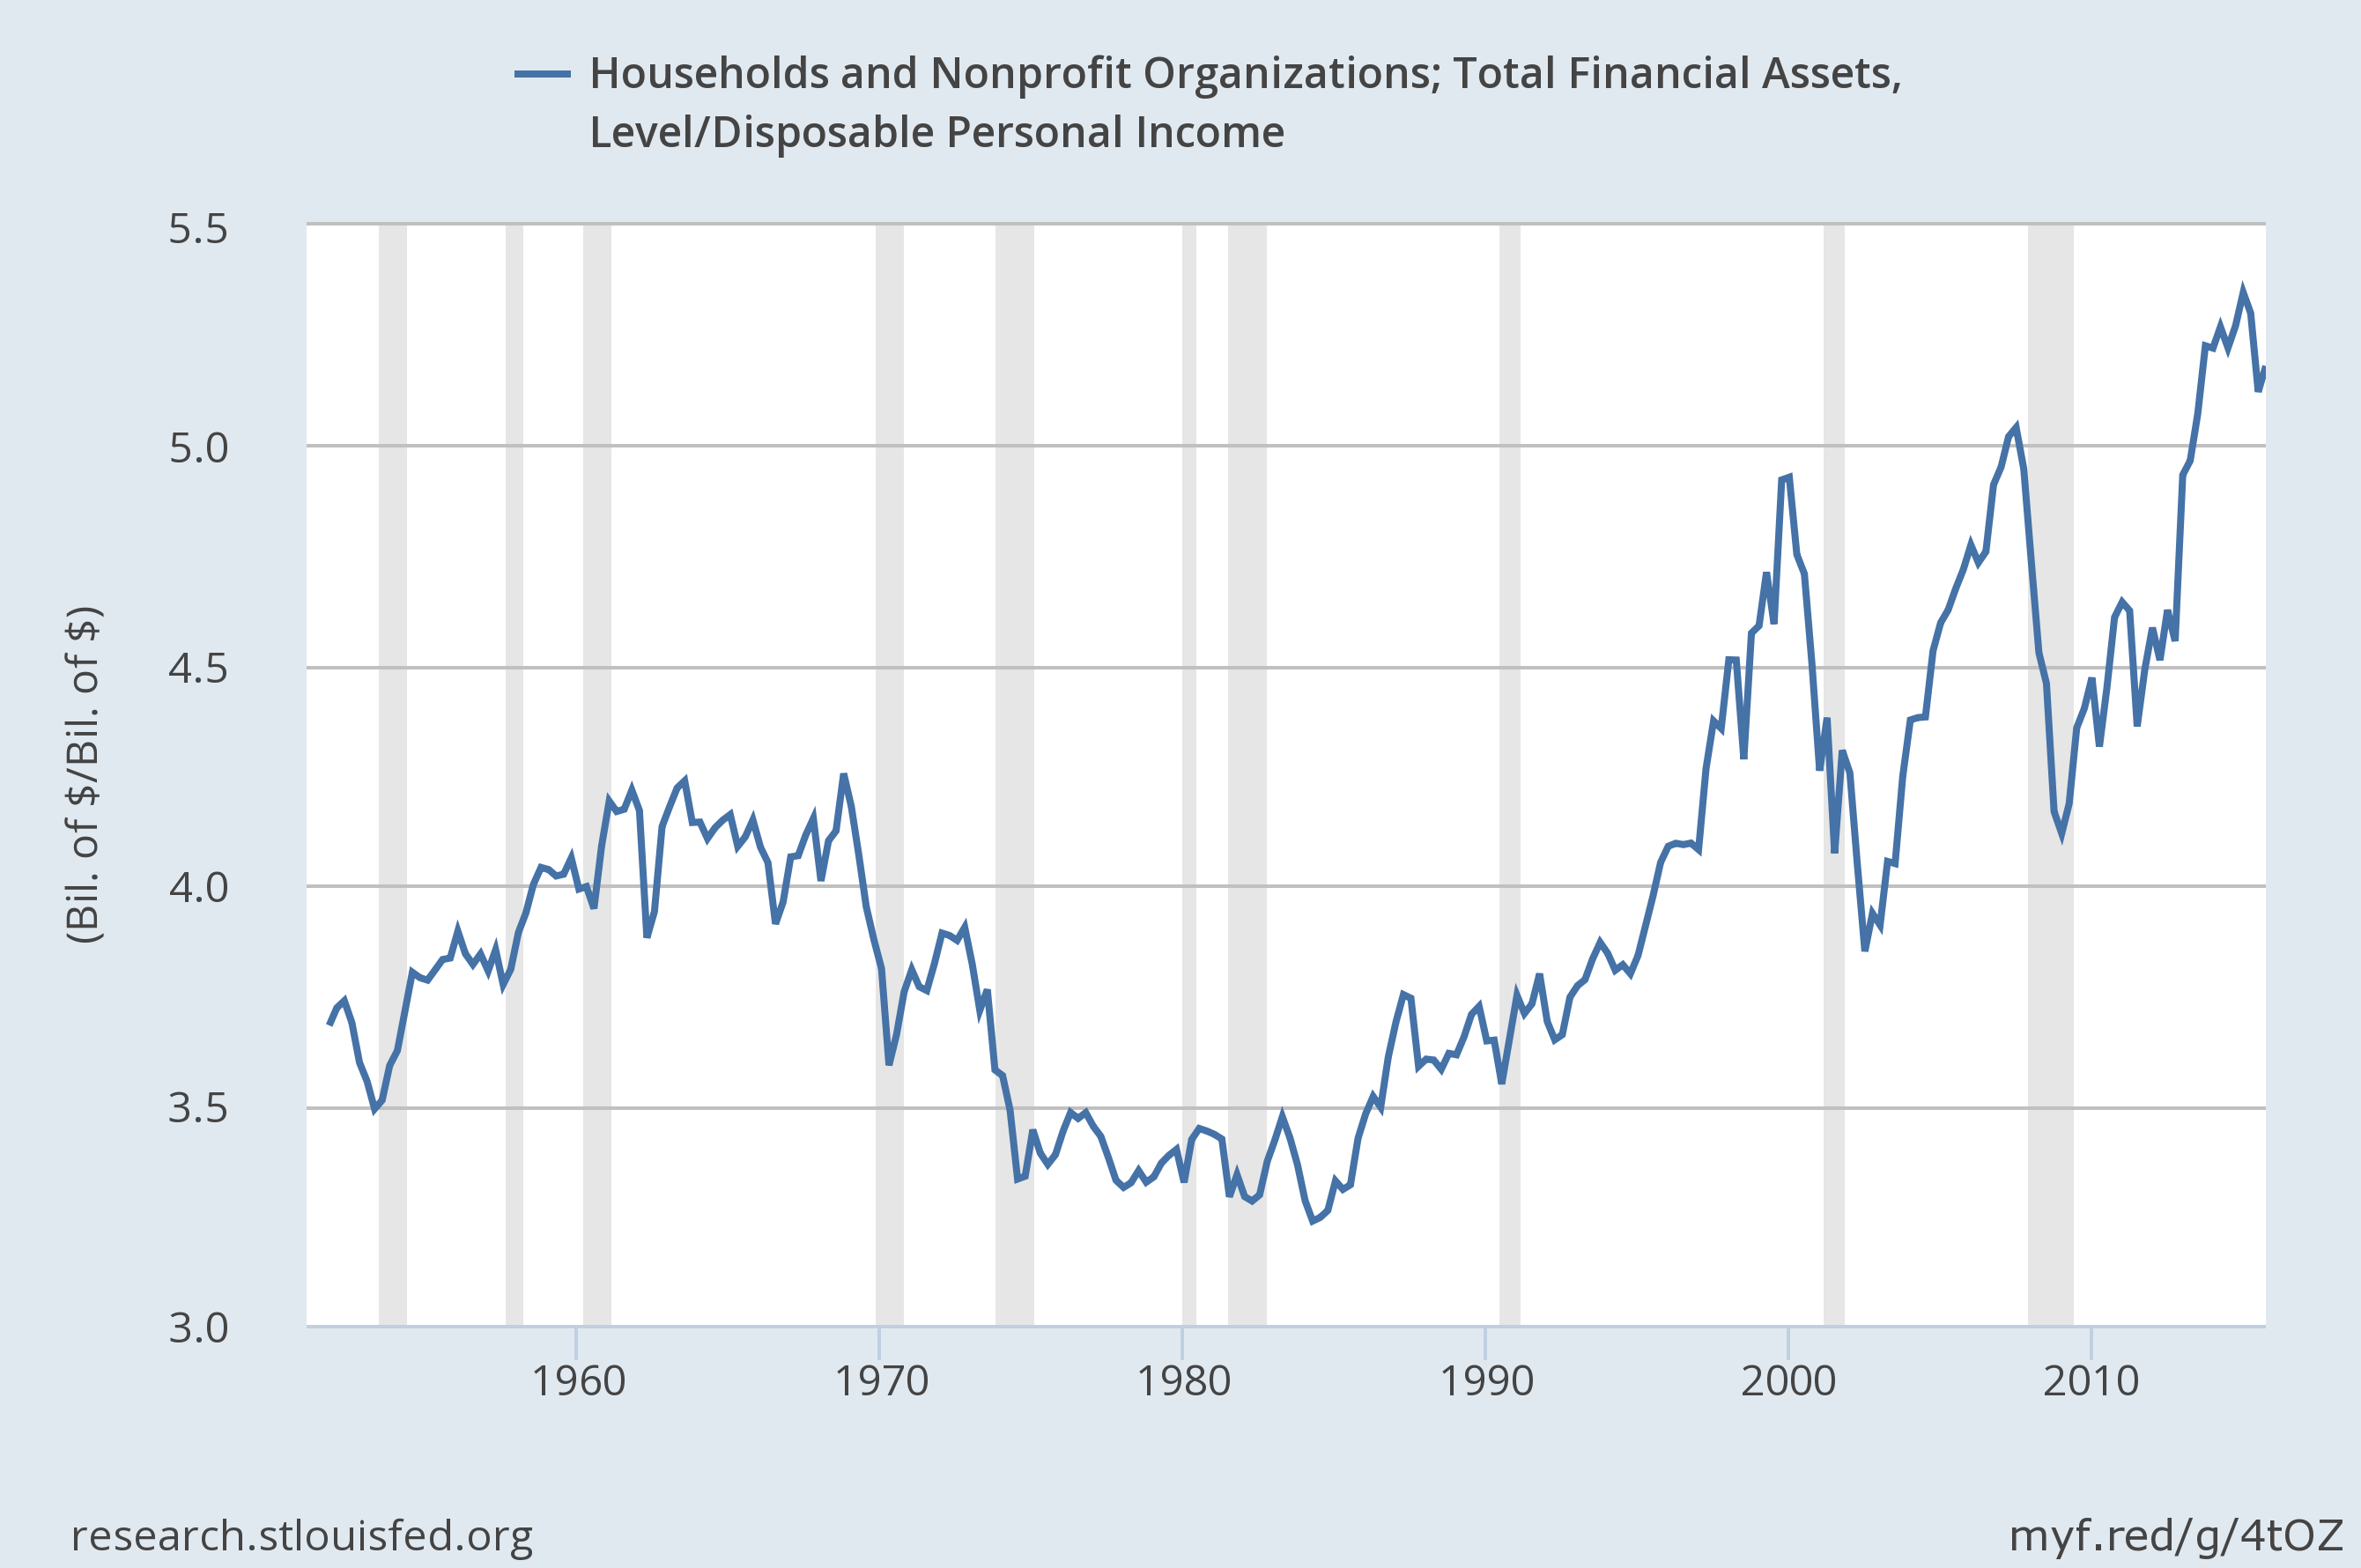
Look at the relationship above from the standpoint of our $100 taped to the corner of the ceiling. Valuations in 1949 and 1982 were like paying $13.70 for the future $100 cash flow, as valuations were consistent with subsequent annual S&P 500 total returns averaging 18% over the following 12-year period. 1954 and 1992 were like paying $25.60, and were followed by 12% annual S&P 500 total returns over the subsequent 12-year period. Early 2003 was like paying $39.60, and was followed by 8% annual S&P 500 total returns over the subsequent 12-year period. The 2007 market peak was like paying $70.10 for a future $100 cash flow, as valuations were consistent with expected total returns for the S&P 500 of just 3% annually over the following 12-year period. Current valuations are like paying $78.90 today for an expected $100 payment 12 years from today, reflecting expected total returns averaging only about 2% annually. Given that the S&P 500 dividend yield is slightly above 2% here, that expectation also implies that we fully expect the S&P 500 Index itself to be below its current level 12 years from now. Finally, the 2000 market peak was like paying $100 for a $100 claim 12 years later, consistent with my projections at that time, based on similar valuation considerations. Apart from more extreme speculation, this time is not “different” Recent cycles provide no evidence of deterioration in the relationship between reliable valuation measures (particularly those that aren’t highly sensitive to fluctuations in profit margins) and actual subsequent market returns. Again, quantitative easing did create one legitimate “difference” in the half-cycle since 2009, by encouraging speculation even after the emergence of extreme “overvalued, overbought, overbullish” conditions that had regularly been followed by losses in previous market cycles. One had to wait until market internals deteriorated explicitly before adopting a hard-negative market outlook (which is the adaptation we imposed on our discipline in mid-2014). Those who are convinced that some mechanism makes historically reliable valuation measures wholly irrelevant are perfectly welcome to speculate as they wish, but aside from indignant verbal arguments, we see no rigorous analysis to support that belief. On that point, to argue that low interest rates are enough to make extreme valuations irrelevant is to wholly miss the point. Yes, yes, yes, yes, zero interest rates have encouraged investors to drive equity valuations to historical extremes. Indeed, the median price/revenue ratio of individual U.S. stocks has never been higher, not even at the 2000 peak. The median ratio of enterprise value to EBITDA is also in the top 1% of historical observations. The essential point, however, is that these elevated valuations don’t change the stream of future cash flows. All they have done is to reduce prospective future returns on risky assets to zero as well. As I’ve noted before, if you think that zero interest rates justify near-zero 10-12 year total returns on the S&P 500, along with the prospect of 40-55% cyclical market losses in the interim, then sure, current market valuations are “justified.” Recall something else. The 2000 peak was accompanied by 10-year Treasury bond yields over 6.5%. At present, 10-year bond yields are just 1.7%. As a result, even though expected returns on stocks were actually negative on a 10-12 year horizon in 2000, and are presently 0-2% on that horizon, the expected return on a traditional portfolio mix is actually lower at present than at any point in history except the 1929 and 1937 market peaks. QE has effectively front-loaded realized past returns, while destroying the future return prospects of conventional portfolios, at least as measured from current valuations. As a result, the coming years are likely to see a major pension crisis across both corporations and municipalities because the illusory front-loading of returns has encouraged profound underfunding. Are these extreme valuations “good”? Do they create more “wealth”? Think about it. In order for this presumptive “wealth” to be spent, the overvalued securities have to be sold, but at that moment - Iron Law of Equilibrium - someone else has to buy them. The seller effectively receives a transfer of spending power from the buyer, and the buyer is left holding the bag of poor long-term returns. No - the true “wealth” is in the stream of future cash flows and value-added production that generates those future cash flows. All rich valuations do is provide a window of opportunity for current holders to obtain a wealth transfer from buyers, but the only way to realize that is by selling. The moment enough holders attempt to do so, the presumptive “wealth” vanishes, because all of this “wealth” reflects nothing other than the relative eagerness of the marginal buyer and the marginal seller. Put simply, the true wealth is in the cash flows, not in the overvalued prices. Policy makers at the Fed seem to be thinking about this issue so loosely that they don’t recognize that security markets operate under the constraints of equilibrium. This failure of systematic thinking is why they’ve responded to the devastating consequences of a yield-seeking mortgage bubble by encouraging yet another yield-seeking bubble, but this time in virtually every class of risky assets. All of this will end badly. One way to observe the effects of Fed-induced yield seeking speculation is to examine the value of financial assets held by households (the Z.1 flow of funds data include nonprofit organizations here), relative to disposable household income. This ratio has reached the highest level in history, having crashed twice from lesser highs in 2000 and 2007.
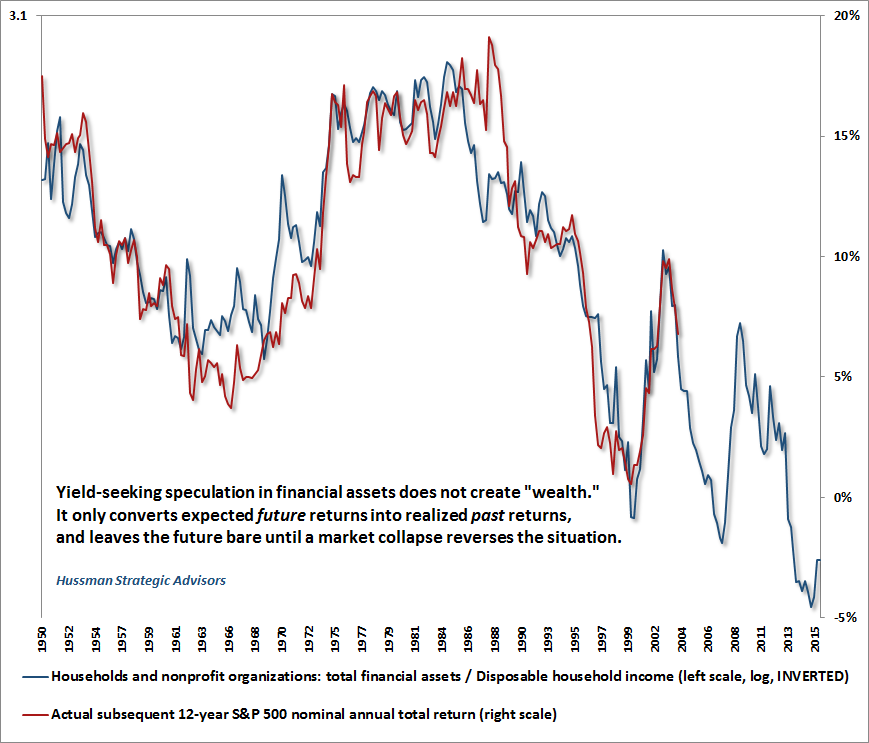
Now, one might object that a high value of financial assets relative to disposable income is actually a good thing, and that it reflects greater saving by households. Unfortunately, since 2000, saving as a fraction of household income has plunged to half the savings rate observed in the previous half-century. No, the elevated level of financial assets reflects extreme valuations, not an increase in the rate of financial investment. Still, one might argue that these elevated valuations are somehow a good thing - that these richly valued financial assets represent spendable “wealth.” But again, the true “wealth” represented by any security is in the stream of future cash flows it delivers over time, and in the value-added production that generates those cash flows. Until those cash flows are delivered, security prices only reflect the relative eagerness of investors to trade claims on those future cash flows. Put another way, in order for the holder of any security of spend out of that investment, the security has to be sold to another investor who locks in the identical amount of funds (Iron Law of Equilibrium). Extreme valuations don’t equate to higher wealth; they just mean that buyers are probably giving up too much current purchasing power for their claim on future purchasing power. Depressed valuations don’t equate to lower wealth; they just mean that sellers are probably giving up too much future purchasing power in order to obtain current purchasing power. To illustrate this, the chart below shows the same data as above, but places financial assets / disposable income on an inverted log scale (blue line, left). Actual subsequent 12-year S&P 500 nominal total returns are plotted in red (right scale). It’s difficult to draw a favorable conclusion from current extremes. That said, my sense is that despite the clear relationship with actual subsequent market returns, the reality isn’t quite as alarming. That’s because financial assets include both stocks and bonds, while the red line features outcomes for stocks alone, so unlike measures like market capitalization to corporate gross value added, the chart below has a bit of “apples and oranges” at work. Our actual expectation for 12-year S&P 500 total returns is closer to 2% annually, compared with the roughly -3% implied below.
The foregoing comments represent the general investment analysis and economic views of the Advisor, and are provided solely for the purpose of information, instruction and discourse. Please see periodic remarks on the Fund Notes and Commentary page for discussion relating specifically to the Hussman Funds and the investment positions of the Funds. --- The foregoing comments represent the general investment analysis and economic views of the Advisor, and are provided solely for the purpose of information, instruction and discourse. Prospectuses for the Hussman Strategic Growth Fund, the Hussman Strategic Total Return Fund, the Hussman Strategic International Fund, and the Hussman Strategic Dividend Value Fund, as well as Fund reports and other information, are available by clicking "The Funds" menu button from any page of this website. |
|||||||||||||||||||||||||
|
For more information about investing in the Hussman Funds, please call us at
1-800-HUSSMAN (1-800-487-7626) 513-326-3551 outside the United States Site and site contents © copyright Hussman Funds. Brief quotations including attribution and a direct link to this site (www.hussmanfunds.com) are authorized. All other rights reserved and actively enforced. Extensive or unattributed reproduction of text or research findings are violations of copyright law. Site design by 1WebsiteDesigners. |