|
|
||||||
|
|

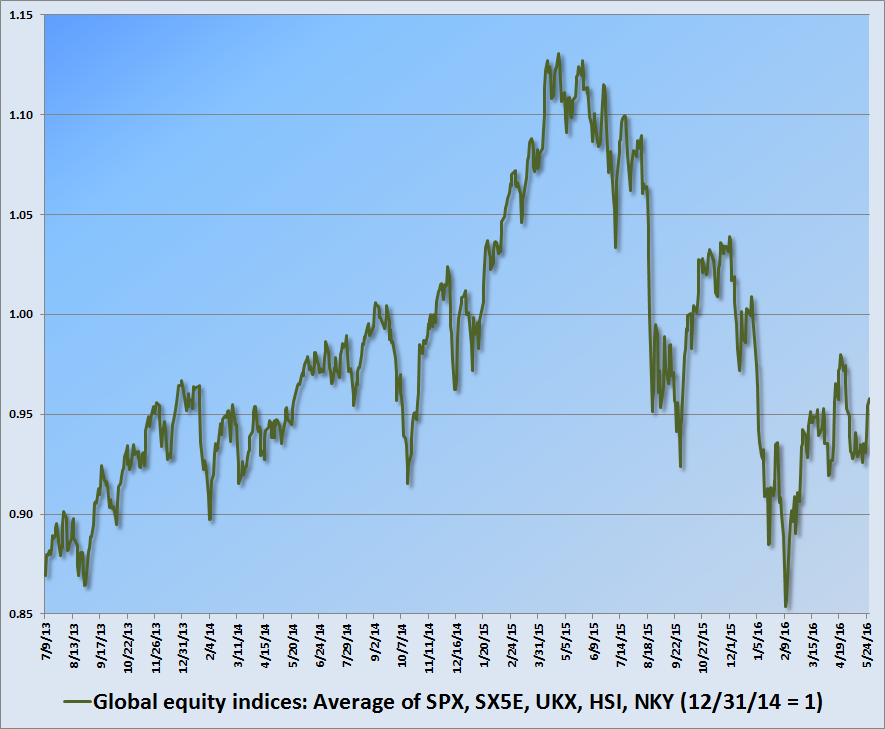
May 30, 2016 Choose Your Weapon Prevailing market conditions continue to hold the expected stock market return/risk profile in the most negative classification we identify. That profile reflects not only extreme valuations on the most reliable measures we’ve tested across history, but market internals and other features of market action that remain unfavorable. A sufficient improvement in market internals here would shift the expected market return/risk profile to a more neutral classification. That, coupled with a broader improvement in economic factors, mirroring conditions that prevailed during much of this half-cycle prior to mid-2014, could support an outlook - even at presently obscene valuations - that we might characterize as “constructive with a safety-net.” So while our immediate outlook is quite negative, we’ll take new evidence as it comes. In any event, looking beyond the near-term horizon, I doubt that any shift in market action will meaningfully reduce the likelihood of a 40-55% loss in the S&P 500 over the completion of the current market cycle, nor the likelihood of 0-2% total returns for the S&P 500 on a 10-12 year horizon; both which imply that we fully expect the S&P 500 Index itself to be below present levels 10-12 years from today. Put simply, long-term investment outcomes are tightly linked to valuations, but near-term market outcomes are linked to investor attitudes toward risk-seeking and risk-aversion, which are best inferred from the uniformity of market internals across individual securities, industries, sectors, and security-types, including debt securities of varying creditworthiness. That interplay between valuations (which drive long-term investment returns) and market internals (which reflect the shorter-horizon speculative inclinations of investors) was ultimately at the root of our inadvertent difficulties in the half-cycle advance between 2009 and mid-2014. See the “Box” in The Next Big Short for a detailed narrative, and the adaptations that followed in response to the Federal Reserve's intentional encouragement of yield-seeking speculation. While the recent market advance has taken several capitalization-weighted indices within a few percent of their May 2015 highs, and has brought the median price-revenue ratio of individual stocks to the highest level in history (eclipsing even the 2000 extreme), trading volume and other measures of sponsorship give recent market action the appearance of a short-squeeze rather than a robust shift in the willingness of investors to embrace risk. Moreover, the advance has emerged in the context of a broader retreat in equity markets internationally. This may change, of course, and it’s important to allow for that possibility. But at present, market conditions appear consistent with the late-stage of a major top formation; one that began in mid-2014, has taken the major indices sideways for more than 18-months, and broadly peaked in mid-2015. New highs in one index or another, even the S&P 500, would not in themselves be sufficient to shift this profile, but again, we don’t rule out a more uniform shift that would suggest a return toward risk-seeking preferences among investors. The chart below provides a somewhat broader context to the recent market advance, showing average equity market behavior in the U.S., Europe, Britain, Hong Kong, and Japan.
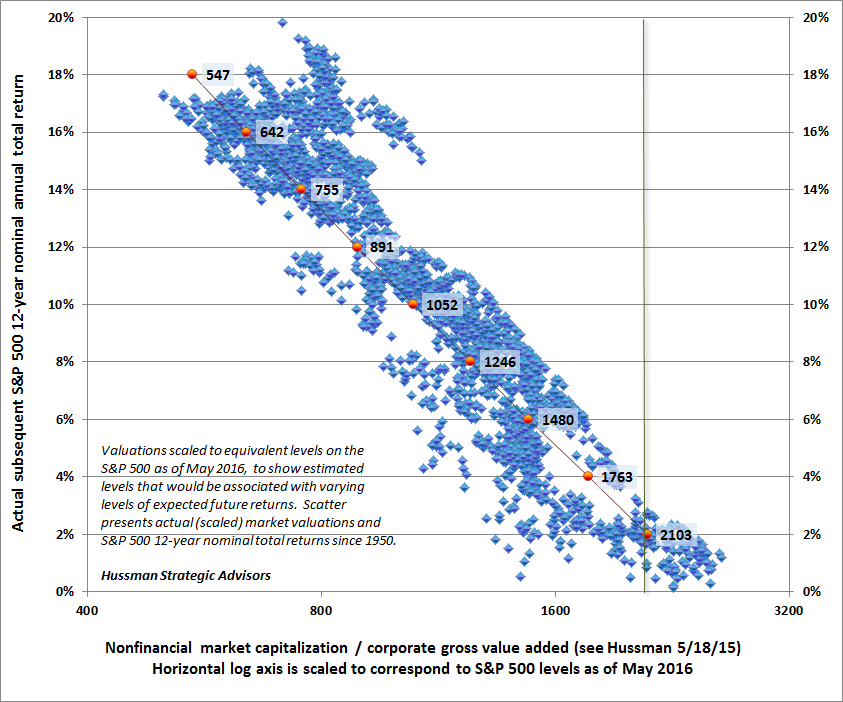
Choose your weapon Ultimately, the intentional encouragement of speculation by central banks in recent years has created a situation from which no resolution is possible other than 0-2% investment returns on a 10-12 year horizon, and a market collapse over the completion of the current market cycle. We are under no delusion that central banks will abandon their attempts to distort the financial markets, but bear in mind that monetary easing is only effective in encouraging speculation when investors are already inclined to speculate (see When an Easy Fed Doesn’t Help Stocks, and When it Does). When investors are risk-averse, default-free liquidity is a desirable asset, not an inferior one, so producing more of the stuff is ineffective in provoking speculation, as investors should have learned during the 2000-2002 and 2007-2009 collapses. Janet Yellen demonstrated an unwitting short-sightedness last week in calling quantitative easing a “new policy tool.” In the full light of history, QE will ultimately be regarded as a reckless, misguided, economically fatal conceit. The Iron Law of Valuation bears repeating here - the higher the price an investor pays for a given set of future cash flows, the lower the long-term return the investor can expect. The definition of “fair value” requires one to specify the level of return that one considers “fair.” To argue that market valuations are extreme because interest rates are low is to miss this point. Yes, if an investor views total returns of 0-2% on the S&P 500 over the coming 10-12 years as “fair,” then it directly follows that stocks are “fairly” valued. The problem is that it’s not at all clear that investors recognize how extreme valuations have become, and how uninspiring future market returns will be, as a result of relentless yield-seeking speculation in recent years. A careful consideration of valuations, and their historical correlation with actual subsequent market returns, will help to put current market extremes into a full-cycle perspective. Expanding on recent weekly comments (Blowing Bubbles: QE and the Iron Laws, and The Coming Fed-Induced Pension Bust), the historical correlations between various valuation measures and subsequent 12-year S&P 500 nominal total returns are presented below. Note that since the Fed Model and the S&P 500 dividend yield are expressed in terms of yield rather than as multiples, they are correlated positively, not negatively with subsequent returns. As usual, whenever one uses a valuation ratio, the proper (and more accurate) relationship is between the logarithm of that ratio and subsequent returns. Note also that we use a 12-year horizon here because that’s the point where the autocorrelation profile of valuations typically drops to zero (see Valuations Non Only Mean-Revert, They Mean-Invert). Correlation with actual subsequent S&P 500 12-year total returns (weakest first): To understand why P/E ratios are relatively poor measures of market valuation, remember that stocks are not a claim on next year’s earnings. They are a claim to a very long stream of future cash flows that will be delivered into the hands of investors over time. Any valuation ratio is just shorthand for a properly detailed discounted cash flow analysis. While earnings are certainly important in generating those future cash flows, they are very poor “sufficient statistics” for the whole long-term stream, because profit margins vary considerably over the economic cycle. Historically, the best sufficient statistics are those that mute variation in profit margins, which is why the cyclically-adjusted P/E (CAPE), Tobin’s Q, revenue, GDP, and corporate gross value-added are progressively more accurate measures. The chart below shows the historical relationship between the ratio of nonfinancial market capitalization to corporate gross value added (MarketCap/GVA) and actual subsequent S&P 500 12-year nominal total returns. To underscore the relationship between price and return, I’ve scaled valuations to correspond to the levels of the S&P 500 that would currently be associated with various levels of subsequent expected market return. The vertical green line shows current valuations. Note that the vast majority of points across history were associated with lower valuations and higher prospective returns (the handful of richer valuations to the right correspond to the 1999-2000 bubble peak). Notably, valuations consistent with prospective 12-year S&P 500 annual total returns of at least 8-10% have been approached or breached during the completion of every market cycle in U.S. history, including those prior to the 1960’s when interest rates regularly visited comparably low levels. Our expectation that present extremes are likely to be resolved by a 40-55% loss in the S&P 500 over the completion of the current market cycle is not a worst-case scenario, but a run-of-the-mill expectation. A truly worst-case scenario would be a secular valuation low, similar to those of 1949 and 1982, which would make “S&P 500” not just a market index but a price target.
The foregoing comments represent the general investment analysis and economic views of the Advisor, and are provided solely for the purpose of information, instruction and discourse. Please see periodic remarks on the Fund Notes and Commentary page for discussion relating specifically to the Hussman Funds and the investment positions of the Funds. --- The foregoing comments represent the general investment analysis and economic views of the Advisor, and are provided solely for the purpose of information, instruction and discourse. Prospectuses for the Hussman Strategic Growth Fund, the Hussman Strategic Total Return Fund, the Hussman Strategic International Fund, and the Hussman Strategic Dividend Value Fund, as well as Fund reports and other information, are available by clicking "The Funds" menu button from any page of this website. |
|||||||||||||||||||||||||
|
For more information about investing in the Hussman Funds, please call us at
1-800-HUSSMAN (1-800-487-7626) 513-326-3551 outside the United States Site and site contents © copyright Hussman Funds. Brief quotations including attribution and a direct link to this site (www.hussmanfunds.com) are authorized. All other rights reserved and actively enforced. Extensive or unattributed reproduction of text or research findings are violations of copyright law. Site design by 1WebsiteDesigners. |