|
|
||||||
|
|

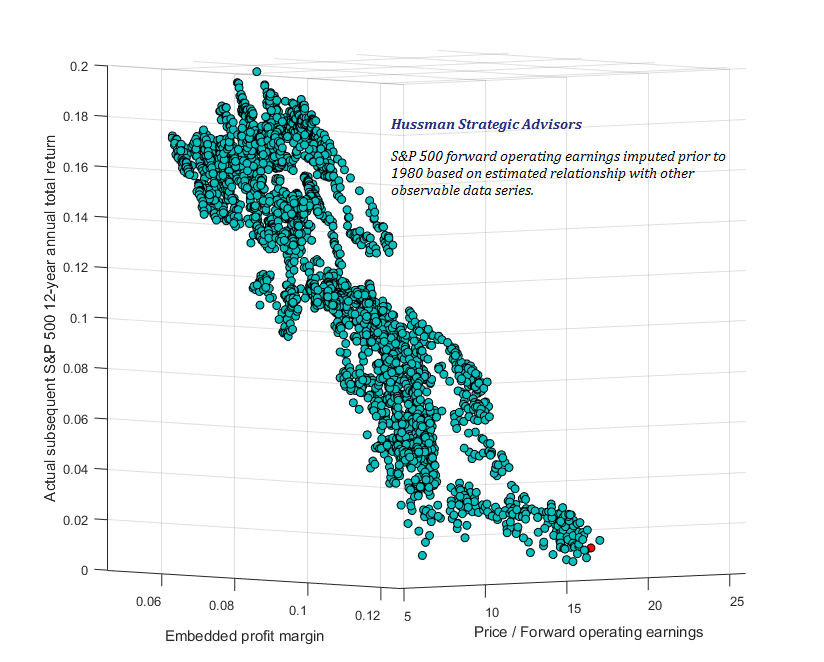
May 15, 2017 Paying Twice Back in September 2007, just before the deepest market collapse since the Great Depression, I observed: “A ‘modestly elevated’ P/E on record earnings at record profit margins is an exorbitant multiple on normalized earnings. Investors will learn this over the complete cycle.” Likewise, early in the 2000-2002 market decline, which would take the S&P 500 down by half, and the tech-heavy Nasdaq 100 down by 83%, I wrote: “price/earnings ratios should not be considered as reliable benchmarks of value here. Over the past decade, many historically reliable benchmarks such as price/revenue, price/book and price/dividend have been discarded as antiquated. Rising profit margins drove earnings out of line with these other fundamentals, and enthusiasm about soaring earnings drove stock prices to fantastically high price/earnings ratios. We are now on the reverse side of this spike.” With regard to the S&P 500 forward operating P/E multiple (based on Wall Street’s estimates of next year’s earnings, excluding expenses labeled as “non-recurring”), I noted near the 2007 peak: “A forward P/E multiple on depressed profit margin assumptions provides at least some margin for error. The same forward P/E based on assumptions of the highest profit margins in history contains no such margin.” Investors are going to learn all of these lessons yet again. When investors pay high P/E multiples on earnings that already reflect cyclically-elevated profit margins, they pay twice for their investment. Stocks are not a claim on next year’s earnings. They are a claim on a very, very, long-term stream of cash flows that will be delivered into the hands of investors in the future. Whatever "fundamental" one uses in a valuation ratio had better be a reliable “sufficient statistic” for expected cash flows that investors will receive decades from now. At a 4% dividend yield and smooth growth in fundamentals over time, nearly 50% of the present value of an investment represents cash flows that will be received more than two decades in the future. At a 2% dividend yield (which is the current dividend yield on the S&P 500), nearly 70% of the present value comes from cash flows that are expected to be received more than 20 years out. The fact is that across history, revenues have been a dramatically better “sufficient statistic” for market-wide cash flows than earnings at any given time. Using a century of data on market cycles across history, it’s rather easy to demonstrate that valuation multiples should be adjusted for the position of profit margins at each point in time. In fact, one can go further and say that valuation multiples based on any arbitrary fundamental “F” should best be adjusted for the position of “F” relative to revenues. Embedded margins Suppose we create a valuation multiple by dividing the S&P 500 by some chosen fundamental “F.” We’ll then call the ratio of “F” to S&P 500 revenues the “embedded margin” of that valuation multiple. If you regress 10-year or 12-year S&P 500 total returns on the log values of P/F and the embedded margin, you’ll discover that the regression coefficients on each are both negative, and are nearly identical. If the embedded margin wasn’t important, it would be given a small or insignificant weight. Almost always, the equation that best explains market returns will give a coefficient on the embedded margin that’s roughly the same as the coefficient on the valuation multiple itself. To see this using a variety of fundamentals including price/earnings, price/forward earnings, price/book value, and the Shiller cyclically-adjusted P/E, see Margins, Multiples, and the Iron Law of Valuation. Why does this happen? Simple. The most reliable “sufficient statistic” for market valuation is actually price/revenue, and the regression will choose weights to reflect that fact, even though other weights could be computed if they were better at projecting subsequent market returns. Using log values is important, because a multiple that’s twice the historical norm has exactly the opposite implication as a multiple that’s half the historical norm, and logarithms properly account for that. Since log(Price/Revenue) = log(Price/F) + log(F/Revenue), even a regression that offers the ability to give different weights to the two components will actually choose the same weights for both, because what really matters is the price/revenue ratio. The chart below gives a 3-dimensional view of the interaction between margins and multiples. The red dot shows present conditions, with the return figure estimated based on the fitted regression of 12-year S&P 500 total returns on the (log) price/forward earnings multiple and the embedded profit margin.
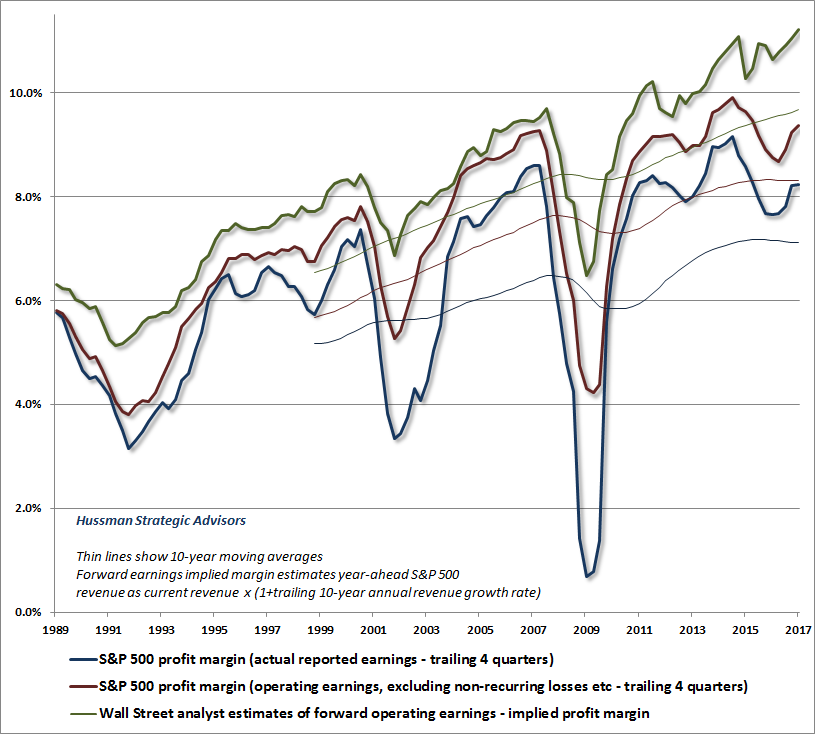
At present, the S&P 500 is trading at a multiple of over 25 times trailing 12-month reported earnings, and is approaching 23 times trailing 12-month operating earnings. Given current elevated margins, these are nose-bleed multiples, but Wall Street continues to encourage investors to look ahead at analyst estimates of “forward” operating earnings, where multiples appear more tolerable. Unfortunately, investors don’t recognize that analysts systematically over-estimate forward earnings, and conflate historical norms for trailing reported P/E multiples as if they can be applied to the far higher values of forward operating earnings. It’s like quoting a valuation multiple of “17” without clarifying that the unit of measurement is gold bars instead of dollars. The chart below shows how elevated Wall Street’s assumptions for future operating profit margins have become. The profit margins embedded into current “forward operating earnings” estimates (green) are easily at the highest level in history.
Now, as I detailed last week, there’s a reason why profit margins actually peaked two years ago, and it is that real unit labor costs reached a trough, and have now started to increase given the reduced slack in the labor market. Still, it’s important to recognize that our primary concern is not whether profit margins will “mean revert” over the next few years. The real problem is that elevated margins are encouraging investors to overpay for cash flows that will be received decades and decades from now. Moreover, even in the face of fluctuations in the level of profit margins in recent cycles, there has been no deterioration at all in the mapping between margin-adjusted valuation measures and actual subsequent market outcomes. That should tell investors that margin-adjustment matters, but the human impulse to ignore inconvenient evidence is just as strong today as it was in 2000 and 2007. When we use historical relationships to impute forward operating earnings data across history, we find that the average implied profit margin for this measure is 8.2%. Likewise, the 10-year average profit margin for actual trailing operating earnings is also 8.2%. The pre-bubble norm for forward operating margins was slightly lower, at 7.8%. So ask this question: what would the history of forward operating P/E multiples look like if we simply imposed a maximum profit margin of 8.2% (which is equivalent to imposing an assumption that extreme margins are unlikely to be permanent)? The chart below places the current answer in a historical context.
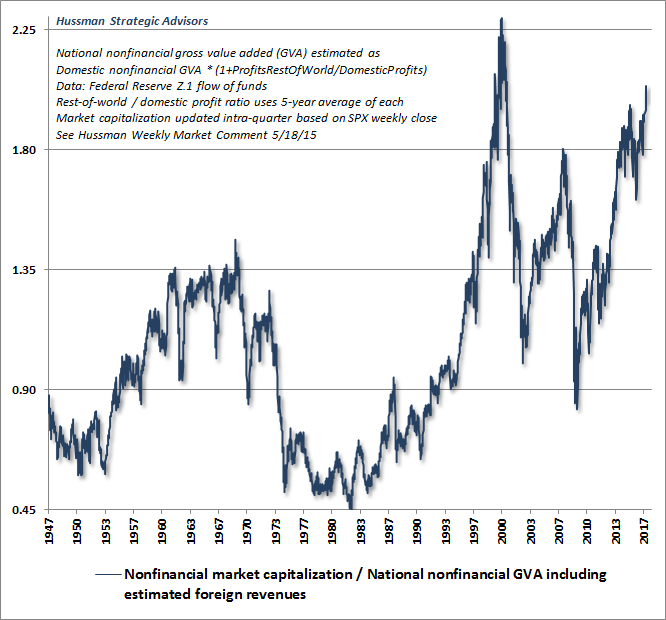
The quiet assumption The most reliable apples-to-apples valuation measure we’ve developed over time is the ratio of non-financial market capitalization to corporate gross value-added (including estimated foreign revenues). This is essentially a big, economy-wide equity market price/revenue ratio, and the correlation between log (MarketCap/GVA) and actual subsequent 10-12 year S&P 500 total returns is over 90%. That doesn’t say much over shorter segments of the market cycle, where the primary driver of returns is the inclination or aversion of investors toward risk and speculation, but no market cycle in history, including recent ones, has failed to take this measure to roughly half of its current level, or lower, over the completion of that cycle. Before investors reject the potential for valuations to ever even briefly restore historical norms, they should note that even the most recent cycles have brought valuations toward or below those norms. Rejecting the possibility of a major market loss from current valuations requires more than the assumption that profit margins will remain high and interest rates will remain low. It requires the additional quiet assumption that market cycles have been eliminated.
The following point is worth emphasizing. Critics of our valuation approach (which has repeatedly been validated over the course of prior complete market cycles) often mistakenly believe that we become concerned about high profit margins at market highs because we expect prices to fall when earnings do. But that’s not our concern at all. Our concern isn’t about what margins or earnings will do a few years from now. Indeed, the correlation between year-over-year changes in earnings and year-over-year changes in the S&P 500 is roughly zero. Rather, our concern is that using cyclically-elevated profits as a basis for market valuation repeatedly causes investors to overpay for cash flows that will arrive decades from now but that represent the majority of what they are actually buying when they invest. Worse, the tendency of investors drive the market to extreme valuations in periods of strong earnings is repeatedly punished over the completion of the market cycle - even if profit margins don’t durably “mean revert” over the same horizon. Investors are paying twice for the value they receive. Over the completion of this market cycle, they are likely to discover, once again, that they could have obtained the same long-term cash flows by only paying once.The foregoing comments represent the general investment analysis and economic views of the Advisor, and are provided solely for the purpose of information, instruction and discourse. Please see periodic remarks on the Fund Notes and Commentary page for discussion relating specifically to the Hussman Funds and the investment positions of the Funds. --- The foregoing comments represent the general investment analysis and economic views of the Advisor, and are provided solely for the purpose of information, instruction and discourse. Prospectuses for the Hussman Strategic Growth Fund, the Hussman Strategic Total Return Fund, the Hussman Strategic International Fund, and the Hussman Strategic Dividend Value Fund, as well as Fund reports and other information, are available by clicking "The Funds" menu button from any page of this website. |
|||||||||||||||||||||||||
|
For more information about investing in the Hussman Funds, please call us at
1-800-HUSSMAN (1-800-487-7626) 513-326-3551 outside the United States Site and site contents © copyright Hussman Funds. Brief quotations including attribution and a direct link to this site (www.hussmanfunds.com) are authorized. All other rights reserved and actively enforced. Extensive or unattributed reproduction of text or research findings are violations of copyright law. Site design by 1WebsiteDesigners. |