
|
|
||||||
|
|

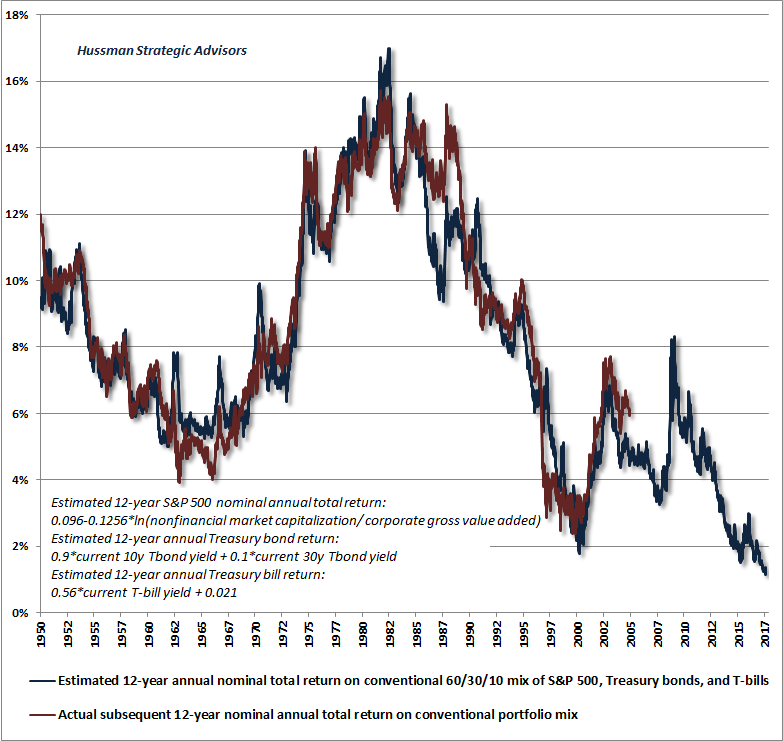
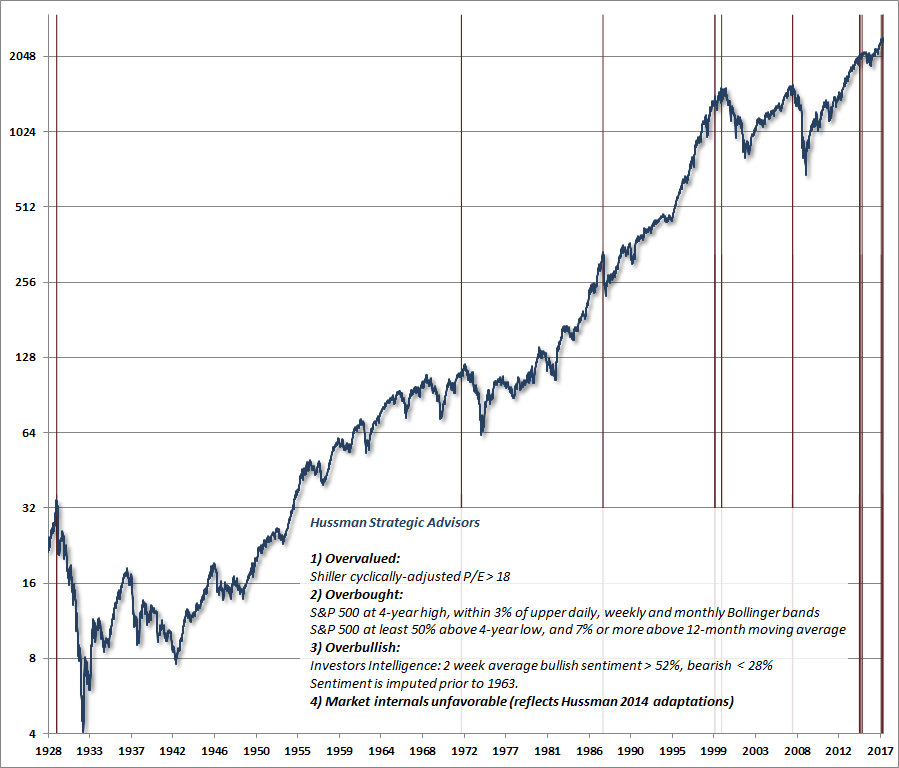
July 24, 2017 Salient Features of Bull Market Peaks Last week, the S&P 500 price/revenue ratio reached the highest level in history, outside of the single week of March 24, 2000 that represented the peak of the tech bubble. Meanwhile, the 30-day CBOE volatility index (largely reflecting the level of fear or complacency among option traders) dropped to a record low, as bullish sentiment surged to 57.8% bulls versus 16.7% bears (Investors Intelligence), and the S&P 500 pushed to its upper Bollinger bands (two standard deviations above a 20-period moving average) on daily, weekly, and monthly resolutions. Today’s offensive valuations establish the likelihood of zero or negative S&P 500 total returns over the coming 10-12 year horizon, and steep interim market losses over the completion of the current market cycle, but those are long-term and full-cycle considerations. From the standpoint of shorter segments of the market cycle, it’s equally important that aside from wicked market overvaluation and the most extreme overvalued, overbought, overbullish syndromes we identify, we also continue to observe dispersion across our measures of market internals (which we use to infer changes in the inclination of investors toward speculation or risk-aversion). I’ve extensively detailed how the Federal Reserve’s deranged pursuit of zero interest rates in the recent half-cycle disrupted the historical reliability of “overvalued, overbought, overbullish” syndromes as sufficient indicators of imminent, steep, and abrupt market declines. In the presence of zero interest rates, one had to wait for market internals to deteriorate explicitly, before adopting a hard-negative outlook. See When Valuations Don’t Seem to “Work” for a review of that narrative, the challenges it created for us in the recent half-cycle, and how we adapted. Take a moment to review the chart that appeared at the bottom of that commentary. The only addition to that chart is that the S&P 500 has now extended this advance enough to reach its upper Bollinger bands at daily, weekly, and monthly resolutions. There are many conditions that differ at various market peaks across history, including the behavior of interest rates, economic measures, inflation and other factors. For example, core inflation was just 2% and falling at both the 2000 and 2007 peaks. Credit spreads were low and falling at the 1966, 1972, and 1987 market peaks. We do find that rising credit spreads are among the conditions that generally accompany recessions, but they can emerge well after the stock market sets its high. Indeed, even for bear markets that are associated with recessions, convincing evidence of a recession typically does not emerge until well into those declines. Given various factors that are observable at each point in time, the central question is always whether they are salient, in the sense that they project outward, modifying or dominating other conditions enough to systematically affect subsequent market outcomes. We know, for example, that low interest rates and Fed easing are actually salient only to the extent that they are consistent with the behavior of market internals (see When Fed Easing Helps Stocks, and When It Doesn’t. When market internals are uniformly favorable across a broad range of securities and asset classes, Fed easing strongly amplifies the bullish tendencies of the market, particularly when valuations are favorable, or "overvalued, overbought, overbullish" syndromes are absent. By contrast, as long as market internals remain uniformly favorable, even Fed tightening is associated with market gains, on average. Conversely, when market internals are unfavorable or feature internal dispersion, as they did through 2000-2002 and 2007-2009 market collapses, even the most aggressive and persistent easing by the Fed does not support stocks. Indeed, when market internals are uniformly unfavorable, market losses are worse when the Fed is easing than when it is not. The explanation for the market’s conditional response to Fed easing is straightforward. Uniformly favorable market internals are a signal that investors are inclined to speculate and accept market risk. In that environment, low-interest liquidity is viewed by investors as an inferior asset and a “hot potato.” Creating a larger pool of these inferior assets contributes to even greater yield-seeking speculation. In contrast, as investors ought to remember from 2000-2002 and 2007-2009, once investors become risk-averse, low-interest liquidity is viewed as a desirable asset. In a risk-averse environment, creating safe, low-yielding liquidity is quite welcome, but does nothing to encourage risk-seeking behavior. In fact, the market experiences particularly steep losses when the Fed eases during “risk-off” conditions, because that easing is typically a response to ongoing economic deterioration. In recent years, the interplay between Federal Reserve’s deranged zero-interest rate policies and investor risk-preferences has created a race to extremes from the standpoint of valuations, and a race to the bottom from the standpoint of future return/risk prospects for the financial markets. Our estimates of prospective 12-year total returns on a conventional mix of 60% S&P 500, 30% Treasury bonds, and 10% Treasury bills fell to the lowest level in history last week (chart below), reflecting the third financial bubble since 2000, with the broadest scope of any speculative episode in U.S. history.
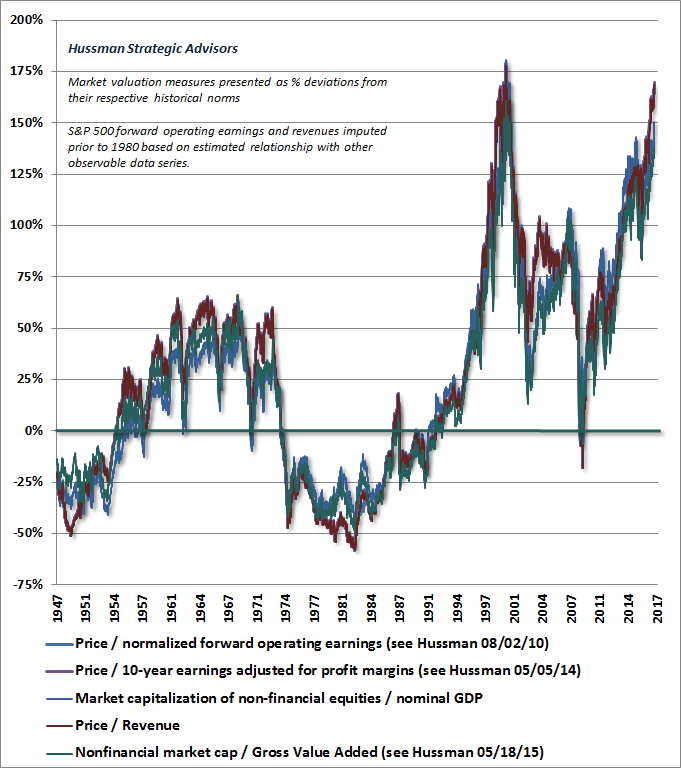
There is no evidence that the Federal Reserve’s creation of trillions of dollars of zero-interest base money did anything to stimulate the economy in recent years. Indeed, the trajectory of the economy since 2009 has been no better than the path that could have been projected based strictly on prior values of non-monetary variables (See Failed Transmission: Evidence on the Futility of Activist Fed Policy). The main effect of the Federal Reserve was to intensify the speculative inclinations of investors by recklessly pouring fuel over a frantic, yield-seeking blaze. It is a terrible mistake to ignore the current status of market internals, particularly in extremely overvalued (or undervalued) market conditions, because the response of the market to Fed easing or tightening is strongly determined by whether investors are inclined toward speculation or risk-aversion at the time. Again, our very challenging lesson in the recent half cycle was that in the face of unprecedented zero interest rate policies, even extreme “overvalued, overbought, overbullish” syndromes (which had been reliable in prior market cycles across history) didn’t matter either. In the presence of zero interest rates, one had to wait for market internals to deteriorate explicitly before adopting a hard-negative outlook. The half-cycle since 2009 would have been dramatically different for us with that single adaptation. But to ignore the present combination of offensive market valuations, extreme overvalued, overbought, overbullish syndromes, and already unfavorable market internals, is to entirely ignore the central lesson of this half-cycle, to ignore the ineffectiveness of Fed easing during 2000-2002 and 2007-2009, and to instead assume that market cycles have simply been repealed. Examine your exposure to market risk On the measures we find most tightly correlated with actual subsequent market returns across history (see the table in Exhaustion Gaps and the Fear of Missing Out for a comparison of the reliability of numerous alternative measures), the S&P 500 is now between 150% and 170% above valuation norms that have been approached or breached over the completion of every market cycle in history, including the most recent one. Allowing for a lesser retreat ending about 25% above those norms (which is the largest distance ever remaining by the completion of any cycle across history, even those associated with quite low interest rates), we fully expect the S&P 500 Index to lose between 50-63% as this speculative episode unwinds. The midpoint of that range is about 56% below present level of the S&P 500, about 53% below the 2016 high, about 50% below the 2015 high, and about 49% below the 2014 high. Do investors really imagine that any of the market gains in recent years will have made a difference by the completion of this cycle? There is a distinction between transient returns and durable returns that are actually retained by investors over the complete cycle. A central lesson of value-conscious investing, validated across the entirety of market history, is that durable market gains are associated with market advances toward historically normal valuations, while advances that move beyond historically normal valuations are nearly always transient (see Durable Returns, Transient Returns for a reminder of how this works). As I observed in 2007, once extreme valuations are established, a full-cycle perspective becomes essential, and the market becomes ultimately very forgiving of early exit. Recall that the 2000-2002 decline wiped out the entire total return achieved by the S&P 500, in excess of Treasury bills, all the way back to May 1996, while the 2007-2009 decline wiped out the market's entire total return, in excess of Treasury bills, all the way back to June 1995. Just as in 2000 and 2007, the fear of missing out may be keeping investors from taking actions to bring their exposure to market risk in line with their true risk tolerance and capacity for loss. Investors should think carefully, now, about their true investment horizon and their willingness to maintain a passive discipline should severe interim market losses emerge in the coming years, on the way to zero or negative overall 10-12 year market returns.
The salient features that have accompanied the most extreme peaks in the U.S. stock market across history, and the steepest subsequent losses, are already in place. These include offensive valuations on historically reliable measures, lopsided bullish sentiment, deteriorating uniformity across market internals (indicating a subtle shift toward increasing risk aversion among some classes of investors), and overextended market action (with the S&P 500 at record highs, pushing to upper Bollinger bands at daily, weekly, and monthly resolutions). The confluence of these salient conditions does not prevent further speculative extremes, and it always remains possible that the uniformity of market internals will improve in a way that signals a fresh willingness among investors to embrace risk and further extend this speculative episode. In the meantime, however, our value-conscious, historically-informed, full-cycle investment discipline provides us with no basis to join that speculation. We don’t rely on a market peak here, but we see every reason to view an abrupt conclusion of this advancing half-cycle as probable, even imminent, and no salient reason to rule it out. The fundamental instabilities are already present, like open buckets of gasoline in an explosives warehouse. So called “catalysts” often become evident only after the fact, and sometimes remain obscure, as they did in 1987. A few side notes. We also observe other features that are consistent but certainly not necessary for a market peak. These include a log-periodic Sornette-type structure that will reach its estimated “finite-time singularity” as early as this week (see Wrecking Ball for a recent chart, and Sornette’s book Why Stock Markets Crash for mathematical detail). I’ll emphasize again that Sornette’s work does not incorporate fundamentals, and is based purely on a mathematical “log-periodic power-law” structure. While speculative bubbles across many markets and countries have fit that structure well, we track Sornette’s approach only for informational purposes, and the analysis does not drive our own discipline. The last such structure was in late-2013/early-2014, which turned out to be an “inflection point” that marked the cyclical peak in year-over-year momentum, but not in price. What makes the current structure interesting here is mainly that it overlaps extremes in our own work. I’ve also been asked to comment on a recent paper analyzing the Shiller cyclically-adjusted P/E, which proposes an elaborate statistical method to form projections of expected market returns. Specifically, the approach fits an unrestricted 60-parameter vector autoregression, which further embeds a 12-parameter inflation model, ignores the impact of embedded profit margins, and after all that, underperforms the projections that one could obtain simply by using the ratio of nonfinancial market capitalization to corporate gross value added (MarketCap/GVA) with no regressions or fitted parameters whatsoever. I suspect that this description is sufficient to convey my reservations about this particular method. That’s no slight to the researchers. It’s just that we know that the Shiller CAPE, despite the 10-year averaging of earnings, is still sensitive to the embedded profit margin (the denominator of the Shiller P/E divided by S&P 500 revenues), and that accounting for that embedded margin clearly improves the correlation of the CAPE with actual subsequent market returns (See Margins, Multiples and the Iron Law of Valuation), without any need to fit scores of parameters. On that note, it’s worth noting that the Shiller CAPE reached 30 last week, which places current valuations among the highest 3% of historical observations, on that particular measure. In reality, however, the situation is much more extreme. While some observers take solace in the fact that the CAPE reached a much higher level of 44 at the 2000 bubble peak, that historical comparison ignores the embedded margin. See, at the 2000 peak, the embedded margin of the CAPE was just 5.1%, compared with a historical norm of 5.4%. At present, because of depressed wages and high profit margins in recent years (which are now reversing given a 4.4% unemployment rate), the CAPE quietly embeds a profit margin of 7.2%. Put another way, investors are currently paying a very high multiple of a very high earnings number that quietly benefits from cyclically elevated profit margins. On the basis of normalized profit margins (an adjustment that improves historical reliability), the normalized CAPE would presently be 40. There is only a single week in history where the normalized CAPE was higher. That was the week of March 24, 2000, when the S&P 500 hit its final bubble peak, at a normalized CAPE of 41.The foregoing comments represent the general investment analysis and economic views of the Advisor, and are provided solely for the purpose of information, instruction and discourse. Please see periodic remarks on the Fund Notes and Commentary page for discussion relating specifically to the Hussman Funds and the investment positions of the Funds. --- The foregoing comments represent the general investment analysis and economic views of the Advisor, and are provided solely for the purpose of information, instruction and discourse. Prospectuses for the Hussman Strategic Growth Fund, the Hussman Strategic Total Return Fund, the Hussman Strategic International Fund, and the Hussman Strategic Dividend Value Fund, as well as Fund reports and other information, are available by clicking "The Funds" menu button from any page of this website. |
|||||||||||||||||||||||||
|
For more information about investing in the Hussman Funds, please call us at
1-800-HUSSMAN (1-800-487-7626) 513-326-3551 outside the United States Site and site contents © copyright Hussman Funds. Brief quotations including attribution and a direct link to this site (www.hussmanfunds.com) are authorized. All other rights reserved and actively enforced. Extensive or unattributed reproduction of text or research findings are violations of copyright law. Site design by 1WebsiteDesigners. |

