|
|
||||||
|
|

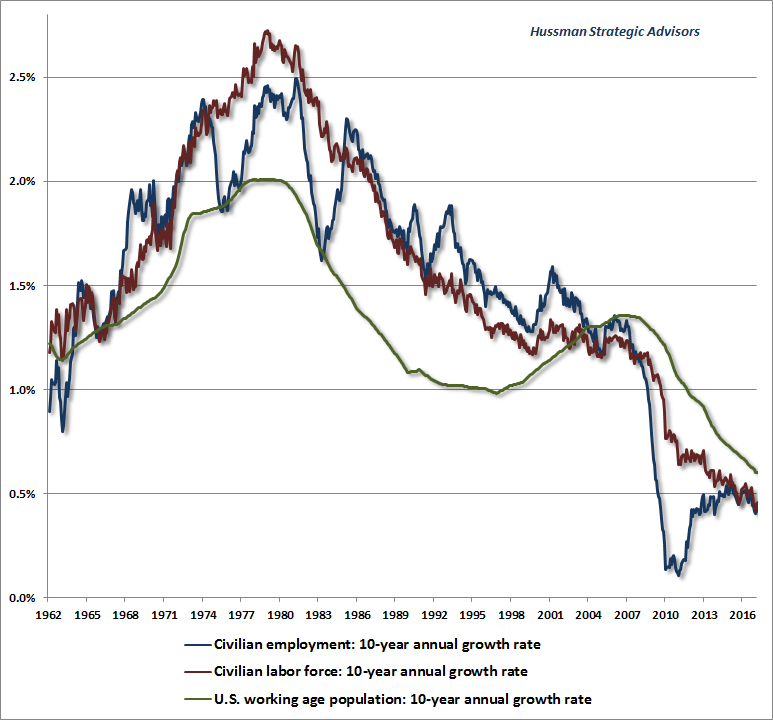
August 21, 2017 Imaginary Growth Assumptions and the Steep Adjustment Ahead Over the next several years, investors are likely to face a profound and unpleasant downward adjustment in their assumptions about growth; GDP growth, revenue growth, earnings growth, and growth in their own investments. Given that the most historically reliable measures of market valuation we identify (those best correlated with actual subsequent S&P 500 total returns) already range between 140% and 170% above their historical norms, this adjustment in growth assumptions is likely to be accompanied by one of the most violent market declines in U.S. history, even if interest rates remain depressed. The argument that rich valuations are “justified” by low interest rates rests on the assumption that future cash flows, and their growth rates, are held unchanged. For example, if interest rates are expected to be held 3% below their norms for a full decade, but revenues and cash flows are expected to grow at historically normal rates, then the way to lower future expected equity returns to “compete” with those lower interest rates (because that’s what happens when valuations are elevated) is to raise valuations about 30% above their own historical norms (3% x 10 years). You can demonstrate this to yourself using any discounted cash flow approach. Now, the historical fact is that prospective equity returns don’t have any such one-to-one correlation with interest rates, and the correlation actually goes the entirely wrong direction outside of the inflation-deflation cycle from 1970 to about 1997. But if one insists that low interest rates should justify elevated stock valuations, and that future economic and corporate growth rates will match their post-war norms, we can happily concede that 30% of the current 140-170% premium over historical norms may be “justified.” The problem is that if interest rates are lower because likely future nominal growth in deliverable cash flows is also lower, then no valuation premium is justified at all. Again, investors can demonstrate this to themselves using any discounted cash flow method. Though we aren’t great fans of infinite growth models, the easiest one is certainly the Gordon growth model: P = D/(i-g), where one can easily observe that a simultaneous reduction in both (i) and (g) will leave the valuation multiple (P/D) unchanged, yet will leave you with lower future expected returns anyway. Recall that U.S. real GDP growth is driven by the sum of two factors: growth in employment (the number of workers) and growth in productivity (output per worker). Based on demographic factors such as population growth and labor participation rates across an aging workforce, combined with an unemployment rate that already stands at just 4.3%, the employment contribution to GDP growth is likely to average just 0.3% annually over the coming 7 years; a small fraction of the post-war growth rate. On the productivity side, U.S. productivity has persistently slowed from a post-war average of just over 2% annually, to just 1% over the past decade and only 0.6% over the past 5 years. That leaves the baseline expectation for real GDP growth, even in the absence of a U.S. recession, at just 0.9% annually. The following charts illustrate these trends. Note the persistent slowing in the contribution to real GDP from labor force growth in recent decades.
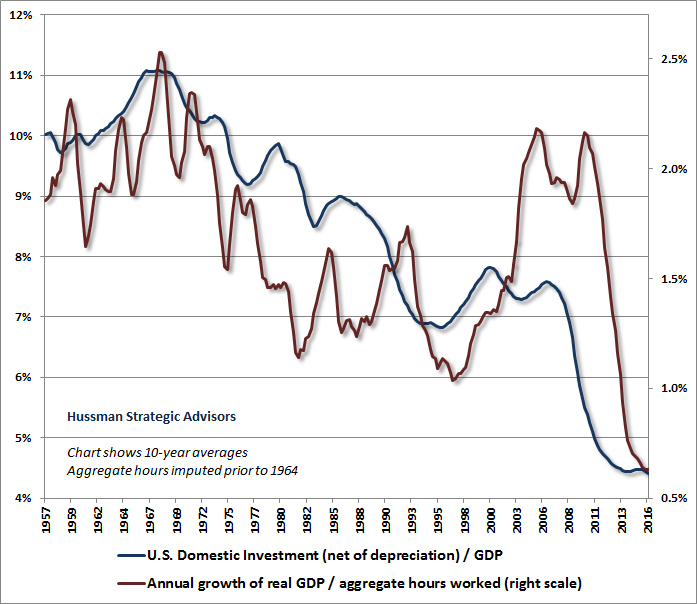
On the productivity front, booms in U.S. productivity are typically paced by growth in capital expenditures and other domestic investment. As a historical regularity related to the savings-investment balance, booms in domestic investment invariably emerge from an initial position of balance or surplus in the U.S. trade balance. Given the deep deficit at present, such a boom is not likely forthcoming. For more on these relationships, see Stalling Engines: The Outlook for U.S. Economic Growth.
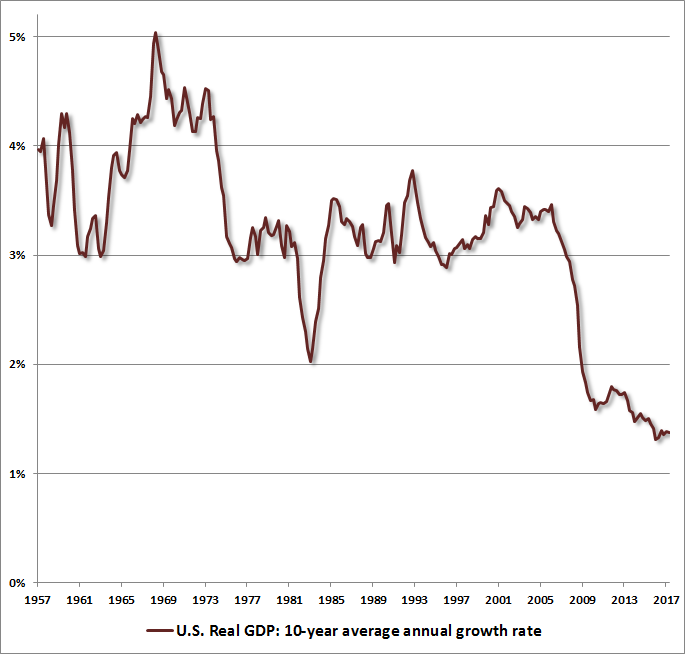
The slowing of U.S. labor force growth, coupled with a gradual and persistent slowing in productivity growth, has combined produce a persistent slowing in the rate of potential and actual U.S. real GDP growth.
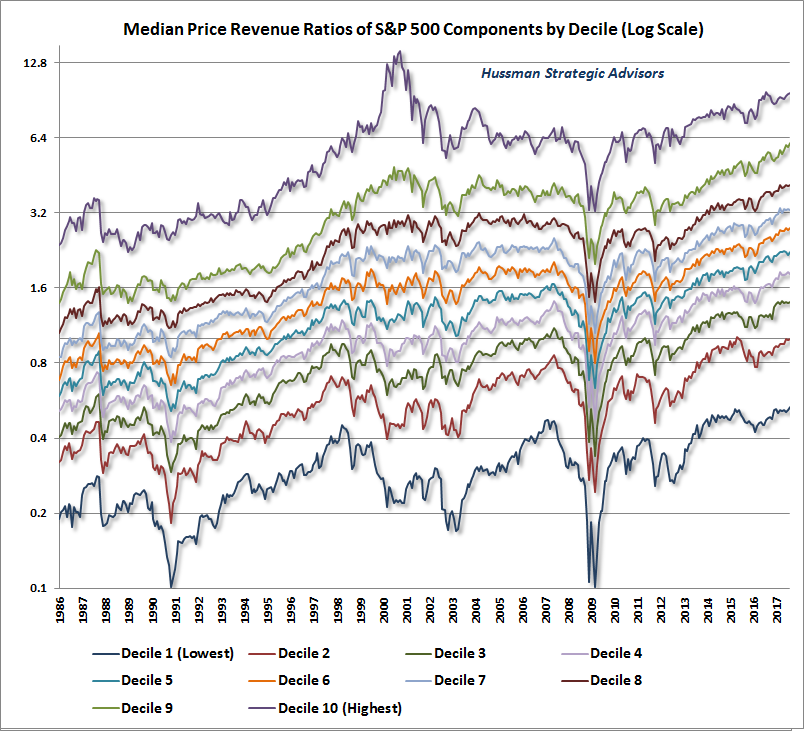
As for the notion of a productivity boom fueled by the tax-advantaged repatriation of U.S. corporate earnings held abroad, recall that the U.S. actually tried this in 2004, and nothing of the sort resulted. Indeed, the primary beneficiaries actually reduced research spending and cut payrolls. Is anyone really so naive to imagine that these balances are not already fully available to finance new investments by U.S. companies here? Do they think the global financial system is that unsophisticated? At present interest rate levels, a company needs only to issue debt at favorable rates in the U.S., invest the funds held abroad at floating rates, enter a fixed-floating interest rate swap, and voila, the company has access to the funds exactly as if they had been brought home. Indeed, this is just what many U.S. corporations appear to have done. So cry me some crocodile tears for companies that hold profits abroad. In my view, U.S. companies should be able to repatriate profits in a tax-advantaged way only to the extent that their actual spending on capital investments, R&D and labor compensation exceeds their own 3-year average. As a side note, don’t imagine that people who talk about stock valuations “after you subtract out the cash” have any idea what they are talking about. One cannot subtract out excess cash if debt has increased to a similar extent. Otherwise, a company could lower its level of valuation simply by issuing a boatload of debt and holding the proceeds in a bank account. The fact is that U.S. nonfinancial corporate debt, ex-cash, has never been higher, either in absolute terms or as a ratio to revenues. With regard to corporate revenues, from 1947 to 2000, the growth rate of S&P 500 revenues and earnings averaged over 6% annually. Indeed, including estimated foreign revenues, the gross value added of U.S. nonfinancial companies grew at a rate of nearly 7.6% annually. But like U.S. real GDP, those growth rates have also slowed dramatically over time. Indeed, nominal S&P 500 revenues have grown at a rate of just 2.7% annually since 2000, with 3.5% growth in nonfinancial GVA even including estimated foreign revenues. Over the most recent 10-year and 5-year periods, those rates have slowed even further, to an average nominal growth rate of scarcely 2% annually. That’s why, despite an expansion to near-record profit margins, S&P 500 reported earnings have grown at a rate of just 4% annually since 2000, and just 1.7% annually over the past decade. It’s only the hypervaluation of equities, and growth measurements focused on trough-to-peak movements, that provide investors the illusion that growth in economic and corporate fundamentals has been more rapid. Finally, with respect to earnings, I’ve noted that most of the fluctuation in U.S. corporate profit margins over time is closely linked to the difference between U.S. productivity growth and real wage growth (or equivalently, between growth in unit labor costs and growth in the GDP deflator). See This Time is Not Different, Because This Time is Always Different for more detail on these relationships. With the unemployment rate now down to 4.3%, the weak growth in labor compensation that supported the move to record profit margins in this half-cycle has already begun to reverse. Put simply, within a small number of years, investors are likely to discover that they have allowed their assumptions about growth in U.S. GDP, corporate revenues, earnings, and their own investment returns to become radically misaligned with reality, and that Wall Street’s justifications for the present, offensive level of equity market valuations are illusory. Based on outcomes that have systematically followed prior valuation extremes, the accompanying adjustment in expectations is likely to be associated with one of the most violent market declines in U.S. history, even if interest rates remain persistently depressed. Estimating prospective market losses over the completion of this cycle It’s important to note that the following estimates for market losses over the completion of this cycle are not dependent on weakness in future economic growth or corporate revenues. Rather, they reflect the run-of-the-mill outcomes that one would expect from current valuation extremes, based on prior market cycles across history. Again, it’s possible that the level of interest rates will remain quite depressed. But even that outcome would likely be the result of persistently disappointing economic growth. Any discounted cash flow method will inform investors that if interest rates are low because expected growth is also low, no valuation premium is “justified” by that combination. Suffice it to say that I don’t believe that quantitative easing or low interest rates have ushered in a durable change in the relationship between reliable valuation measures and subsequent market returns. In my view, investors are going to lose terribly on the gamble of their financial future that they’ve entrusted to central banks. A few weeks ago, I observed that the price/revenue multiple of the S&P 500 had advanced to the highest point in history, outside of the March 2000 peak of the technology bubble. Moreover, unlike the 2000 valuation extreme, which was particularly concentrated in a single decile dominated by large-cap technology stocks, the current extreme has actually taken the median price/revenue multiple of S&P 500 component stocks more than 50% beyond the 2000 extreme. Ranking S&P 500 components into deciles by their price/revenue multiples, all but the top decile are more overvalued than at the 2000 peak. The chart below shows the same data I presented in Estimating Market Losses at a Speculative Extreme, but on a log scale. Moving one segment higher on this chart represents a doubling of valuations. Moving one segment lower represents a 50% decline. The chart reflects data since 1986. On the most historically reliable valuation measures we identify (those most strongly correlated with actual subsequent market returns), 1992 valuations are about equal to the longer-term historical norms since 1940. Such levels have typically been associated with expected 10-12 year total market returns averaging 10% annually. Present levels imply prospective returns nowhere close to that. Indeed, our estimates of likely 12-year S&P 500 nominal total returns have fallen to just 0.3% annually, with an expected interim loss on the order of -63%.
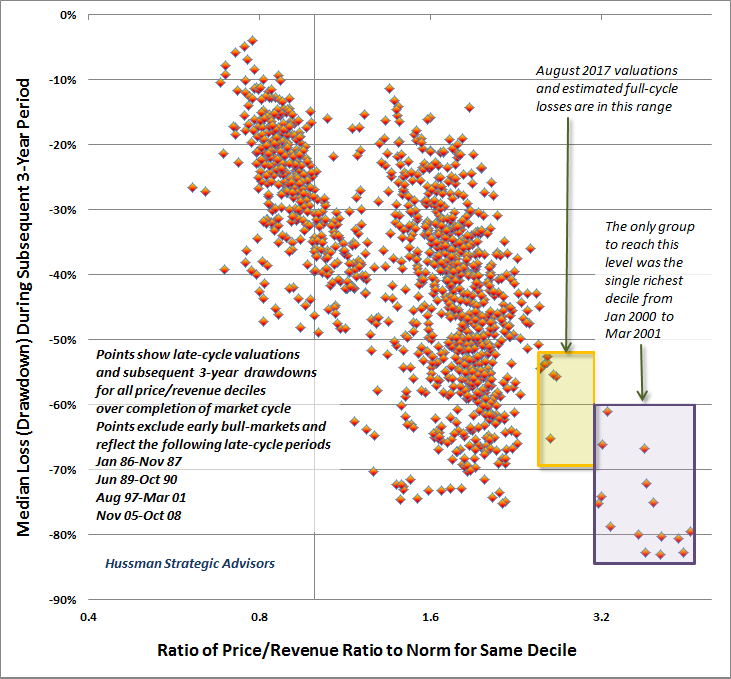
As I noted a few weeks ago, being in a high price/revenue decile doesn’t necessarily imply that a given stock is overvalued, and being in a low decile doesn’t necessarily imply that a given stock is undervalued. Rather, what matters most for the likely subsequent returns and downside risks of each decile is its level of valuation relative to its own respective history. Indeed, when we examine late-stage bull markets, we find that the median drawdown loss of stocks in each decile, over the completion of the market cycle, is largely explained by its level of valuation relative to its own norm. The chart below shows a scatterplot of this relationship. At present, given that every decile is more than double its own norm, there is not a single decile of S&P 500 stocks for which we expect losses of less than -54% over the completion of the current market cycle. For stocks in the richest deciles, our median loss expectation approaches -70%.
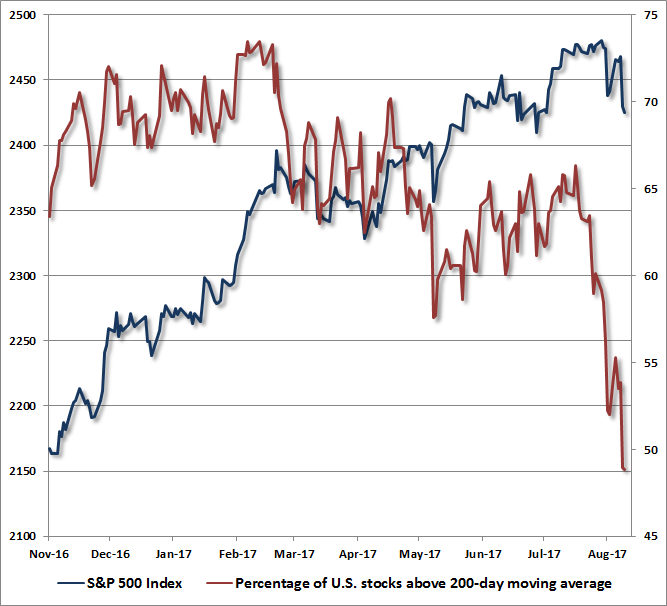
Valuations are highly informative about long-term returns on a 10-12 year horizon, and potential downside risks over the completion of a given market cycle. Alone, however, they are often not informative at all about near-term outcomes over shorter portions of the market cycle. For that, one has to consider the preferences of investors toward speculation or risk-aversion, which we infer from the uniformity or divergence of market internals across a broad range of securities. Notably, not only do investors face obscene valuations, but market internals are presently both unfavorable and deteriorating. This is a critical feature here, because it suggests increasing risk aversion among investors. The signals we extract from market internals aren’t always mirrored in simple, widely-followed measures like moving averages or advance-decline lines. At present, however, the dispersion and deterioration in market internals is no longer subtle, and can be observed in very straightforward ways. For example, as of last week, more than 50% of U.S. stocks have now declined below their respective 200-day moving averages.
Glamour stocks, growth rates, and market penetration Even as an offensively overvalued extreme gives way to deterioration and dispersion in our measures of market internals, we continue to observe a nearly religious faith that the economy has entered a new era; a faith that has no clearer illustration than the exuberance of investors toward a small group of glamour stocks, currently best known by the acronym FAANG (Facebook, Apple, Amazon, Netflix, and Google/Alphabet). This all creates a quite uncomfortable sense of deja vu. On January 8, 2001, after one of many Federal Reserve interest rate cuts that would prove entirely useless in preventing a -50% loss in the S&P 500 and an -83% loss in the tech-heavy Nasdaq 100 by late-2002, I wrote: “Investors haven't learned their lesson. Despite the brutalization of New Economy stocks over the past year, ignorance and greed obey no master. Following the Fed move, investors went straight for the glamour tech stocks... Investors are behaving like an ex-con, whose first impulse after getting out of the joint is to knock over the nearest liquor store... the immediate response of investors to interest rate cuts was to create a two-tiered market. And unfortunately, it's exactly that failing ‘trend uniformity’ that places this advance in danger. Historically, sound market rallies are marked by uniform action across a wide range of sectors. “To illustrate the probable epilogue to the current bubble, we've calculated price targets for some of the glamour techs, based on current revenues per share, multiplied by the median price/revenue ratio over the bull market period 1991-1999. Cisco Systems: $18 3/4, 52-week high: $82 Those projections turned out to be optimistic. As it happened, the 2002 lows for these “four horsemen of the internet” took Cisco to $8.60, Sun to $2.42, EMC to $3.83, and Oracle to $7.32, representing an average loss of -92%. In the late-1960’s, the glamour stocks were instead focused on rapid growth; “-onics” and “tronics” stocks, as well as conglomerates that grew mainly through acquisitions. In 1972, the focus turned back to blue chips - the “one decision” Nifty Fifty stocks that investors believed could be held forever because of their promising growth. Many of these stocks did indeed turn out to enjoy tremendous earnings and revenue growth over the following decades, but that didn’t prevent deep losses in the interim. The names included household names like Du Pont, Eastman Kodak, Exxon, Ford Motor, General Electric, General Motors, Goodyear, IBM, McDonalds, Mobil, Motorola, PepsiCo, Philip Morris, Polaroid, Sears, Sony, and Westinghouse. The fact that these were major companies didn’t prevent this list from losing over -65% of its value in the 1973-74 collapse (even though corporate earnings grew by nearly 70% over the same period) Part of the reason investors repeatedly set themselves up for devastating outcomes in glamour stocks is that they extrapolate past revenue growth as if it will continue forever, failing to recognize that growth rates typically slow dramatically once revenues achieve an enormous base and dominant market penetration. Several years ago, I provided the following analysis, which is increasingly relevant today: “Growth rates are always a declining function of market penetration. Most strikingly, the growth rates begin to come down hard even at the point that a company hits 20-30% market penetration. Network effects accelerate the early growth, but also cause growth to hit the wall more abruptly. Replacement helps to accelerate the early growth rates too, but ultimately has much more effect on the sustainable level of sales than it has on long-term growth. In fact, if the replacement rate (the percentage of existing users that replace their product each year) is less than the adoption rate (the percentage of untapped prospects that are converted to new users), it's very hard to keep the growth rate of sales from falling below the rate of economic growth. “The chart below gives the general picture of various growth curves and the effect that different factors can exert. The paths are less important for their actual growth rates as they are for their general profiles (below, I've assumed that 15% of the untapped market adopts the product each period). It may seem odd that you could get a growth rate below the adoption rate. But notice that with an adoption rate of 15% and a total potential market of 1000 units, for example, you'll sell 150 units the first year, but the next year's sales will only be 15% of the 850 remaining untapped prospects, so growth will actually be negative unless you have other factors contributing, such as discovery, replacement, network effects, and so forth.
“To see how all of this has played out in the actual data for past market darlings, let's take a look at several extraordinary growth companies that can now reasonably be viewed as having reached their "mature" level of market penetration: Microsoft, Cisco, Intel, Oracle, IBM, Dell and Wal-Mart. The chart below presents the combined scatter of historical revenue growth and penetration data for these companies. Again, the key feature is that growth rates are a rapidly decreasing function of market penetration.”
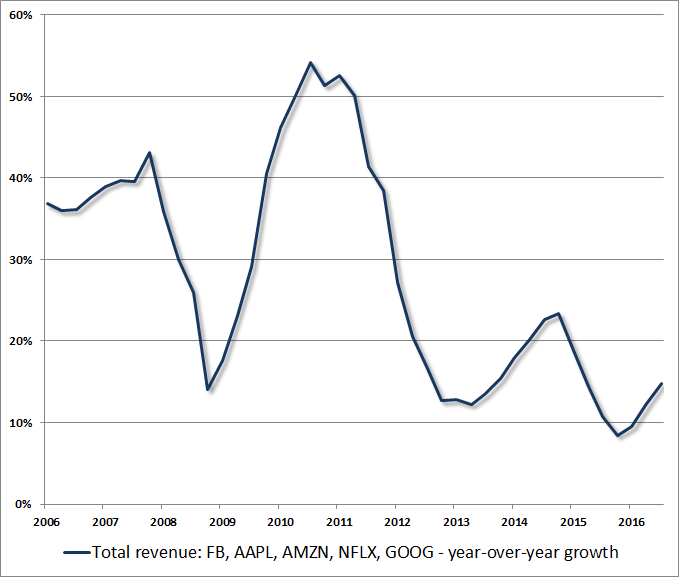
At the time of that analysis (mid-2012), I observed, “We've seen very rapid adoption rates, very high replacement, and very strong network effects in Apple's products. All of this is an extraordinary achievement that reflects Steve Jobs' genius. I suspect, however, that investors observe the rapid adoption and very high recent replacement rate of three very popular but semi-durable products, and don't recognize how improbable it is to maintain these dynamics indefinitely. Despite great near-term prospects, within a small number of years, Apple will have to maintain an extraordinarily high rate of new adoption if replacement rates wane, simply to avoid becoming a no-growth company. That's not a criticism of Apple, it's just a standard feature of growth companies as their market share expands.” Apple’s trailing 12-month revenues indeed peaked in the fourth quarter of 2015, and have contracted since then, contributing to the gradual trend toward slowing revenues across the FAANG group.
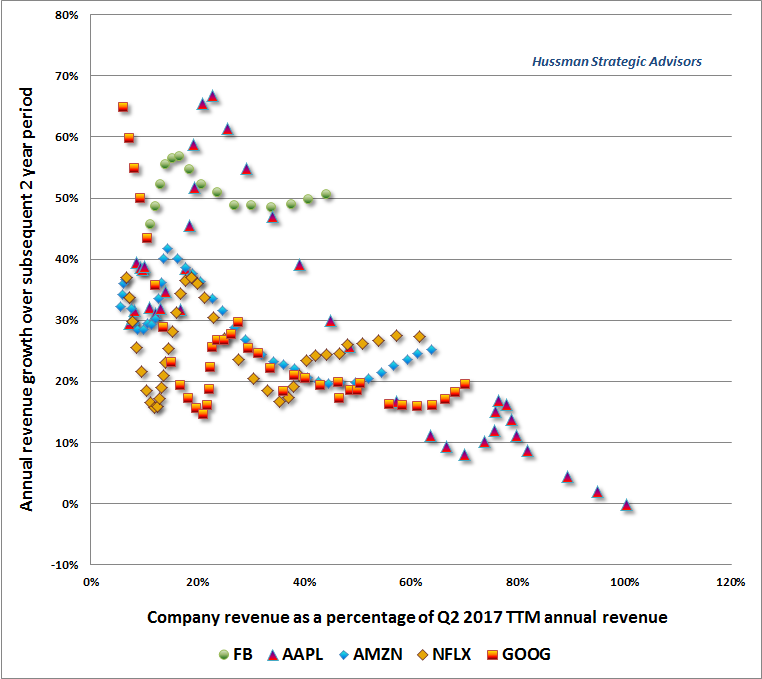
Even for other members of the group, investors should expect growth rates to decline in the same systematic way as they become larger. Notably, Google and Facebook now capture well over half of global online advertising revenue, while the growth rate of online advertising itself has declined from a 30% annual pace a decade ago, to a 14% pace over the past four years, and is projected to decline to an annual rate of less than 10% within a few years. Indeed, the decline may be even more precipitous. As my friend Jesse Felder observes, both Proctor & Gamble and Unilever recently cut their digital advertising spending by 41% and 59%, respectively, with no apparent effect on their business, viewing the spending as “ineffective” and “not facilitating the equity of our brands.” Given the saturation levels that are already reflected in current spending figures, extrapolating past growth rates into the indefinite future is likely to prove a very bad idea. As shown previously for past glamour growth stocks like Microsoft, Cisco, Intel, Oracle, IBM, Dell and Wal-Mart, the chart below demonstrates how growth rates have behaved among FAANG companies. The horizontal axis measures revenues in prior years as a percentage of current trailing 12-month revenues. The vertical axis measures the subsequent growth of revenues over the following 2-year period. As one should expect, growth rates systematically decrease as a function of size and market penetration.
None of this should be taken as an opinion on the FAANG stocks in particular. Rather, my concerns are much broader. Given current valuation extremes, both for the S&P 500 Index itself and across every decile of stocks; given the repeated emergence of the most extreme “overvalued, overbought, overbullish” syndromes we define; and given clearly deteriorating market internals, we estimate extreme downside risk across virtually every corner of the stock market over the completion of the current speculative market cycle. Investors have responded to low interest rates by driving stocks to obscene valuations, with little recognition of their implicit (and incorrect) assumption that economic and corporate growth rates remain unchanged from post-war norms. Wall Street is presently ignoring all evidence that a marked slowing is already well underway, and that the conditions that produced historical rates of economic growth are no longer in place. It is essential to understand that if interest rates are low because the growth rate of cash flows is also low, then no market valuation premium is "justified" at all. In my view, the adjustment in growth expectations is likely to be profound in the coming years. Given current valuation extremes, the associated market losses are likely to be predictably brutal.The foregoing comments represent the general investment analysis and economic views of the Advisor, and are provided solely for the purpose of information, instruction and discourse. Please see periodic remarks on the Fund Notes and Commentary page for discussion relating specifically to the Hussman Funds and the investment positions of the Funds. --- The foregoing comments represent the general investment analysis and economic views of the Advisor, and are provided solely for the purpose of information, instruction and discourse. Prospectuses for the Hussman Strategic Growth Fund, the Hussman Strategic Total Return Fund, the Hussman Strategic International Fund, and the Hussman Strategic Dividend Value Fund, as well as Fund reports and other information, are available by clicking "The Funds" menu button from any page of this website. |
|||||||||||||||||||||||||
|
For more information about investing in the Hussman Funds, please call us at
1-800-HUSSMAN (1-800-487-7626) 513-326-3551 outside the United States Site and site contents © copyright Hussman Funds. Brief quotations including attribution and a direct link to this site (www.hussmanfunds.com) are authorized. All other rights reserved and actively enforced. Extensive or unattributed reproduction of text or research findings are violations of copyright law. Site design by 1WebsiteDesigners. |