|
|
||||||
|
|

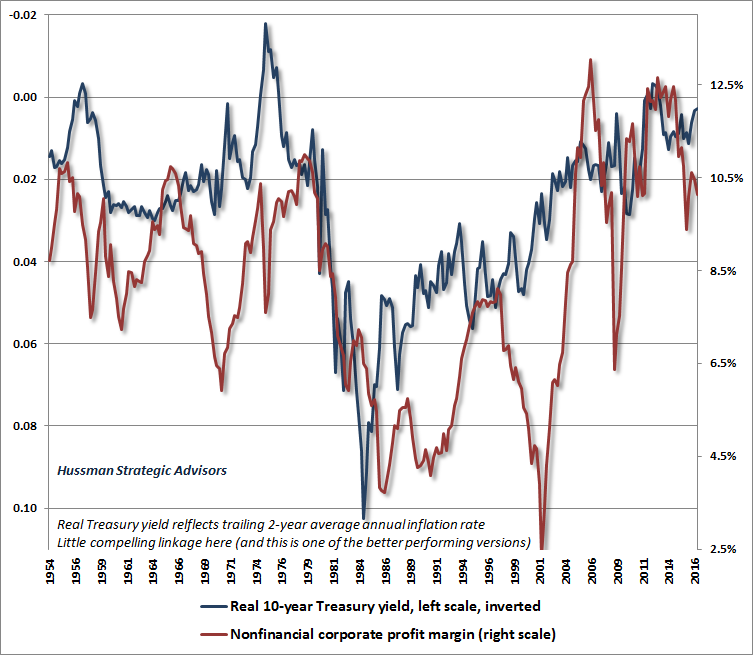
May 8, 2017 This Time is Not Different, Because This Time is Always Different “History repeats - the argument for abandoning prevailing valuation methods regularly emerges late in a bull market, and typically survives until about the second down-leg (or sufficiently hard first leg) of a bear. Such arguments have included the ‘investment company’ and ‘stock scarcity’ arguments in the late 20's, the ‘technology’ and ‘conglomerate’ arguments in the late 60's, the nifty-fifty ‘good stocks always go up’ argument in the early 70's, the ‘globalization’ and ‘leveraged buyout’ arguments in 1987 (and curiously, again today), and the ‘tech revolution’ and ‘knowledge-based economy’ arguments in the late 1990's. Speculative investors regularly create ‘new era’ arguments and valuation metrics to justify their speculation.” - John P. Hussman, Ph.D., New Economy or Unfinished Cycle?, June 18, 2007. The S&P 500 would peak just 2% higher in October of that year, followed by a collapse of more than -55%. “Old ways of valuing stocks are outdated. A technological revolution has created opportunities for continued low inflation, expanding profits and rising productivity. Thanks to these factors, the United States may be able to enjoy an extended period of expanding stock prices. Jumping out now would leave you poorer than you might become if you have some faith.” - Los Angeles Times, May 11, 1999. While it’s tempting to counter that the S&P 500 would rise by more than 12% to its peak 10 months later, it’s easily forgotten that the entire gain was wiped out in the 3 weeks that followed, moving on to a 50% loss for the S&P 500 and an 83% loss for the tech-heavy Nasdaq 100.. “Stock prices returned to record levels yesterday, building on the rally that began in late trading on Wednesday... ‘It’s all real buying’ [said the head of index futures at Shearson Lehman Brothers], ‘The excitement here is unbelievable. It’s steaming.’ The continuing surge in American stock prices has produced a spate of theories. [The] chief economist of Kemper Financial Services Inc. in Chicago argued in a report that, contrary to common opinion, American equities may not be significantly overpriced. For one thing, [he] said, ‘The market may be discounting a far-larger rise in future corporate earnings than most investors realize is possible, [and foreign investment] may be altering the traditional valuation parameters used to determine share-price multiples.’ He added, ‘It is quite possible that we have entered a new era for share price evaluation.’” - The New York Times, August 21, 1987 (the S&P advanced by less than 1% over the next 3 sessions, and then crashed) “The failure of the general market to decline during the past year despite its obvious vulnerability, as well as the emergence of new investment characteristics, has caused investors to believe that the U.S. has entered a new investment era to which the old guidelines no longer apply. Many have now come to believe that market risk is no longer a realistic consideration, while the risk of being underinvested or in cash and missing opportunities exceeds any other.” - Barron’s Magazine, February 3, 1969. The bear market that had already quietly started in late-1968 would take stocks down by more than one-third over the next 18 months, and the S&P 500 Index would stand below its 1968 peak even 14 years later. “The 'new-era' doctrine - that 'good' stocks (or 'blue chips') were sound investments regardless of how high the price paid for them -- was at bottom only a means for rationalizing under the title of 'investment' the well-nigh universal capitulation to the gambling fever.” - Benjamin Graham & David Dodd, Security Analysis, 1934, following the 1929-1932 collapse “The recent collapse is the climax, but not the end, of an exceptionally long, extensive and violent period of inflation in security prices and national, even world-wide, speculative fever. This is the longest period of practically uninterrupted rise in security prices in our history... The psychological illusion upon which it is based, though not essentially new, has been stronger and more widespread than has ever been the case in this country in the past. This illusion is summed up in the phrase ‘the new era.’ The phrase itself is not new. Every period of speculation rediscovers it.” - Business Week, November 1929. The market collapse would ultimately exceed -80%. This time is not different Mark Twain once said “History doesn’t repeat itself, but it does rhyme.” Unfortunately, the failure of history to precisely replicate itself, in every detail, is at the heart of the failure of humanity to learn from it. Each separate instance has its own wrinkles, and within those wrinkles is wrapped the delusion that “this time” is cut from wholly different cloth. In the financial markets, the unique features of “this time” entice investors away from systematic analysis and durable relationships. It eventually becomes enough simply to refer to buzz-words - “investment companies,” “technology,” “globalization,” “conglomerates,” “dot-com,” “leveraged buy-outs,” “quantitative easing” - as a substitute for data and clear-sighted analysis. If doctors behaved like investors do, every time a new strain of virus emerged, they would declare a “new era,” immediately disregarding every known principle of the immune system until everybody was dead. This is emphatically not to say that new changes in the economic or financial environment should be disregarded. The argument is exactly the opposite. When faced with these changes, our obligation as careful investors is to obtain data and quantify, as well as possible, how they reasonably impact the objects we care about, such as long-term cash flows, valuations, and prospective returns. We can’t just take some buzz-word and bandy verbal arguments about, without any analysis at all. We should never abandon our central principles just because we see a squirrel outside the window. If we think the squirrel is important, we have to obtain data and carefully study and quantify how squirrels actually affect the things we care about. We don’t just say, “Ooh, the squirrel has created a new era, so we’re going to ignore everything that history has taught us.” So if we care about how interest rates might impact valuations, we shouldn’t just switch our brains off and talk about low interest rates. We should quantify their effect (see, for example, The Most Broadly Overvalued Moment in Market History). If we think changes in economic policy might affect economic growth, we shouldn’t just toss around figures that pop out of our imagination. We should estimate the potential range of outcomes, given the conditions that systematically determine GDP growth (see Economic Fancies and Basic Arithmetic). If we think the international activity of U.S. corporations has changed traditional valuation relationships, we should explicitly quantify that impact (see The New Era is an Old Story). If we wonder why valuations and subsequent market returns are systematically related even though interest rates aren’t constant, we should work out the arithmetic and examine the historical relationships (see Rarefied Air: Valuations and Subsequent Market Returns). If we wonder whether valuation measures should be corrected for the level of profit margins embedded in those measures, we should collect the data and evaluate the question (see Margins, Multiples, and the Iron Law of Valuation). And if we think that we could be living in a new era of permanently high profit margins, we might want to quantify the evidence before adopting that view (see below). Every episode in history has its own wrinkles. But investors should not use some “new era” argument to dismiss the central principles of investing, as a substitute for carefully quantifying the impact of those wrinkles. Unfortunately, because investors get caught up in concepts, they come to a point in every speculative episode where they ignore the central principles of investing altogether. The allure of those wrinkles is what leads investors to forget the lessons of history, and repeat its tragedies again and again. This time is not different, because this time is always different. Throwing in the towel When a boxer is taking a beating, to avoid further punishment, a towel is sometimes thrown from the corner as a token of defeat. Yet even after the towel is thrown, a judicious referee has the right to toss the towel back into the corner and allow the fight to continue. For decades, Jeremy Grantham, a value investor whom I respect tremendously, has championed the idea, recognized by legendary value investors like Ben Graham, that current profits are a poor measure of long-term cash flows, and that it is essential to adjust earnings-based valuation measures for the position of profit margins relative to their norms. In Grantham’s words, “Profit margins are probably the most mean-reverting series in finance, and if profit margins do not mean-revert, then something has gone badly wrong with capitalism.” He learned this lesson early on, during the collapse that followed the go-go years of the late-1960’s. Grantham once described his epiphany: “I got wiped out personally in 1968, which was the last really crazy, silly stock market before the Internet era... I became a great reader of history books. I was shocked and horrified to discover that I had just learned a lesson that was freely available all the way back to the South Sea Bubble.” In recent weeks, Grantham has essentially thrown in the towel, suggesting “this time is decently different”: “Stock prices are held up by abnormal profit margins, which in turn are produced mainly by lower real rates, the benefits of which are not competed away because of increased monopoly power... In conclusion, there are two important things to carry in your mind: First, the market now and in the past acts as if it believes the current higher levels of profitability are permanent; and second, a regular bear market of 15% to 20% can always occur for any one of many reasons. What I am interested in here is quite different: a more or less permanent move back to, or at least close to, the pre-1997 trends of profitability, interest rates, and pricing. And for that it seems likely that we will have a longer wait than any value manager would like (including me).” I’ve received a flurry of requests for my views on Grantham’s shift. My simple response is to very respectfully toss Grantham’s towel back into the corner. Here’s why. First, Grantham argues that much of the benefit to margins is driven by lower real interest rates. The problem here is two-fold. One is that the relationship between real interest rates and corporate profit margins is extremely tenuous in market cycles across history. Second, the fact is that debt of U.S. corporations as a ratio to revenues is more than double its historical median, leaving total interest costs, relative to corporate revenues, no lower than the post-war norm. With regard to real interest rates, there’s always a question of how one adjusts for inflation, which can involve trailing rates or inflation rates implied by inflation-protected securities. Because inflation has such a strong serial correlation over time, the distinction matters less than one might think, but it typically helps to use a 2-year trailing rate rather than just the past 12 months. The chart below shows the historical relationship between corporate profit margins and real Treasury yields on that basis. Real interest rates are shown in blue on an inverted (left) scale, with profit margins shown in red on the right scale. About the only segment worth mentioning is a short span during the rapid disinflation of the early 1980's. Both Treasury yields and wage inflation fell slower than general prices, so real interest rates, real wage rates, and the U.S. dollar all shot higher (leading to the 1985 Plaza Accord). Aside from that, there’s not much to see here, with no systematic fluctuation between real interest rates and profit margins across economic cycles.
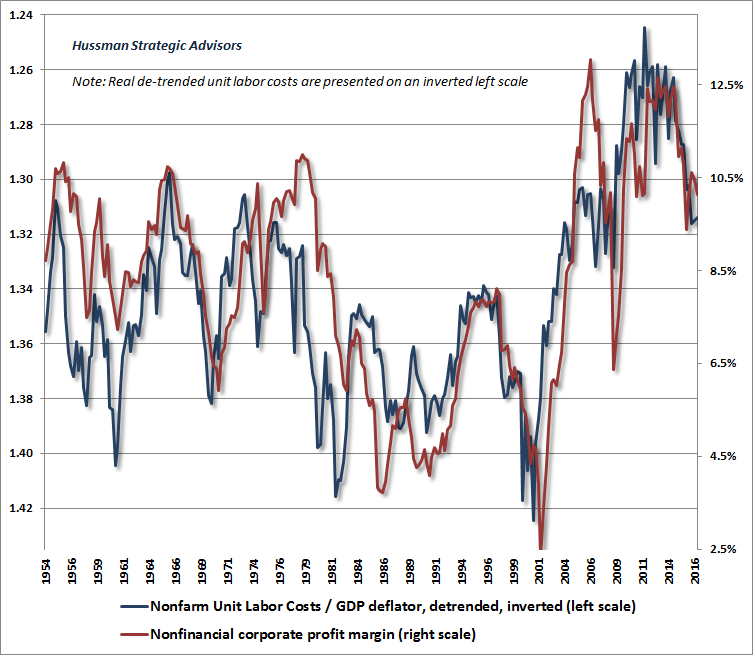
I would argue that what’s really going on with profit margins is quite different than what Grantham suggests. As usual, my views reflect the data. Specifically, the elevation of profit margins in recent years has been a nearly precise reflection of declining labor compensation as a share of output prices. To illustrate this below, I’ve shown real unit labor costs (labor compensation per unit of output, divided by price per unit of output) in blue on an inverted left scale, with profit margins in red on the right scale. Real unit labor costs are de-trended, reflecting the fact that real wage growth has historically lagged productivity growth by about 0.4% annually. Since unit labor costs and the GDP deflator are indexed differently, the left scale values are meaningful on a relative basis, but shouldn't be interpreted as actual fractions.
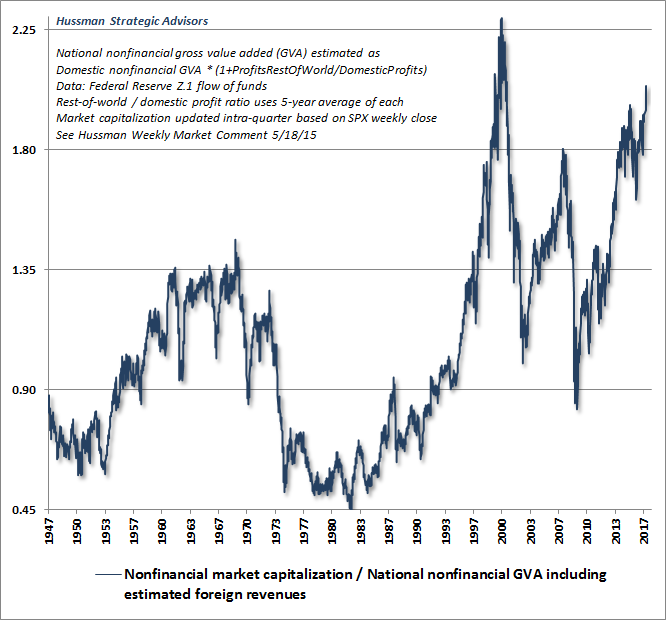
What’s notable here is that the process of profit margin normalization is already underway. Though there will certainly be cyclical fluctuations, this process is likely to continue in an environment where the unemployment rate is now down to 4.4% and demographic constraints are likely to result in labor force growth averaging just 0.3% annually between now and 2024. Total employment will grow at the same rate only if the unemployment rate remains at current levels. That creates a dilemma for profit margins: if economic growth strengthens in a tightening labor market, labor costs are likely to comprise an increasing share of output value, suppressing profit margins. If economic growth weakens, productivity is likely to slow, raising unit labor costs by contracting the denominator. [As a side-note, this analysis links up with the Kalecki profits equation because a depressed wage share is typically associated with weak household savings and high government transfer payments]. It’s tempting to imagine that offshoring labor would allow a sustained below-trend retreat in real unit labor costs. But while foreign labor can be cheaper, the corresponding productivity is also often lower, so the impact on unit labor costs is more nuanced than one might think. So again, with great respect, my response is to encourage Grantham to pick up his towel and lace up his gloves. Even if profit margins have moved forever higher, they are unlikely to have moved to the point where recent highs are the new average. Given that valuations fluctuate around norms that reflect those average margins, valuations are now so obscenely elevated that even an outcome that fluctuates modestly about some new, higher average would easily take the S&P 500 35-40% lower over the completion of the current market cycle. Let’s also be careful to distinguish the level of valuations from the mapping between valuations and subsequent returns. As evidenced below, there’s utterly no evidence that the link between historically reliable valuation measures and actual subsequent market returns has deteriorated in any way during recent cycles. So even if one wishes to assume that future valuation norms will be higher than “old” historical norms, it follows that one should also assume that future market returns will be lower than “old” historical norms. It has taken the third financial bubble in 17 years to bring the total return of the S&P 500 to 4.7% annually since the 2000 peak. Don’t imagine that future returns will be much better from current valuations, even if future valuations maintain current levels forever. Indeed, my actual expectation is that the completion of the current market cycle will wipe out the entire total return of the S&P 500 since 2000. Back to the Iron Laws If we are careful about history, evidence, and market analysis, we repeatedly find that the central principles of investing are captured by a few iron laws. Two of them are particularly important in our discipline. The first of these is what I call the Iron Law of Valuation: Long-term market returns are driven primarily by valuations. Every valuation ratio is just shorthand for a careful discounted cash-flow approach, so the denominator of any valuation ratio had better be a “sufficient statistic” for the likely stream of cash flows that will be delivered to investors over decades. For market-based measures, revenues are substantially more reliable than current earnings or next year’s estimated earnings. A second principle is what I call the Iron Law of Speculation: While valuations determine long-term and full-cycle market outcomes, investor preferences toward speculation, as evidenced by uniformity of market action across a broad range of internals, can allow the market to continue higher over shorter segments of the cycle, despite extreme overvaluation. At rich valuations, one had better monitor those internals explicitly, because deterioration opens the way to collapse. As usual, it’s worth briefly recalling not only the success of our discipline in previous complete market cycles, but also the elephant that I let into the room in 2009. Whatever criticism one might direct toward my shortcomings in the half-cycle since 2009, the fact is this. Our challenges arose from my 2009 insistence on stress-testing our methods against Depression-era data, which inadvertently created a specific vulnerability that should be distinguished from our current outlook. Prior to 2009, overvalued, overbought, overbullish conditions were associated with average market returns below risk-free T-bill returns regardless of whether market internals were favorable or not. But the novelty of the Federal Reserve’s deranged monetary policy response encouraged yield-seeking speculation by investors well after historically reliable “overvalued, overbought, overbullish” conditions appeared. In a zero interest rate environment, one had to wait for explicit deterioration in market internals to signal a weakening of investors’ willingness to speculate, before adopting a hard-negative outlook. Put simply, the methods that emerged from that stress-testing exercise inadequately accounted for the effect of zero interest rate policies on speculation, and that’s why our adaptations have focused primarily on imposing additional requirements related to market internals. In contrast, valuation relationships have remained completely intact in recent cycles, correctly identifying stocks as undervalued in 2009, but wickedly overvalued today. Our current defensiveness is fully consistent with the Iron Laws. With interest rates well off the zero bound and market internals already showing internal dispersion, now is not a time to become complacent, and certainly not a time to throw in the towel. Hoping for greater fools We’ll finish with a review of where the most reliable valuation measures stand, showing their relationship with actual subsequent market returns across history, and over recent market cycles. As I’ve observed before, whatever one proposes as being “different” this time had better be something that suddenly changed in the past 5 years and will persist forever. Undoubtedly, Wall Street will think of something, because as Hegel wrote, “We learn from history that we do not learn from history.” The first chart updates the ratio of nonfinancial market capitalization to corporate gross value-added (including estimated foreign revenues), which we find better correlated with actual subsequent S&P 500 total returns than any other measure we’ve studied over time. Note in particular that no market cycle in history (even recent ones) has failed to take this measure to half of its current level by the completion of the cycle. But if one wishes to rule that possibility out, notice that even the level of 1.35 was observed as recently as 2012, and is about the highest level ever observed in post-war data prior to 1998. A retreat merely to that level over the completion of the current market cycle would involve a loss of one-third of the value of the S&P 500.
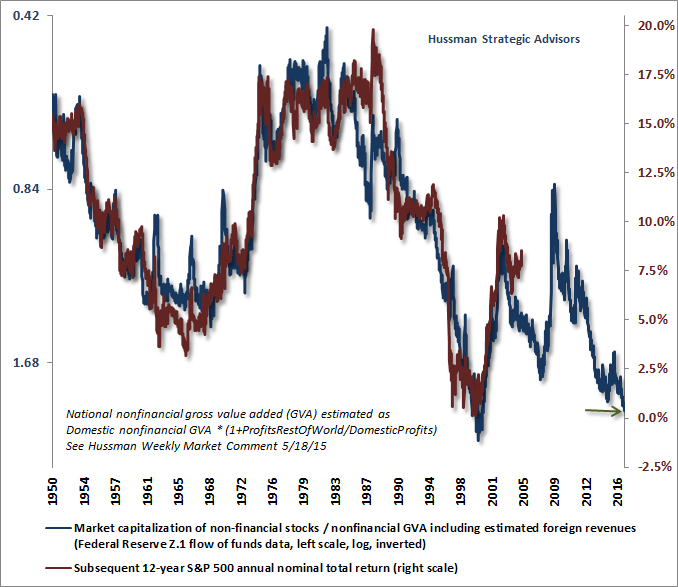
We certainly don’t require a breathtaking market loss in order to adopt a constructive or aggressive market outlook, particularly at the point that a material retreat in valuations is joined by early improvement in market action. Yet investors seem to rule out any material retreat at all. In effect, investors are arguing not only that elevated valuations are justified; they are also quietly assuming that market cycles have been abolished. This is a much larger mistake. The chart below shows MarketCap/GVA on an inverted log scale (left), along with actual subsequent S&P 500 nominal average annual total returns over the following 12-year horizon. Note that the current estimate of near-zero total returns also includes dividends, meaning that we fully expect the S&P 500 Index itself to be lower 12 years from now than it is today.
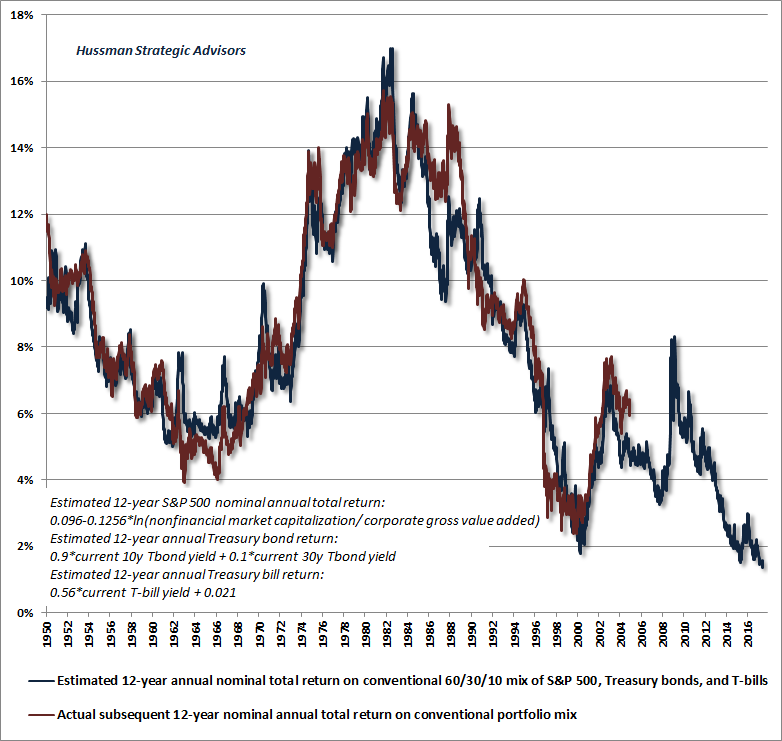
I can’t emphasize enough that the mapping between reliable valuation measures and subsequent market returns is a calculation that does not require adjustment for the level of interest rates. Rather, one uses interest rates for comparative purposes after the expected return calculation is made (see The Most Broadly Overvalued Moment In Market History to understand this distinction). While investors seem to look at low interest rates as if they are a good thing, what low interest rates really do here is to lock passive investors in conventional portfolios into a situation where they have no way to avoid dismal outcomes in the coming 10-12 years. Unlike even 2000, when 6.2% Treasury bond yields provided a conventional alternative to obscenely overvalued stocks, yields on all conventional assets are uniformly depressed here. We presently estimate that the total return of a passive, conventional portfolio mix of 60% stocks, 30% bonds, and 10% cash will hardly exceed 1% annually over the coming 12-year horizon.
My expectation is that prospects for long-term investors can be improved only to the extent they can tolerate the possibility of missing returns in the short-term in order to retain the ability to invest at lower valuations and higher prospective returns over the full course of the market cycle. Since investors have been encouraged to use the distance of valuations from their March 2000 bubble peak as a benchmark for prospective returns, it’s worth noting that on the basis of measures that have been most strongly correlated with actual subsequent market returns in market cycles across history, current valuation levels don’t put the “you are here” sign in 1996, or 1997, or even 1998, but rather in late-December 1999. The ebullience of the tech rampage at the time gave the market a level of momentum that it does not have at present, and the price/revenue multiple of the median S&P 500 component is already 50% beyond the 2000 extreme. Still, if one wishes to use the 2000 peak as a valuation bell to ring, it’s worth recognizing how close valuations are to that peak already. Investors should again recall that once the 2000 peak was in, it took just three weeks for the market to plunge more than 11%, bringing valuations below those December 1999 levels. Investors hoping to sell to greater fools had better be able to call a top rather precisely. With weak estimated 10-12 year returns expected for conventional portfolios, investors should not exclude alternative assets, tactical strategies, hedged equity, or at least a good amount of dry powder from consideration. For more comments on alternative investment strategies, see When Speculators Prosper Through Ignorance. As Grantham mentioned, we do see investors engaging in put-writing strategies as a way to generate "income." In the illusion that stocks cannot decline steeply, these strategies have become so aggressive that implied option volatilities were recently driven to levels seen in just 1% of history. That's not a crash warning by itself, but depressed volatility did appear in combination with divergent market internals and overvalued, overbought, overbullish conditions approaching the 1987 and 2007 peaks. In my view, shorting cheap put options in a high-risk environment like this one is like writing cheap auto insurance at the Demolition Derby. In the short-run, these strategies crush the volatility index (VIX), but if (and I expect when) a steep market loss turns those short puts into in-the-money obligations to take stock off of other investors' hands at a fixed price, they are likely to contribute to an acceleration of selling pressure, just as portfolio insurance did in 1987. We'd be inclined toward exactly the opposite strategy. Given low option premiums, along with extreme valuations, interest rates above the zero-bound, and market internals showing continued dispersion, patient investors who can tolerate the potential risk of a slow and annoying drip of option decay over a shorter segment of the market cycle could also see asymmetrically large returns from tail-risk hedges as the market cycle is completed. That kind of position always has to be limited to a small percentage of assets, and should be limited mainly to conditions that join unfavorable valuations and internal dispersion. In the face of marginal new highs, it's also a reasonable concession to be slow about raising strike prices, since the main object of interest is the 50-60% gap from current valuations to historical norms. As a side note, yes, we did see "Hindenburg" on Thursday, so last week's high was sloppy internally, but we can't rule-out further short-term upside.. While about 80% of the market gain since the 2009 low occurred by the end of 2014, a sequence of novelties since then (particularly Brexit and the U.S. election) have worked to extend this high-level top-formation. Still, I continue to view this as a period of top-formation. Unlike Irving Fisher in September 1929, I have no expectation that the market has reached a “permanently high plateau.” The foregoing comments represent the general investment analysis and economic views of the Advisor, and are provided solely for the purpose of information, instruction and discourse. Please see periodic remarks on the Fund Notes and Commentary page for discussion relating specifically to the Hussman Funds and the investment positions of the Funds. --- The foregoing comments represent the general investment analysis and economic views of the Advisor, and are provided solely for the purpose of information, instruction and discourse. Prospectuses for the Hussman Strategic Growth Fund, the Hussman Strategic Total Return Fund, the Hussman Strategic International Fund, and the Hussman Strategic Dividend Value Fund, as well as Fund reports and other information, are available by clicking "The Funds" menu button from any page of this website. |
|||||||||||||||||||||||||
|
For more information about investing in the Hussman Funds, please call us at
1-800-HUSSMAN (1-800-487-7626) 513-326-3551 outside the United States Site and site contents © copyright Hussman Funds. Brief quotations including attribution and a direct link to this site (www.hussmanfunds.com) are authorized. All other rights reserved and actively enforced. Extensive or unattributed reproduction of text or research findings are violations of copyright law. Site design by 1WebsiteDesigners. |