
|
|
||||||
|
|

March 30, 2015 Eating Our Seed Corn: The causes of U.S. economic stagnation, and the way forward Executive Summary
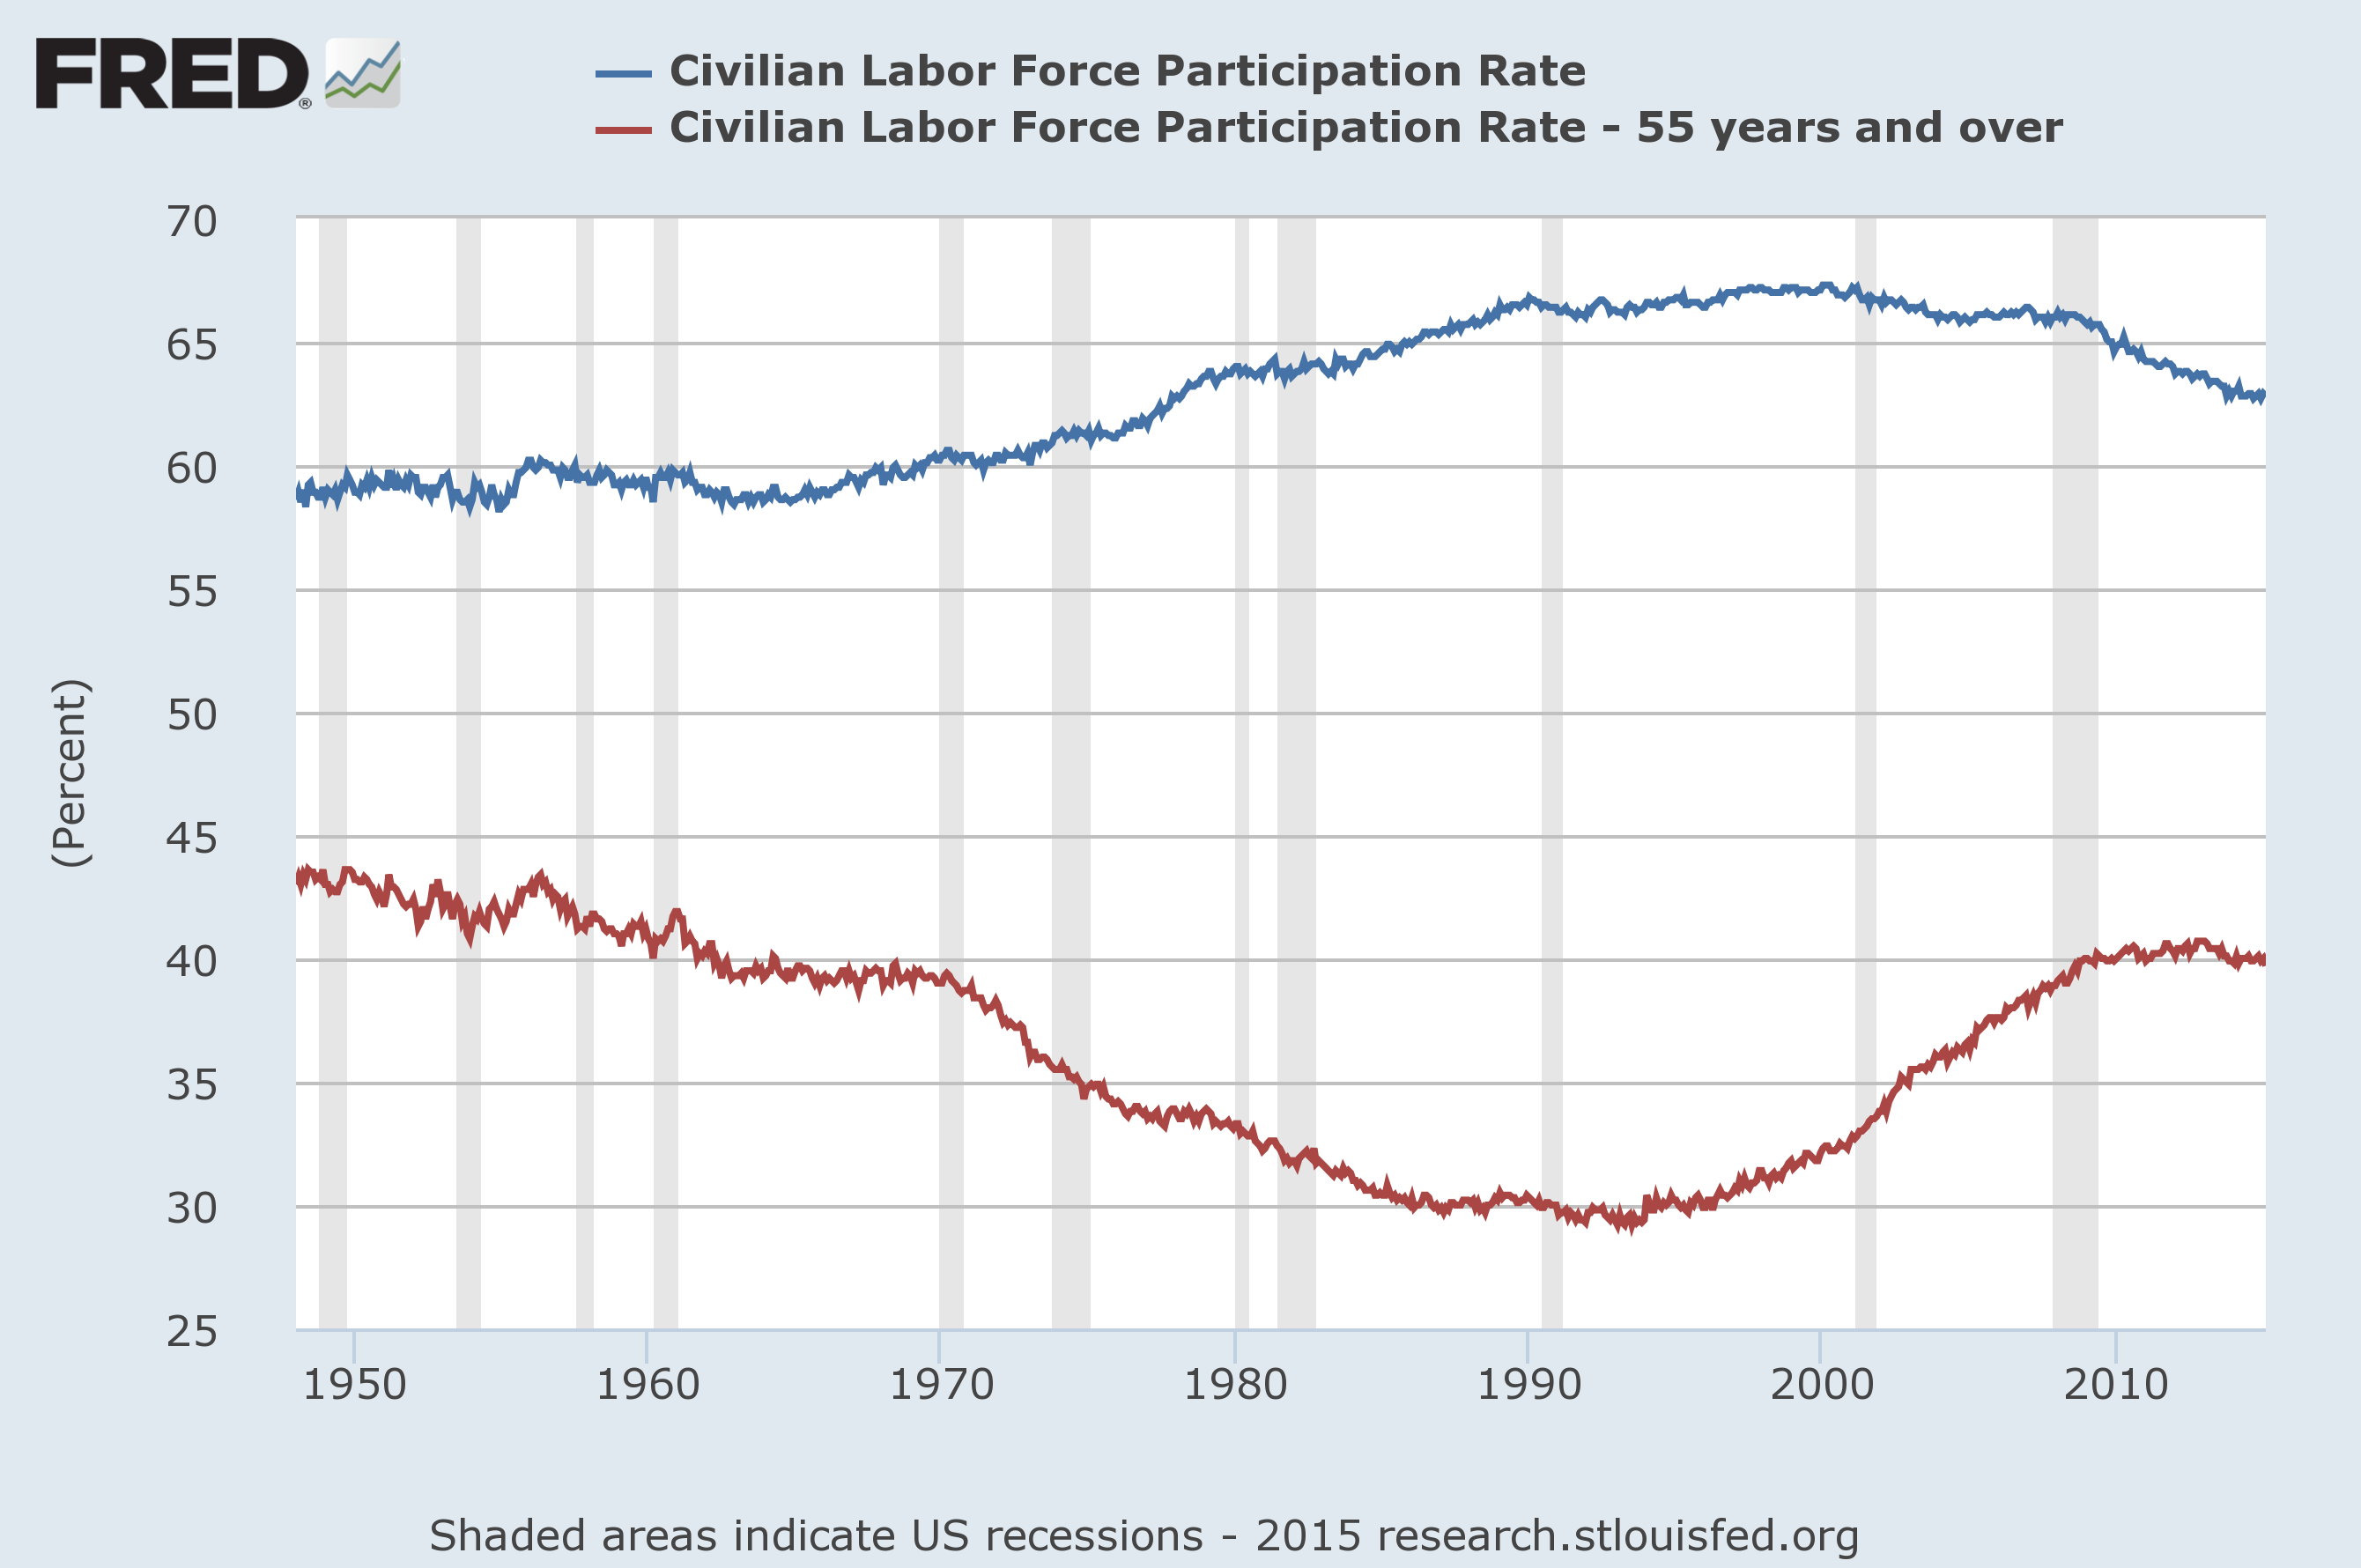
What raises both real wages and employment simultaneously is economic policy that focuses on productive investment – both public and private; on education; on incentivizing local investment and employment and discouraging outsourcing that hollows out middle class jobs in preference for cheap foreign labor; on international economic accords that harmonize corporate taxes, discourage corporate tax dodging and beggar-thy-neighbor monetary policies, and provide for offsetting penalties, import tariffs and export subsidies when those accords are violated. What our nation needs most is to adopt fiscal policies that direct our seed corn to productive soil, and to reject increasingly arbitrary monetary policies that encourage the nation to focus on what is paper instead of what is real. Introduction One of the central policy errors since the global financial crisis, and indeed since the collapse of the technology bubble after the 2000 market peak, has been the notion that economic problems caused by financial crisis must be fixed by financial means; monetary policy in particular. Unfortunately, this line of thinking has progressively weakened the U.S. economy, making it increasingly dependent on debt, encouraging the diversion of scarce savings to speculative purposes, promoting beggar-thy-neighbor monetary policies abroad that encourage the substitution of domestic jobs with cheaper foreign labor, and creating what is now the third U.S. equity valuation bubble in 15 years. What we demonstrate below is this. The U.S. has become a nation preoccupied with consumption over investment; outsourcing its jobs, hollowing out its middle class, and accumulating increasing debt burdens to do so. Making our country stronger will require us to turn our backs on paper monetary fixes that discourage saving while promoting speculation and debt-financed consumption. It will also require us to turn toward policies that encourage productive investment – public (e.g. infrastructure), private (e.g. capital investment and R&D), and personal (e.g. education). The good news is that these policy options are within reach if we are enlightened enough to choose them. How we got here The 1990’s embodied two major economic shifts. An increasing trend toward globalization began to substitute domestic labor and output with outsourced labor and cheaper foreign goods. From a position of balanced trade in 1990, the U.S. current account deficit gradually expanded, reaching 4% of GDP annually by 2000 (and 6% by 2004). Meanwhile, the growth of the internet provoked an expansion of technology investment and eventually a bubble, which the Federal Reserve did little to counter, other than Alan Greenspan’s purely rhetorical question asking “how do we know?” when a bubble has reached the point of irrational exuberance. Following the collapse of that bubble during 2000-2002, the role of the Federal Reserve changed from a benign observer to an active facilitator of bubbles. By pushing short-term interest rates toward 1% in 2003, the Fed provoked a reach for yield by investors, who found refuge in mortgage securities (which until that point had historically had low rates of default despite offering a “pickup” in yield over Treasury securities). Wall Street responded to that demand by creating a massive volume of new supply, eventually lending to anyone with a pulse in order to create new “product” that could be repackaged and sold to yield-hungry investors. The financial collapse that followed would push the U.S. economy to the brink of Depression, yet the role of the Federal Reserve in producing the crisis has been forgotten. Part of that memory failure is the result of misattributing the subsequent recovery to Federal Reserve heroics. In that context, it’s essential to understand that it was not extraordinary monetary policy that ended the financial crisis. The crisis ended – and in hindsight, ended precisely – on March 16, 2009, when the Financial Accounting Standards Board abandoned mark-to-market rules, in response to Congressional pressure by the House Committee on Financial Services on March 12, 2009. The decision by the FASB gave banks “significant judgment” in the values that they assigned to assets. While the Fed did have a legitimate role as a lender of the last resort, it vastly overstepped that role by violating Sections 13 and 14 of the Federal Reserve Act (which Congress later amended in order to lay out the restrictions like a See Dick Run book). In the years since, the Federal Reserve has done everything in its power to reignite a financial bubble, in hopes of generating a “wealth effect” sufficient to encourage economic activity via greater consumption and debt finance. This is like advising someone “if you want to prosper, you should consume more, and go as deeply into debt as possible.” We all know intuitively that this is the wrong message. Prosperity requires productive investment. To fully understand why there seems to be such a growing gap between Main Street and Wall Street; between working Americans and corporations, let’s briefly examine the drivers of the economy one by one. The U.S. economy: sector by sector Gross domestic product (GDP) is equal to consumption, plus real investment (factories, housing, capital equipment), plus government spending, plus exports, minus imports. This isn’t a theory. It is simply an accounting identity, but we can understand a great deal about the state of the economy by examining these components individually. In the consumer sector, wages and salaries have plunged to the lowest share of GDP in history, while the civilian labor force participation rate has dropped to levels not seen since the 1970’s. Yet as the U.S. has become underemployed, it has become a more active consumer nation, with consumption as a share of GDP recently hitting a record high. This gap between income and expenses has been financed by debt accumulation, encouraged by the Federal Reserve’s policy of zero interest rates, and enabled by fiscal policies that prioritize income replacement rather than targeted spending and investment. In the investment sector, real gross private domestic investment has crawled at a growth rate of just 1.5% annually since 1999 (versus a 4.7% real annual rate in prior decades), with growth of just 1% annually over the past decade. Yet while real capital accumulation in the U.S. has slowed to a crawl, corporate profit margins have never been higher. Coupled with yield-seeking speculation encouraged by the Federal Reserve’s zero interest rate policies, reliable measures of stock market valuation have now been pushed beyond every cyclical peak in history except the 2000 bubble peak. There are of course, numerous unreliable measures of valuation that appear more “reasonable,” but these also have little relationship with actual subsequent market returns. In the government sector, the global financial crisis resulted in a sharp boost in transfer payments such as food stamps and unemployment compensation. While unemployment compensation has declined considerably, there are now more than 46 million Americans on food stamps, with SNAP (Supplemental Nutrition Assistance Program) expenditures increasing five-fold since 2000. But while transfer payments and entitlements have increased, government consumption and investment as a share of GDP have declined toward the lowest levels in history. In effect, fiscal policy has been heavily biased toward income replacement, but has otherwise been a deer in the headlights in the face of repeated economic crisis. While the contribution of private investment has slowed to a crawl, fiscal policy – except for transfer payments – has actually been in retreat. We’ll come back shortly to foreign trade, which presents its own risks at present. But before going further, it will help to present a few charts to illustrate the foregoing points. The chart below shows the civilian labor force participation rate (the percentage of working-age population actually participating in the labor force – either currently with a job or actively looking for one). Note that the overall participation rate has plunged since the mid-1990’s, while workers close to retirement have been drawn back into the job market. Since December 1999, total civilian employment among individuals 55 years of age and older has increased by 15.3 million jobs. Yet total civilian employment – including those over 55 – has grown by only 13.8 million jobs. This means exactly what you think: outside of workers 55 years of age and older, Americans of working age have 1.5 million fewer jobs today than 15 years ago. This pattern couples three influences: the replacement of U.S. jobs with cheaply outsourced labor abroad (including imported goods that embody those labor services); an aging population where baby boomers still have a desirable skill-set not easily replaced by foreign workers; and aggressive monetary policies that destabilize retirement planning by promoting a repeated bubble-bust cycle in the financial markets, encouraging the growth of household debt, and leaving those near retirement without a safe source of interest income on accumulated savings.
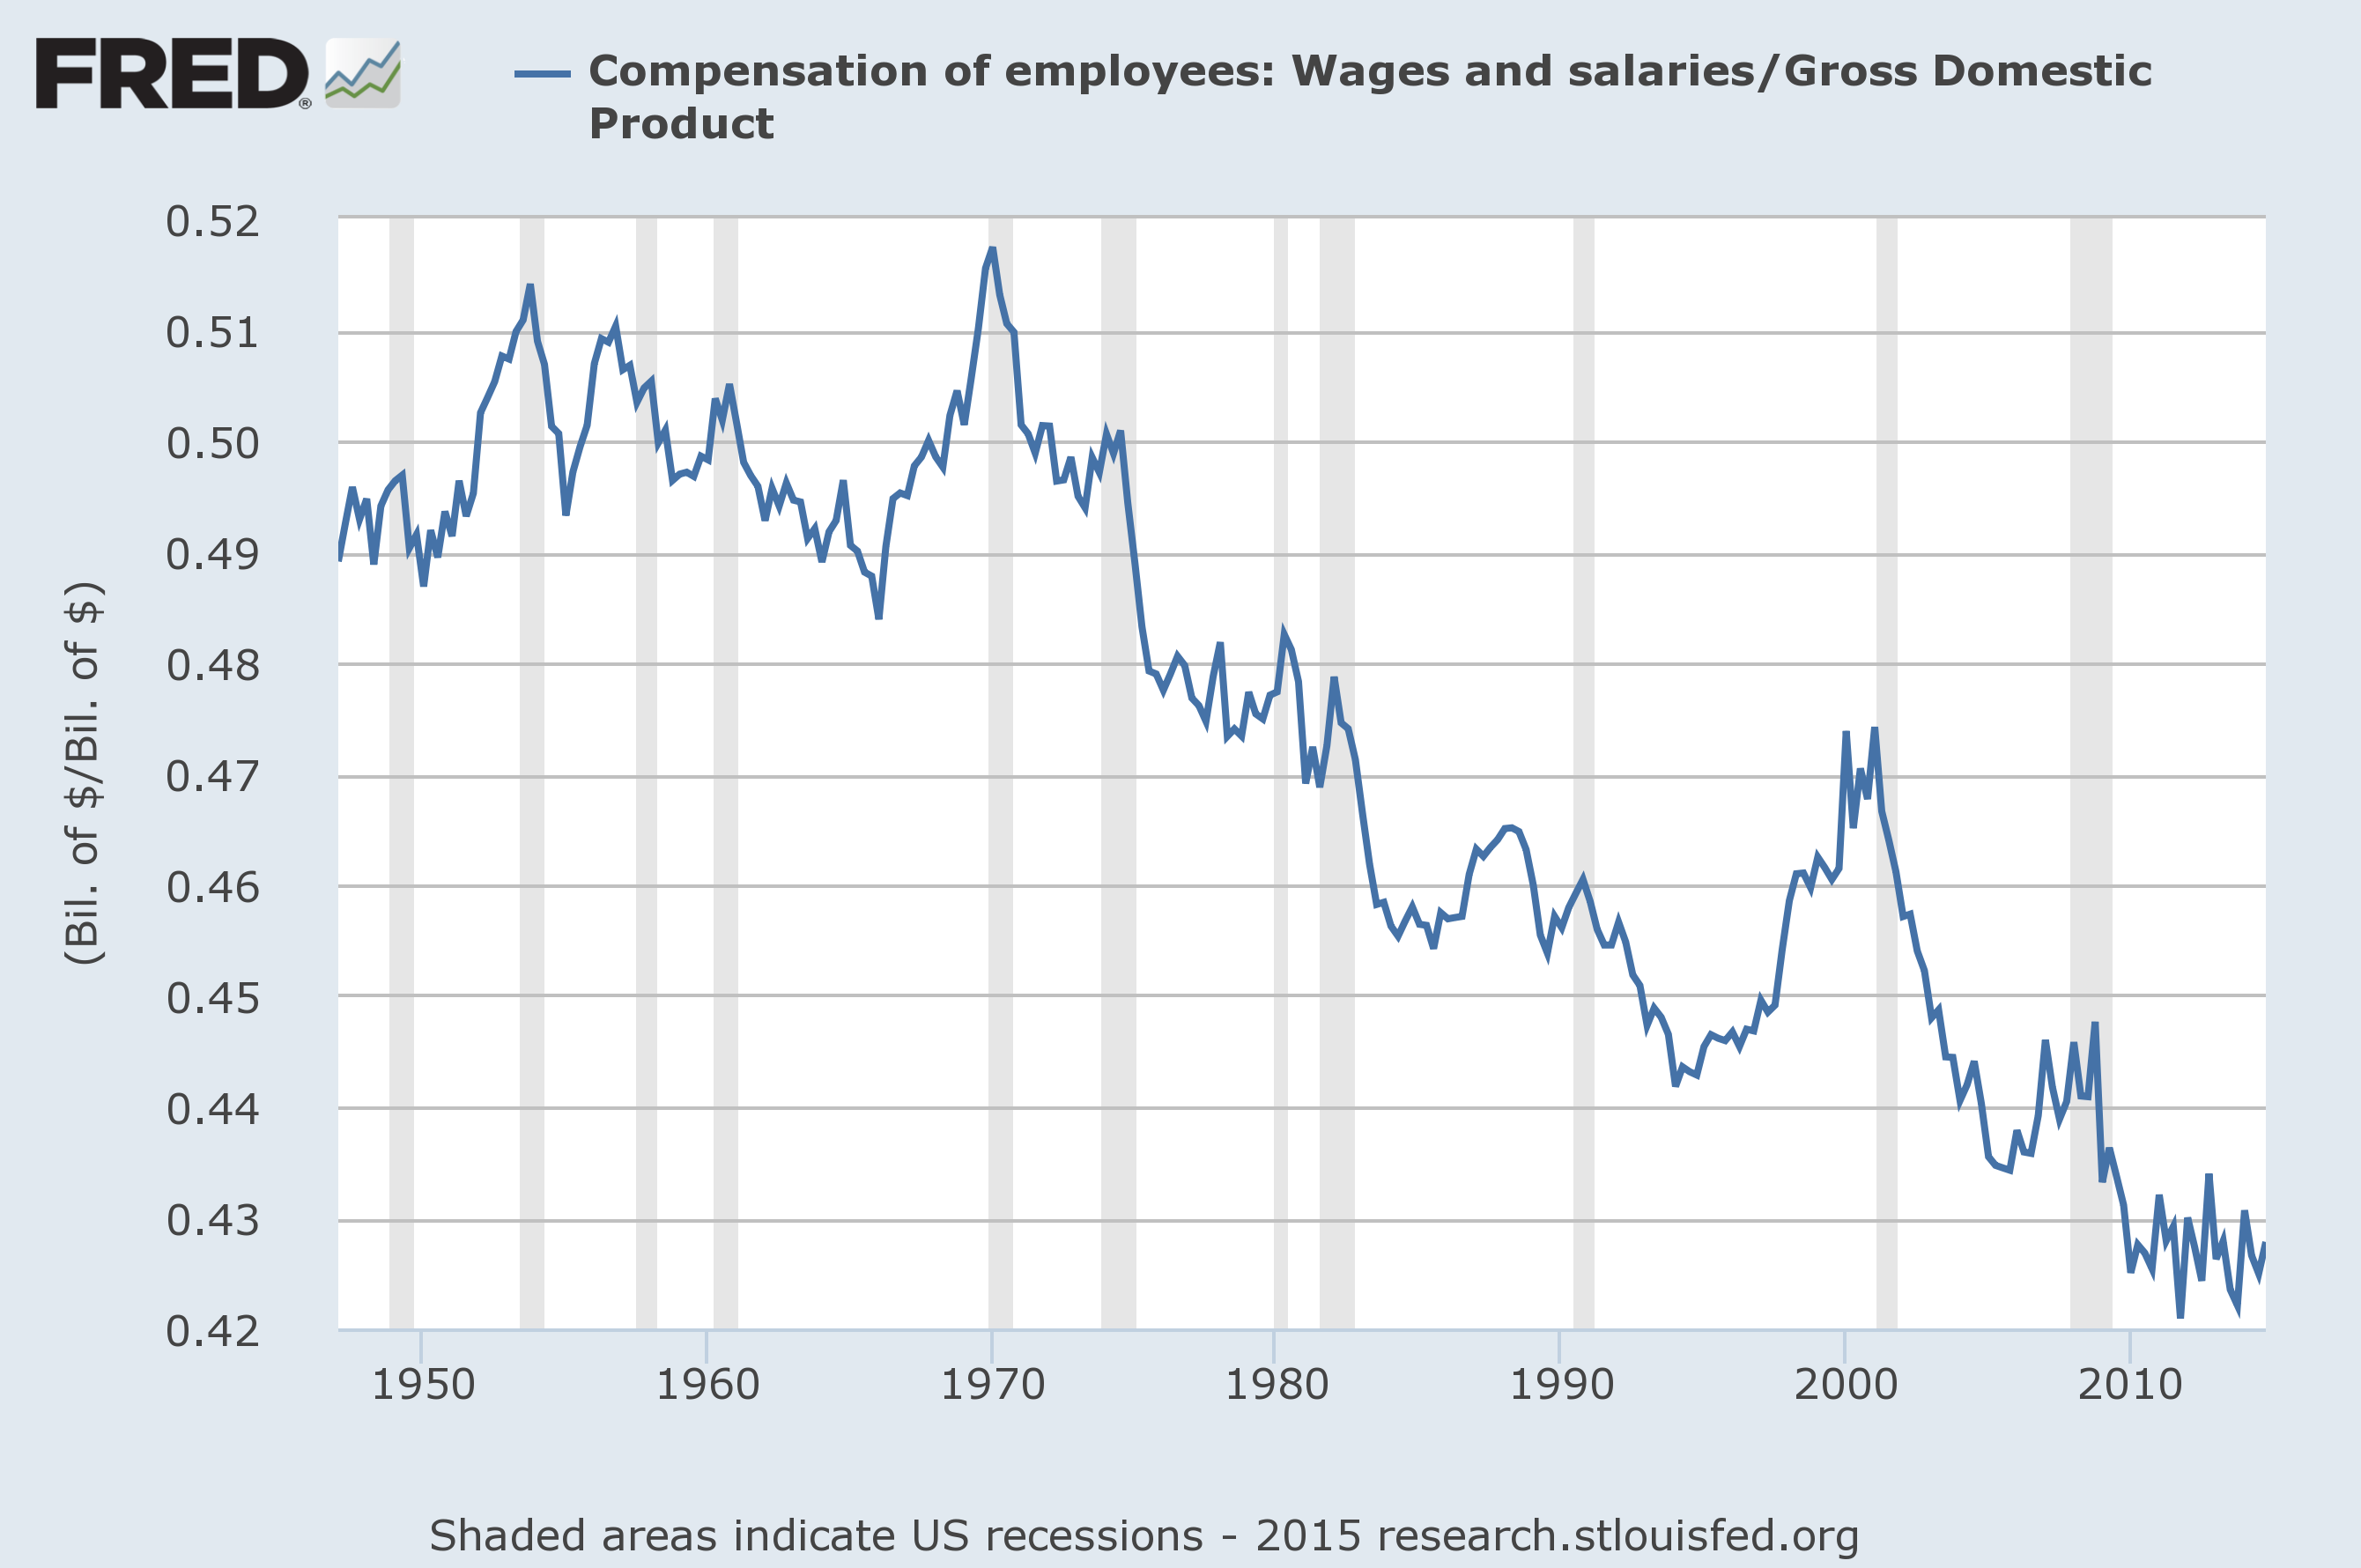
Next, while U.S. employment has been hollowed out, so too have incomes. Wages and salaries, as a share of GDP, have never been lower.
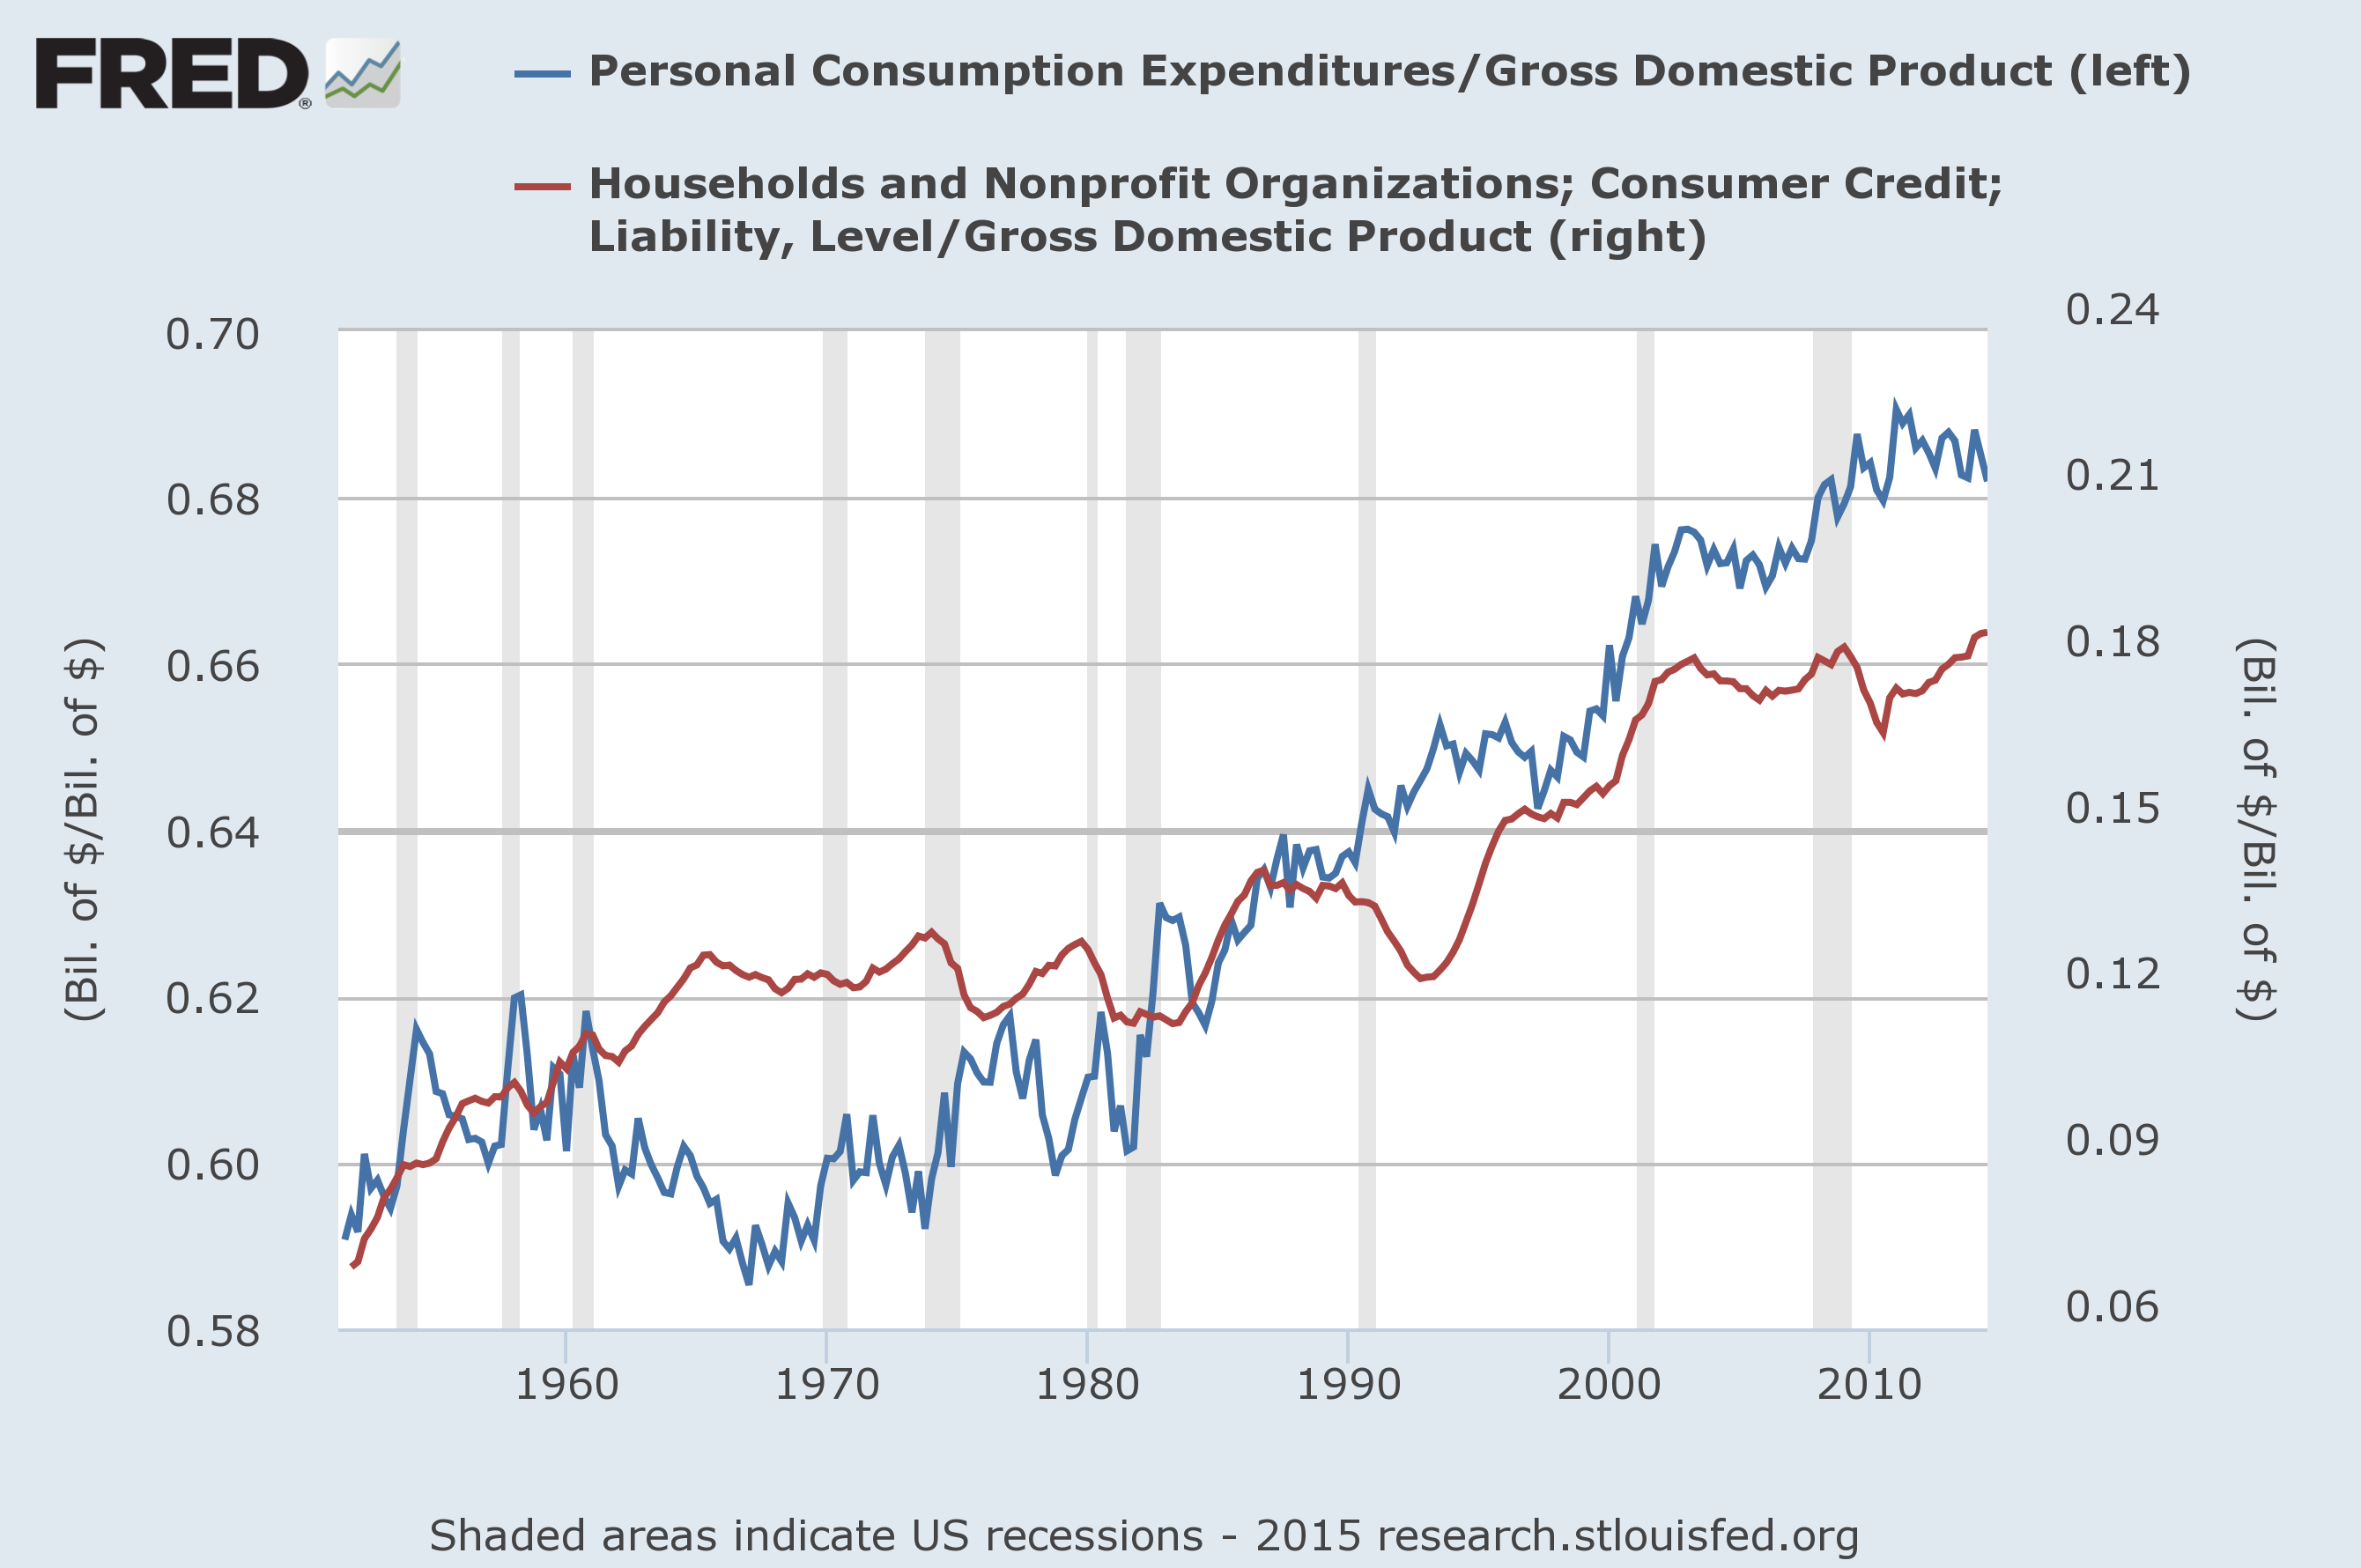
Yet despite weak incomes, personal consumption as a share of GDP has never been higher. Not surprisingly, the same is true for consumer credit as a share of GDP, as monetary policy has encouraged the persistent accumulation of debt to bridge the gap between income and consumption.
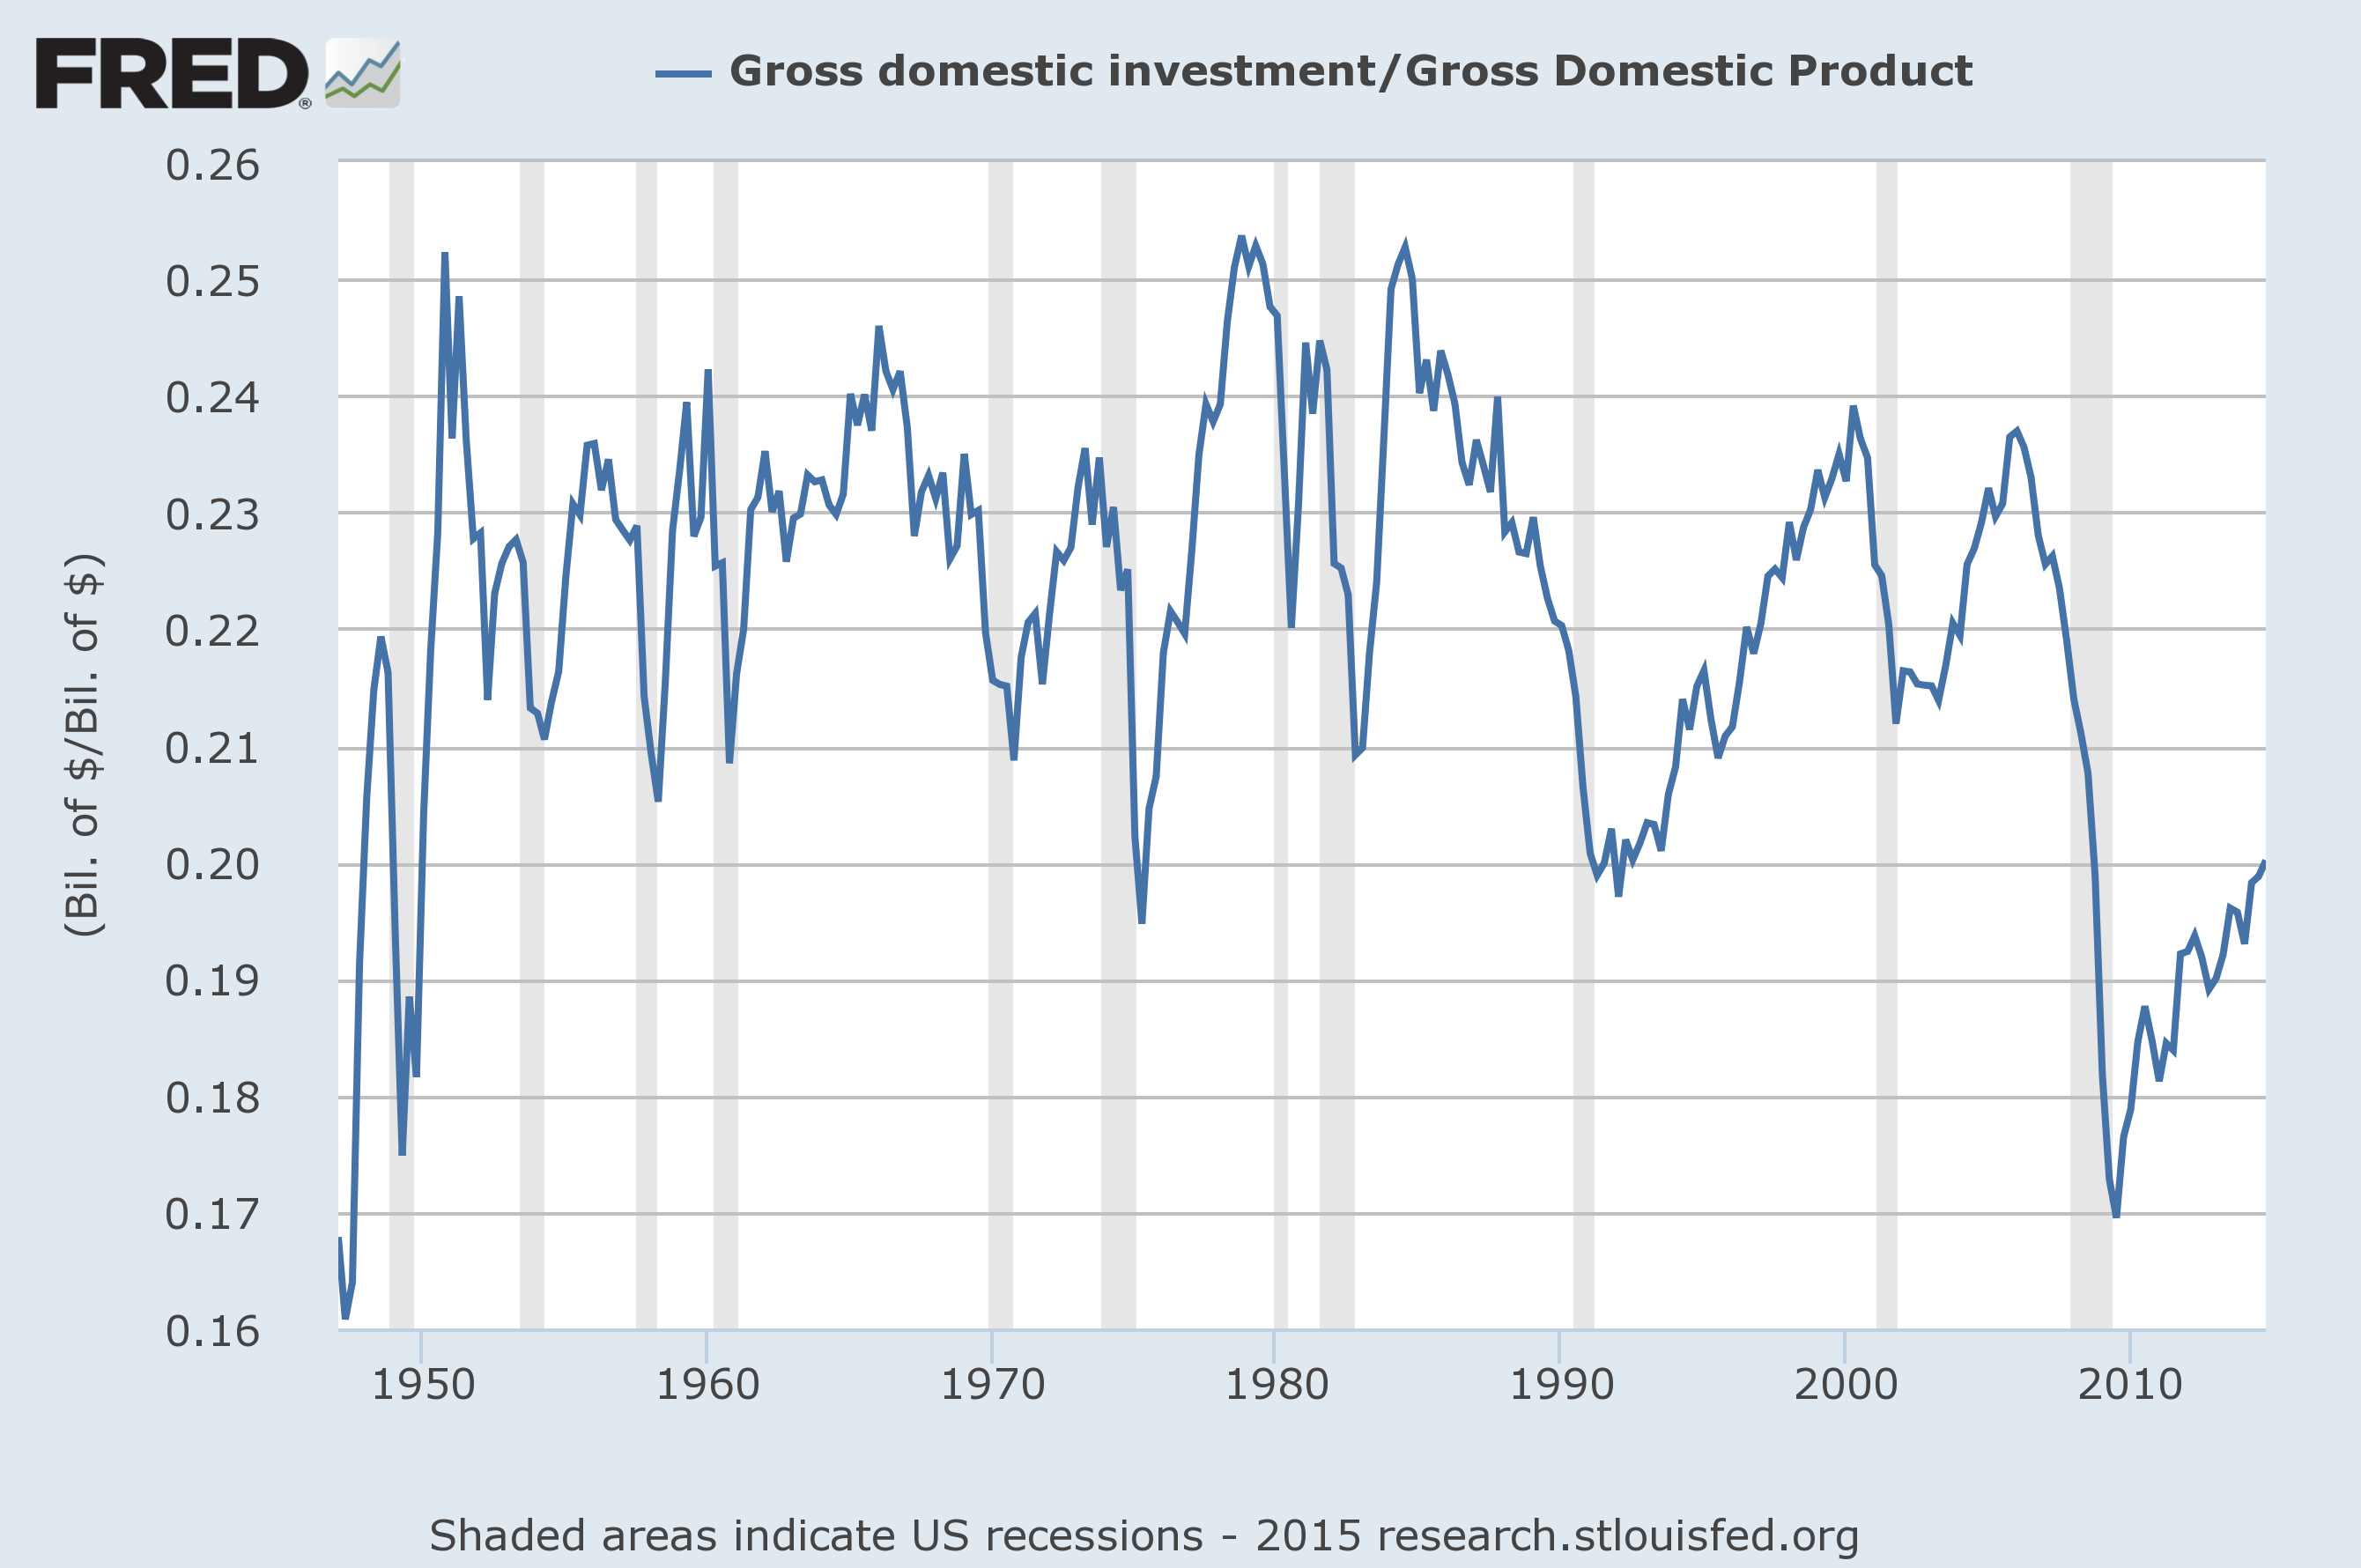
Another reflection of the consumption – rather than planting – of our seed corn is apparent in the investment sector (which includes capital goods, housing, R&D, factories, and so forth). The share of gross domestic investment in U.S. economic activity has collapsed since 2000. While we’ve seen an upturn since the depths of the global financial crisis, the share of investment is nowhere near what the U.S. enjoyed during more prosperous decades.
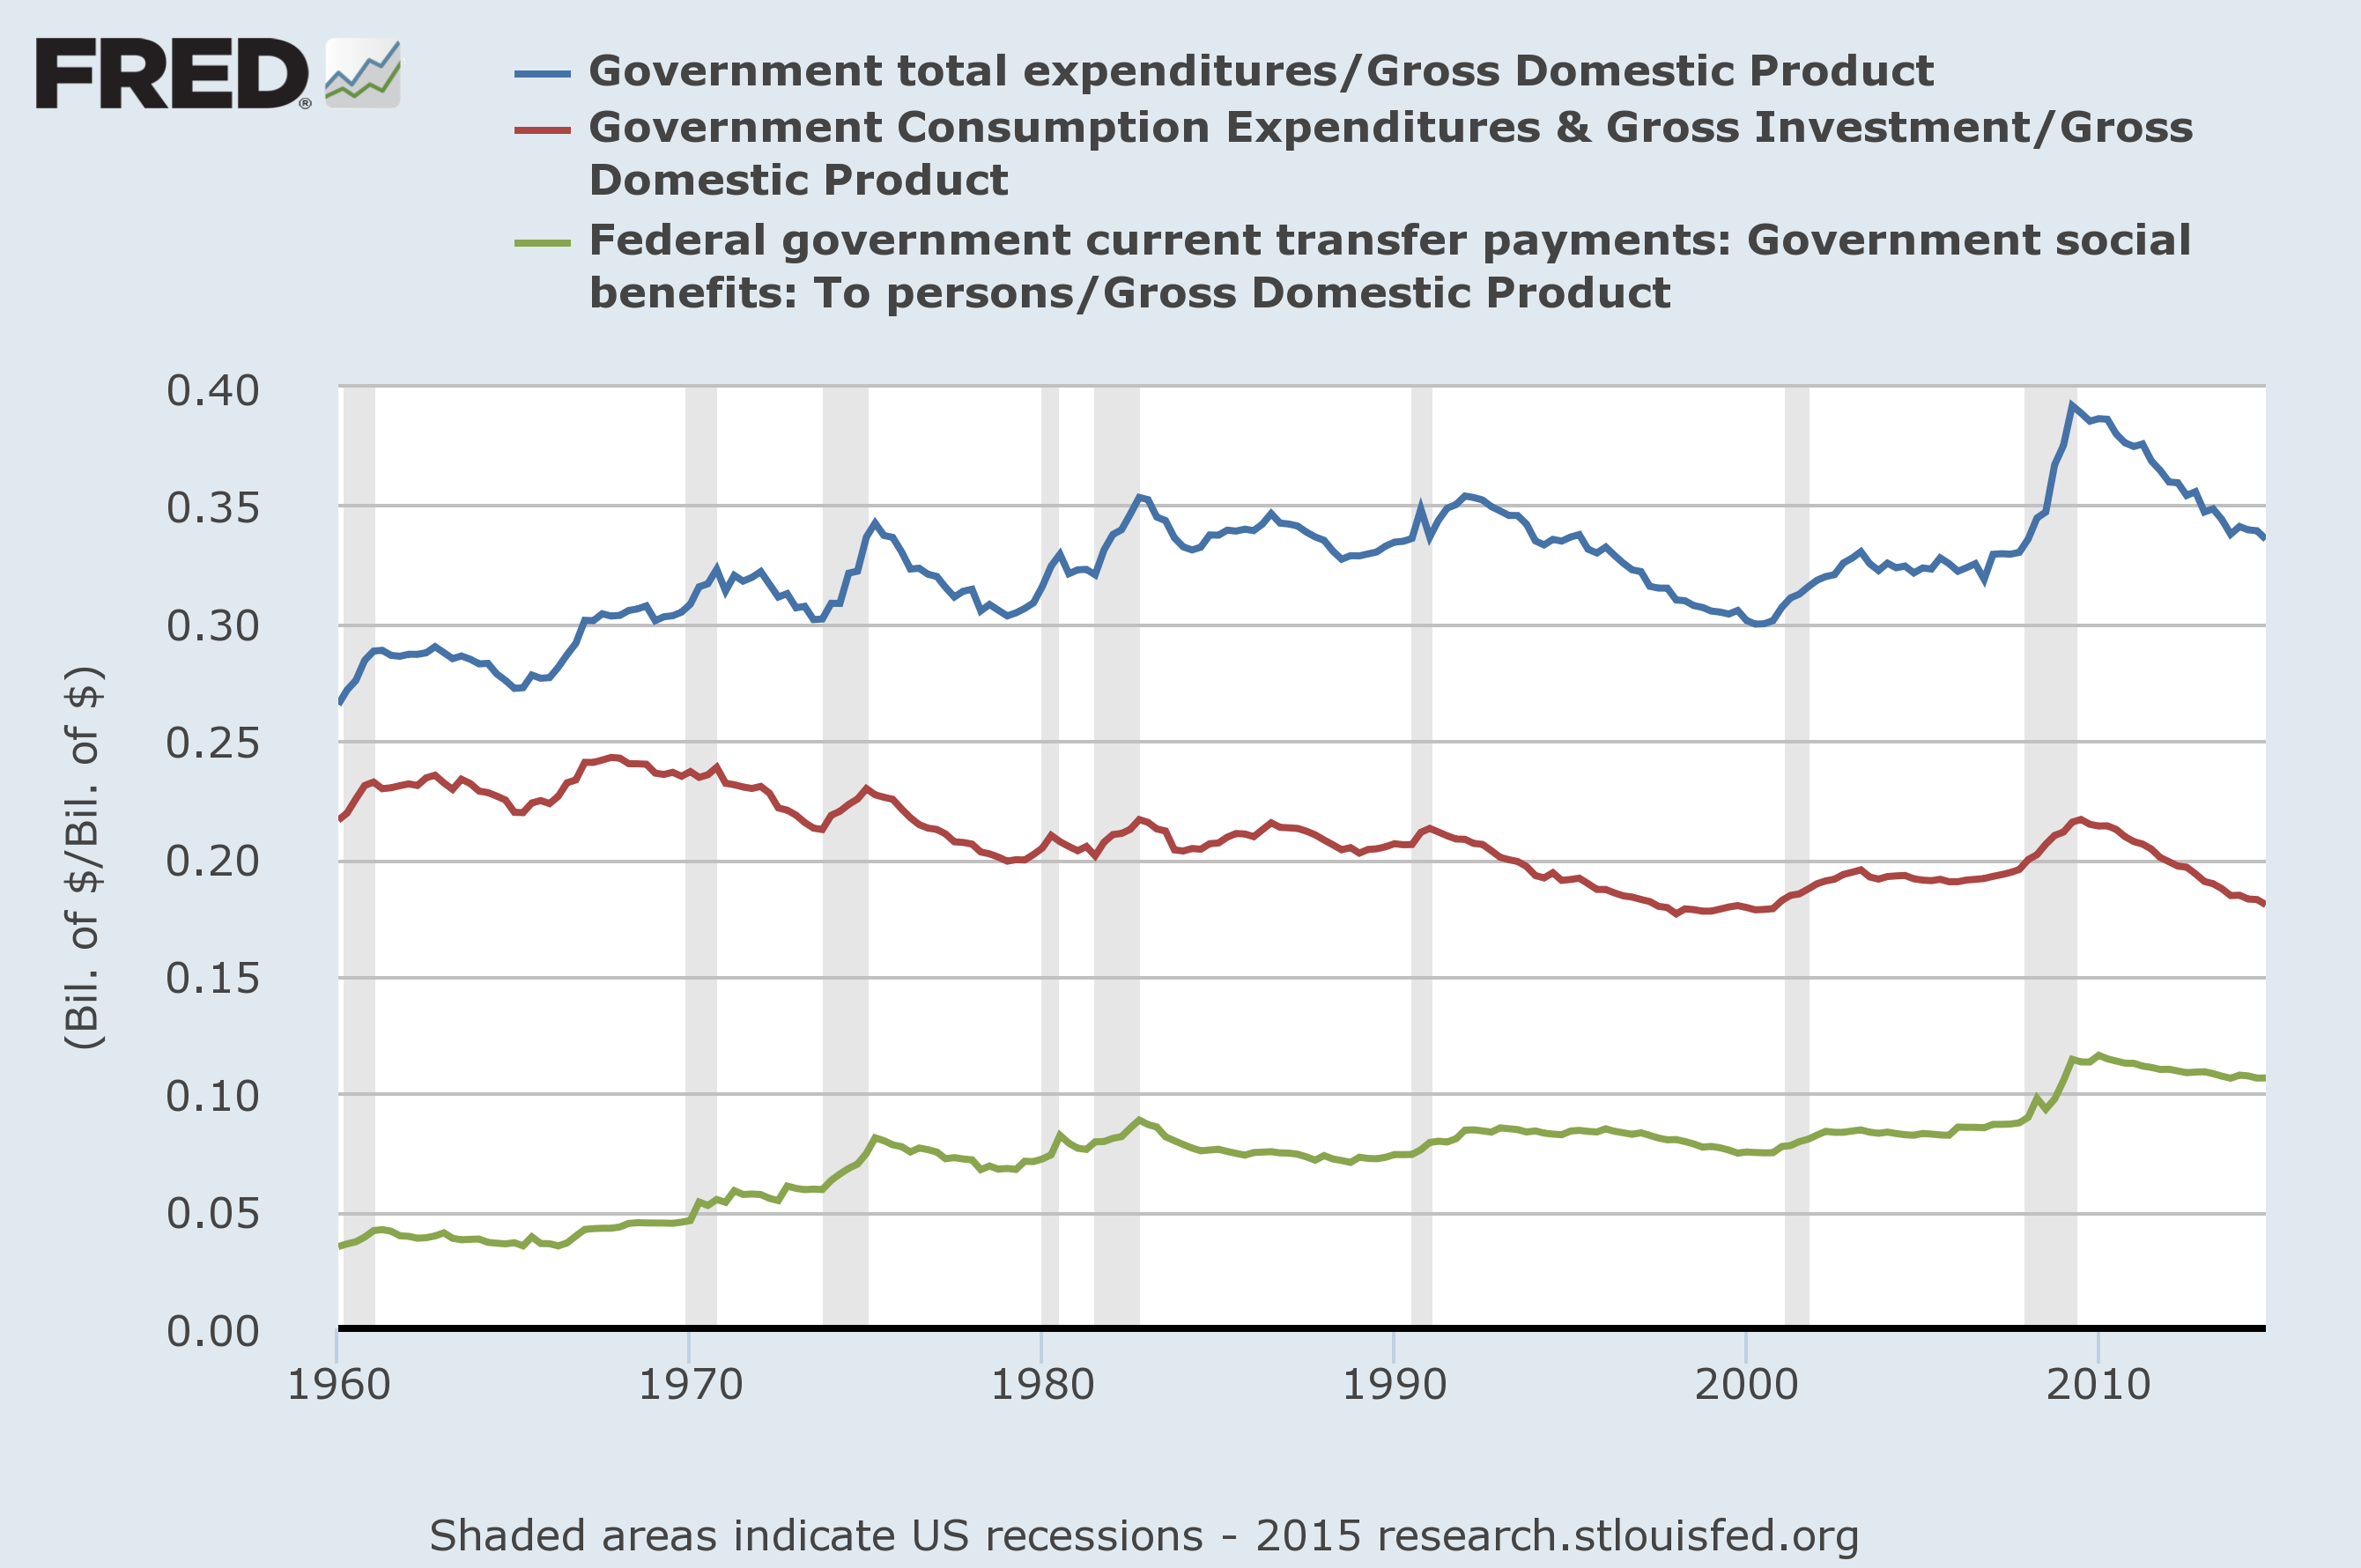
Turning to government spending, the same pattern is clear. Transfer payments have grown persistently as a share of spending, while combined government consumption and gross investment has dropped to one of the lowest shares of GDP in history.
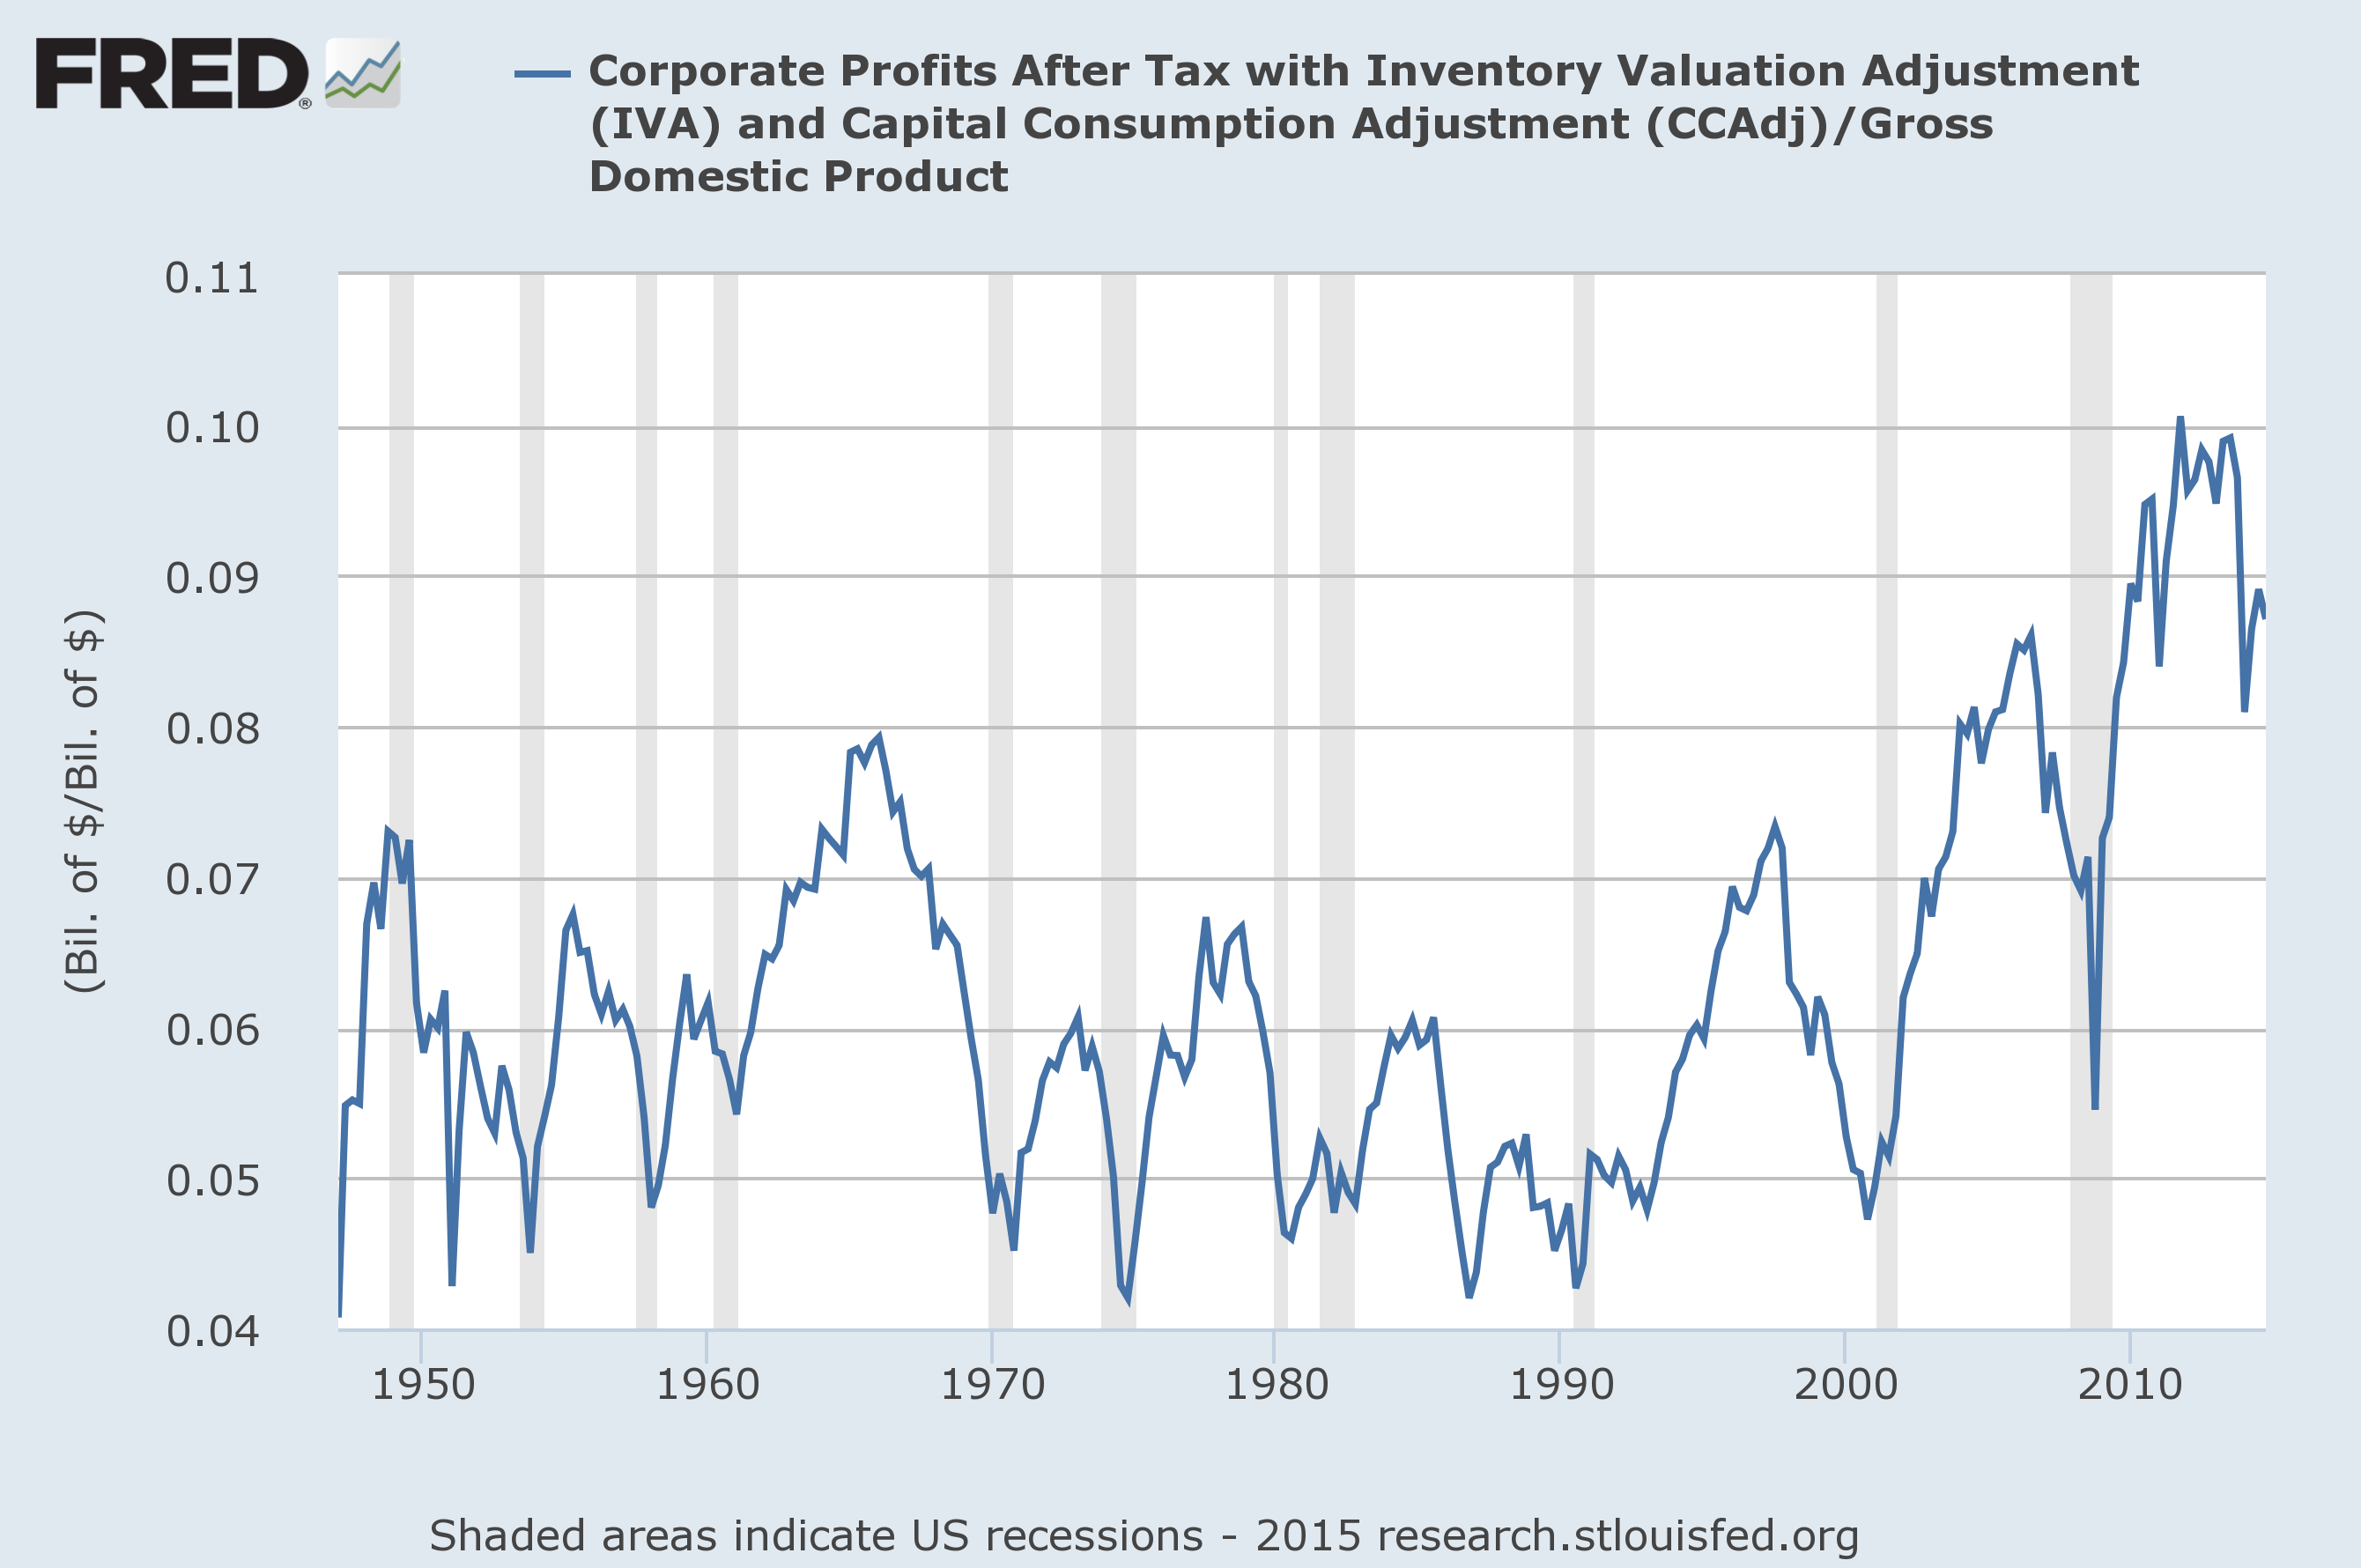
Corporate profits and the savings-investment identity What’s clear in all of this is that the role of productive investment in the U.S. economy has collapsed, with financial distortions and monetary heroics desperately attempting to encourage more consumption and to punish saving in hopes of “stimulating” economic activity through more spending. What’s not as obvious is how this same dynamic has produced an egregiously wide distribution of income in the United States. While wages and salaries are at the lowest share of GDP in history, corporate profits have surged to a record high share in recent years.
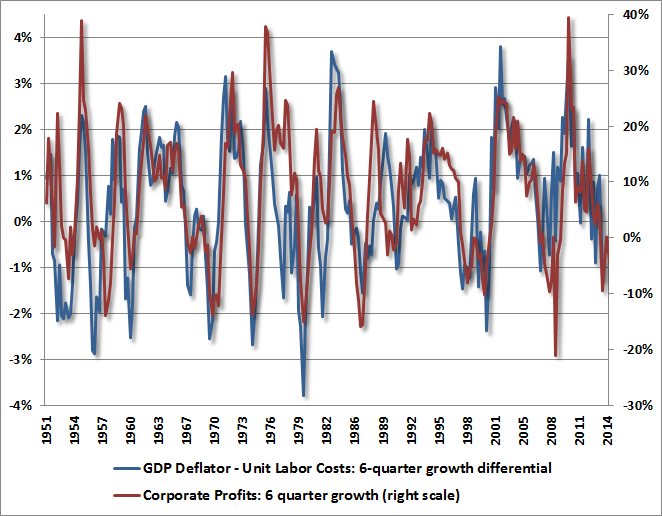
There are two ways to understand these profits. Probably the simplest is to recognize that profits essentially reflect the wedge between the price that a company sells its output and the cost to produce it, where labor typically represents the vast majority of that cost. So we should expect the growth of profits to be tightly linked to the difference between two growth rates: the growth in output prices (we’ll use the GDP deflator) and unit labor costs (the labor cost required to produce one unit of output). That’s exactly what we find. Put simply, profits grow to the extent that output prices grow faster than the unit labor cost of producing that output.
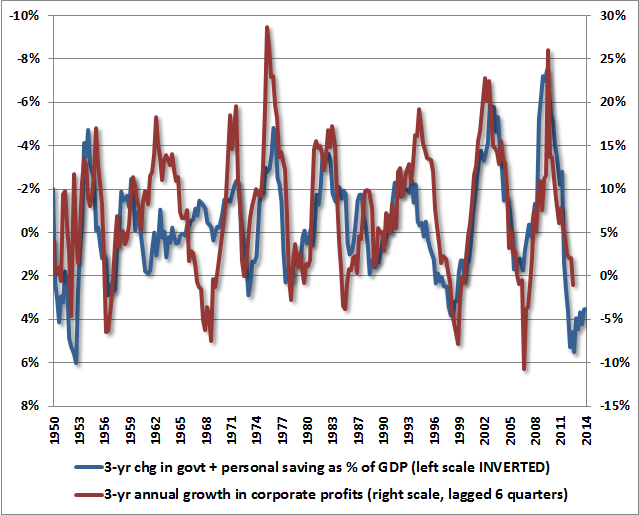
Notice what the above chart actually says. In an economy where wages and salaries are depressed, but government transfer payments and increasing household debt allow households to bridge the gap and consume beyond their incomes, companies can sell their output without being constrained by the fact that households can’t actually afford it out of the labor income they earn. Meanwhile, our trading partners are more than happy to pursue mercantilist-like policies; exporting cheap foreign goods to U.S. consumers, and recycling the income by lending it back to the U.S. in order to finance that consumption. This dynamic has helped to turn the U.S. from what was once the largest creditor nation in the world to what is now the largest debtor. Debt-financed consumption, while it proceeds unhindered, is a central driver of elevated corporate profits. As it turns out, this idea can be formalized into an accounting identity. From an accounting standpoint, the national income identity (GDP = consumption + investment + government + exports – imports) has a nice equivalent called the “savings investment identity.” Let’s break savings down by sector. Trust me – the few lines of basic arithmetic here are worth the effort. Savings = Investment Household Savings + Government Savings + Corporate Savings + Foreign Savings (the inverse of the current account deficit) = Investment Corporate Savings = Investment – Foreign Savings - Household Savings – Government Savings Profits – Dividends = (Investment – Foreign Savings) – Household Savings – Government Savings This relationship (called the Kalecki equation) is an accounting identity, not a theory. The reason (Investment – Foreign Savings) are in parentheses is because particularly in U.S. data, the two have a very strong inverse relationship, as “improvements” in the current account deficit are generally associated with a deterioration in gross domestic investment. So the term in parentheses adds very little variability over the course of the business cycle. Likewise, dividends are fairly smooth, and add very little variability to the equation over the course of the business cycle. For practical purposes, the above identity reduces – from the standpoint of overall variability – to a straightforward statement: Unusually elevated corporate profits (a surplus) are largely a mirror image of unusually large deficits in the household and government sectors. Most of the variability in corporate profits over the business cycle is the mirror image of variability in the sum of household savings and government savings. If you examine the actual U.S. data, this is exactly what we observe. Because government and household savings (shown on an inverted scale below) have actually recovered in recent years from the depths of the financial crisis, we’re beginning to see a flattening of growth in U.S. profits. That flattening is likely to turn into outright contraction during the next couple of years.
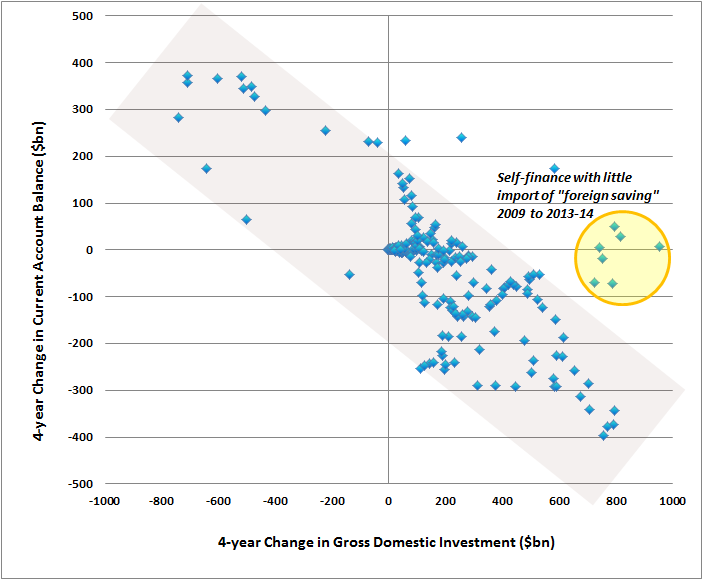
Why haven’t corporate profits declined more quickly from their record high levels in recent years? We can find the answer in the Kalecki equation derived above. Recall that: Profits – Dividends = (Investment – Foreign Savings) – Household Savings – Government Savings As noted above, normally, changes in gross domestic investment are offset by opposite changes in “foreign savings”; that is, when U.S. investment increases by a large amount, the U.S. current account balance (essentially imports-exports) goes into deficit. When U.S. investment collapses, as occurs during recessions, the U.S. current account “improves.” That general relationship since 1947 is depicted in the shaded region in the chart below. Notice however that unlike most periods in history, the recovery in gross domestic investment over the past four years has been financed mainly by through a partial recovery in government and personal saving from the depths of the financial crisis, without relying on a massive current account deficit – that is, a massive import of foreign saving. So in recent years, that (Investment – Foreign Saving) component of the Kalecki equation has increased, leaving profits relatively unscathed for a while. You can see that unusual behavior in the shaded yellow circle on the chart below. The problem here is that this dynamic has gone about as far as it is likely to go, particularly given the rapid appreciation of the U.S. dollar and general economic weakness overseas. As this dynamic normalizes, we’re likely to see a combination of a) contracting gross domestic investment, b) larger trade deficits (an increase in “foreign saving”), or both. In either case, this component is likely to weigh on corporate profits rather than supporting them – look again at the Kalecki equation to see why.
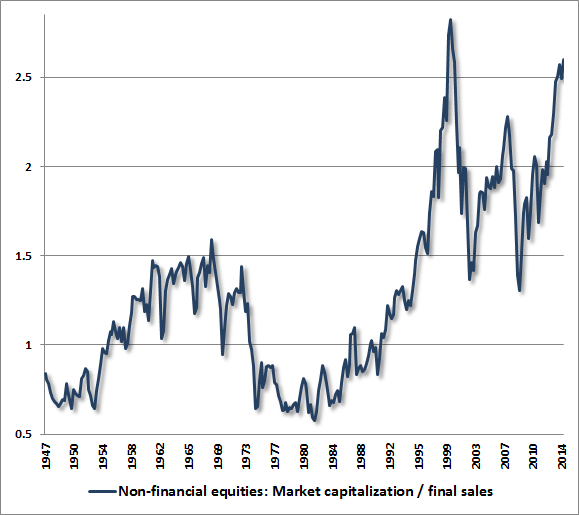
A warning on stock market valuations A central problem for the financial markets is that they have priced in record profit margins as if they are permanent, rather than mean reverting. As I detailed in Margins, Multiples and the Iron Law of Valuation, the most reliable stock market valuation measures (i.e. the measures that have a nearly 90% correlation with actual subsequent stock market returns) are those that explicitly take account of the level of profit margins and mute the impact of that variability. For investors who understand this, the past few years have been a horrifying form of deja-vu, as overly loose Federal Reserve policies have provoked yield-seeking speculation by investors who take these elevated profits at face value; assigning elevated price/earnings multiples to already elevated per-share earnings. Worse, companies eager to offset the gradual deterioration in profit margins have issued enormous amounts of new debt, and have used the proceeds of that debt to buy back their (overvalued) stock in order to reduce share-count and artificially boost earnings per share. The Federal Reserve has not only encouraged the debt-financed purchase of stock by ordinary speculators (at $445 billion, margin debt on the NYSE alone is 25% the volume of all commercial and industrial loans in the U.S. banking system combined), but also by corporations. As a result, the only valuation measures that look anything less than obscene are those that embed the assumption of permanently elevated profit margins. And while investors seem eager to assume that elevated valuations are “justified” by low interest rates, any straightforward discounting method can be used to show that each year of zero interest rates only justifies a roughly 4% increase in prices over otherwise historically normal valuations (see The Delusion of Perpetual Motion). With reliable equity valuations about 116% above reliable historical norms, on average, one would need to anticipate decades of zero short-term interest rates in order to “justify” current stock prices. Even if one does make that assumption, one would still expect a 20-year nominal total return for the S&P 500 of no more than about 5.6% annually. The chart below shows the ratio of market capitalization to final sales (gross value added) for non-financial companies. See Do the Lessons of History No Longer Apply? for a broader range of historically reliable and similarly overextended measures.
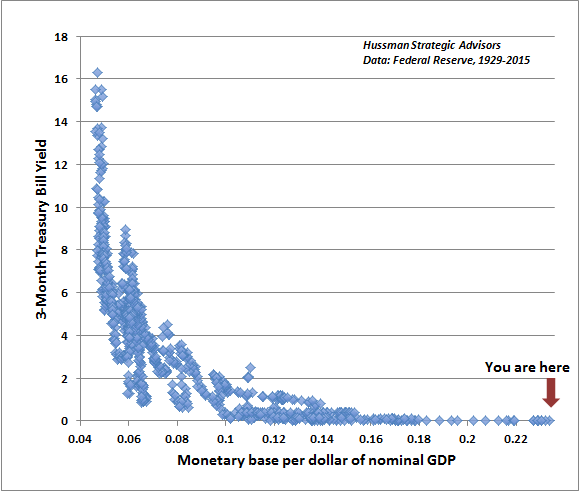
It’s tempting to assume that the “normal” level of valuations has simply increased over time, and that presently rich valuations have no implications for expected stock market returns. But even a cursory examination of market returns argues otherwise. While annual market returns always vary considerably over the market cycle, stock market returns in the pre-bubble period averaged 10-12% annually as a result of the lower average level of valuations. In contrast, the S&P 500 has enjoyed average annual nominal total returns of less than 4% since the 2000 peak, and even then, has only achieved those returns thanks to a bubble advance that has taken valuations back to similar extremes. Put simply, the most historically reliable measures we identify suggest that the S&P 500 Index is likely to be lower a decade from now than it is today (though dividend income should bring the total return to about 1.5% annually). These measures historically have been about 90% correlated with actual subsequent total returns in the S&P 500, and have retained that correlation in recent market cycles (see Extremes in Every Pendulum). Reforming monetary policy In principle, monetary policy has two main functions. One is as a “lender of the last resort.” In that role, we remain convinced that monetary policy should follow what economists know as Bagehot’s Rule: lend freely to solvent institutions and against collateral that is expected to be fully repayable in normal times, and immediately resolve insolvent institutions. To quote Bagehot, “these loans should only be made at a very high rate of interest. This will operate as a heavy fine on unreasonable timidity, and will prevent the greatest number of applications by persons who did not require it. The rate should be raised early in the panic, so that the fine may be paid early; that no one may borrow out of idle precaution without paying well for it; that the Banking reserve may be protected as far as possible. Needless to say, Ben Bernanke was no Bagehot. The second function of monetary policy is its more controversial role in economic stabilization. This is controversial because, as we demonstrated last week, the actual relationship between monetary policy variables and real economic variables is dramatically weaker than widely assumed (See Monetary Policy and the Economy: The Case for Rules Versus Discretion). In fact, once we allow for the component of monetary policy captured by a fixed linear rule (the Taylor Rule comes close – and currently indicates an appropriate Fed funds rate of about 3% here), one can find no evidence in the historical record that additional activist monetary policy has any material relationship with subsequent economic activity. There is a strong economic justification for proposals that would require the Fed to outline Taylor-type policy guidelines, and to explain deviations from those guidelines. These proposals should be advocated by Republicans and Democrats alike. Operationally, the Federal Reserve sets short-term interest rates by buying interest-bearing U.S. Treasury securities (as well as mortgage backed securities), and paying for them with “base money” – currency and bank reserves. This doesn’t quite amount to “injecting money” into the economy. Rather, the Fed basically replaces one existing government liability (government debt) with a liability of a different form (government money). As the Fed floods the economy with low or zero-interest base money, investors predictably compete for close alternatives such as Treasury bills, so bill prices rise and short-term interest rates fall. The effect of the monetary base on interest rates is one of the most reliable and prettiest relationships in economics. The chart below shows, in data since 1929, the relationship between the amount of monetary base (per dollar of nominal GDP) and the level of 3-month Treasury bill yields (our version of the “liquidity preference curve” in economics).
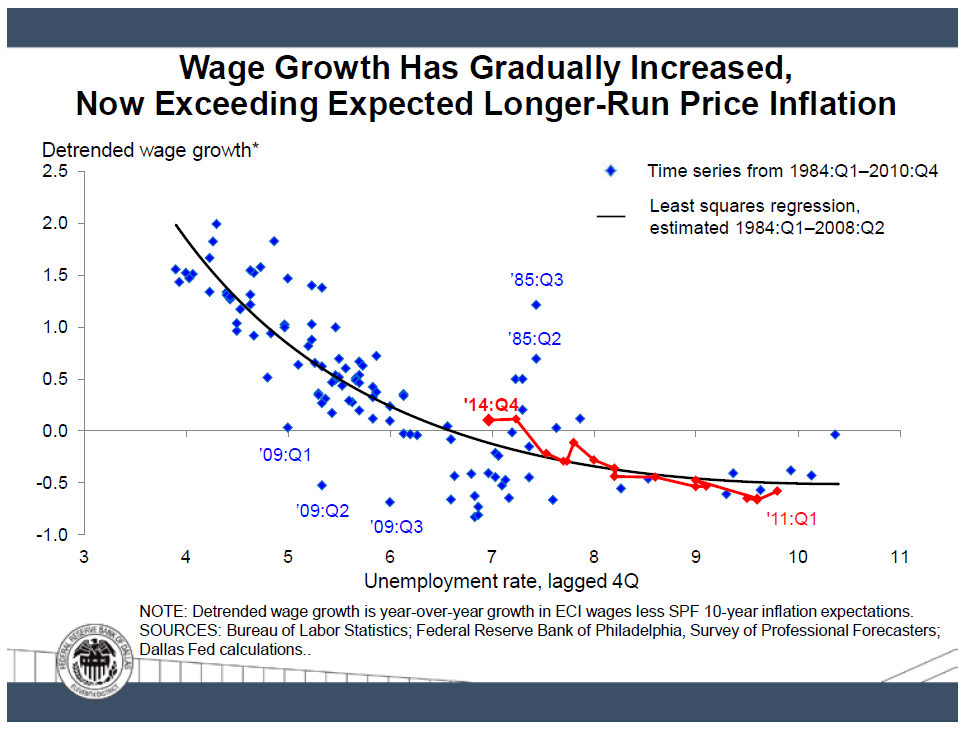
While we’re on the subject, notice that even if the Federal Reserve was to immediately reduce the monetary base by one-third (from nearly 24 cents of monetary base per dollar of GDP to a smaller 16 cents of monetary base per dollar of GDP), short term interest rates would still be zero. It is nothing but speculative madness for the Federal Reserve to refuse to reduce its $4 trillion balance sheet as those securities mature. As noted above, once we account for movements in the Federal funds rate that can be captured by a fairly simple linear policy rule such as the Taylor Rule, additional activist monetary policy (deviations from that rule) have effectively no ability to explain subsequent changes in GDP or employment. The belief to the contrary is based on the “Phillips Curve” dogma, which is improperly framed as a “tradeoff” between unemployment and inflation. You can see this dogma at work in statements by central bankers that seek to “achieve” higher inflation targets in hope of reducing the unemployment rate. In his farewell policy speech in Houston this month, Dallas Fed President and FOMC board member Richard Fisher included the following chart, showing real wage growth versus unemployment. While Fisher’s point was that the time for extraordinary monetary policy is behind us, there is a much more important lesson in this chart. Look at it first, and I’ll explain.
If there is one thing that every FOMC member should understand from this chart – for the love of humanity – please understand that this is the Phillips Curve. It is a relationship between unemployment and real wage inflation, it cannot be usefully exploited by monetary policy, and it is the only version of the Phillips Curve that actually exists in empirical data. As I observed in Will The Real Phillips Curve Please Stand Up?: “The Phillips Curve takes its name from a 1958 Economica paper by A.W. Phillips, which studied the relationship between unemployment and wage inflation in Britain, using a century of historical data through the 1950's. What Phillips found was this: when unemployment was low, wage inflation tended to be above-average, and when unemployment was high, wage inflation tended to be subdued. Yet during most of the period that Phillips studied, Britain was on the gold standard. As a result, the general price level was actually very stable, with very little general price inflation at all. In fact, Phillips excluded data ‘in or immediately after those years in which there was a very rapid rise in import prices.’ So when Phillips observed wage inflation, he was actually observing real wage inflation as well. “When unemployment was low and available labor was scarce, workers were able to command a greater amount of real goods and services in return for their work. In contrast, when unemployment was high and available labor was plentiful, workers found that their standard of living typically did not rise quickly because their services were not in sufficient demand. “Phillips demonstrated a principle that is well-known to every economist: very simply, when a useful resource becomes scarce, its price tends to increase relative to the prices of other goods and services.That finding doesn't need all sorts of intellectual contortions or modeling tricks to make it ‘work,’ because it is one of the most basic laws of economics. The true Phillips Curve, then, is a relationship between unemployment and real wages.” An enormous amount of human misery could be avoided if central bank authorities were attentive to this fact, and abandoned their endless bubble-blowing exercises in the hope of exploiting some tradeoff between unemployment and general price inflation that simply does not exist. Pursuing general price inflation does not somehow “buy” more jobs. It also does not raise real wages. It lowers them. While the demand for fixed investment, durable goods, and housing all respond to variations in interest rates, that response is limited. Interest cost is only one of many considerations that go into the investment decision – particularly for large capital investments. All of that normal variation in interest rates can be captured by straightforward policy feedback rules such as the Taylor Rule. Extraordinary departures from such fixed rules have no material correlation with subsequent economic activity. They simply distort the financial markets. Understand that the primary beneficiary of zero interest rate policies is the one industry where interest is the primary cost of doing business: the financial sector. As we demonstrated last week, even with its breathtaking policy of quantitative easing, the U.S. economy has grown slower in recent years than one would have predicted simply on the basis of lagged non-monetary variables. The only beneficiary of the Federal Reserve’s enormous exercise has been Wall Street. In short, there is no monetary solution that creates a more productive labor force or a more innovative economy. The way forward What raises both real wages and employment simultaneously is economic policy that focuses on productive investment – both public and private; on education; on incentivizing local investment and employment and discouraging outsourcing that hollows out middle class jobs in preference for cheap foreign labor; on international economic accords that harmonize corporate taxes, discourage corporate tax dodging and beggar-thy-neighbor monetary policies, and provide for offsetting penalties, import tariffs and export subsidies when those accords are violated. What our nation needs most is to adopt fiscal policies that direct our seed corn to productive soil, and to reject increasingly arbitrary monetary policies that encourage the nation to focus on what is paper instead of what is real. Frankly, I don’t think we’ll come out of this period of distortion without another crisis. There’s just too much speculation – built on debt – to unwind gingerly. It fascinates me that some observers blame the collapse in 1937 on the Federal Reserve tightening too early, but entirely ignore the valuation bubble that was already baked in the cake by then. Still, regardless of whatever disruption may come to overvalued risk assets, I have enormous optimism that thoughtful economic policy can have a truly positive effect on U.S. prosperity. We’ve already discovered that reckless economic policy can have equally disastrous effects. My hope is only that we change course sooner than later.
--- The foregoing comments represent the general investment analysis and economic views of the Advisor, and are provided solely for the purpose of information, instruction and discourse. Prospectuses for the Hussman Strategic Growth Fund, the Hussman Strategic Total Return Fund, the Hussman Strategic International Fund, and the Hussman Strategic Dividend Value Fund, as well as Fund reports and other information, are available by clicking "The Funds" menu button from any page of this website. |
|||||||||||||||||||||||||
|
For more information about investing in the Hussman Funds, please call us at
1-800-HUSSMAN (1-800-487-7626) 513-326-3551 outside the United States Site and site contents © copyright Hussman Funds. Brief quotations including attribution and a direct link to this site (www.hussmanfunds.com) are authorized. All other rights reserved and actively enforced. Extensive or unattributed reproduction of text or research findings are violations of copyright law. Site design by 1WebsiteDesigners. |

