|
|
||||||
|
|

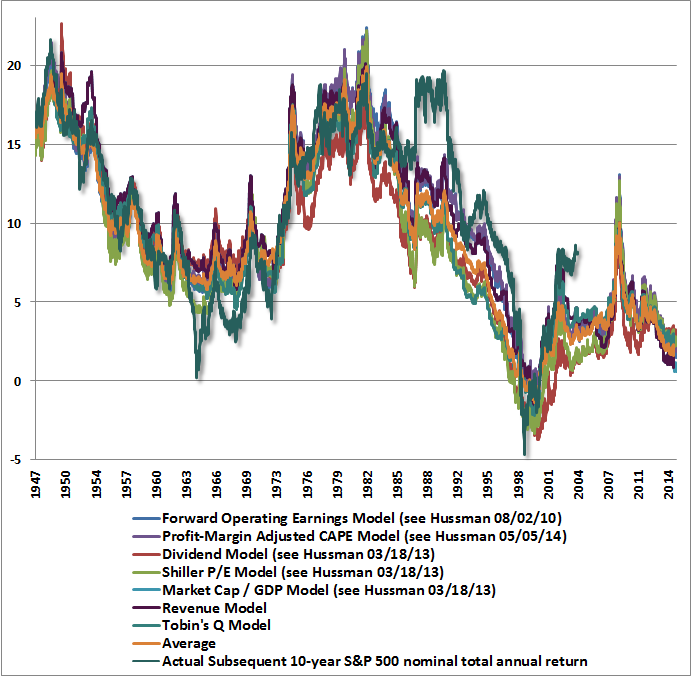
March 16, 2015 Extremes in Every Pendulum Whether or not it is fully appreciated, we are observing extremes in nearly every pendulum of the global financial markets. The situation is likely to be seen in hindsight as one of the broadest points of financial distortion in history. Broadest, because unlike the 2000 peak when technology and large capitalization stocks were more overvalued on reliable measures than they are today, the median stock is now more overvalued than in 2000. It’s true that on historically reliable valuation measures that are best correlated with actual subsequent total returns on stocks, the 2000 peak remains the most overvalued point for the S&P 500 in U.S. history, though only about 20% above present valuation levels on those measures (there are certainly many popular but unreliable measures that suggest only moderate overvaluation here). Aside from that 2000 peak, the S&P 500 itself is now more overvalued than at the 1929 peak, not to mention the lesser 1972, 1987 and 2007 extremes. We estimate that the S&P 500 Index is likely to be below its present level a decade from now, though adding dividends is likely to raise the nominal total return to about 1.6% annually on a 10-year horizon. The chart below presents our estimates of prospective 10-year S&P 500 total returns based on a variety of historically reliable measures. See Ockham’s Razor and the Market Cycle to review the arithmetic underlying these estimates. You’ll notice that there are a few points where actual 10-year market returns were different from those that were projected by these methods a decade earlier. The most extreme among those points are 1964 (when actual market returns over the following decade were lower than expected), 1988-1990, and 2005 (when actual market returns over the following decade were higher than expected). Those differences are informative, because they highlight points where market valuations – instead of normalizing – reached historic extremes at the end of the 10-year projection horizon (1974, 1998-2000 and 2015, respectively). The 1974 low and the 1998-2000 peak are memorable for being two of the most extreme points in U.S. market history. We expect nothing less for 2015. See last week’s comment What Does that Difference Mean? for more discussion.
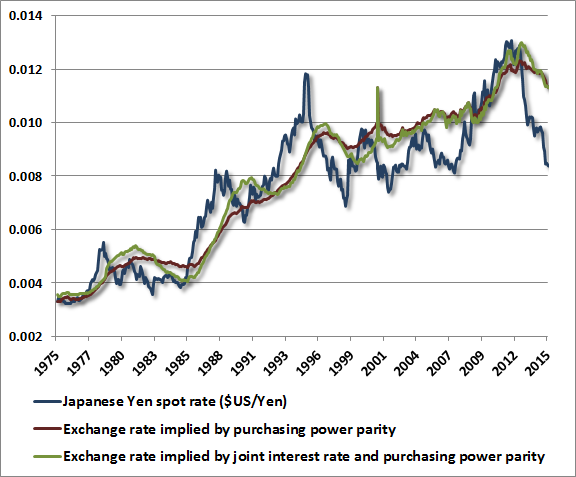
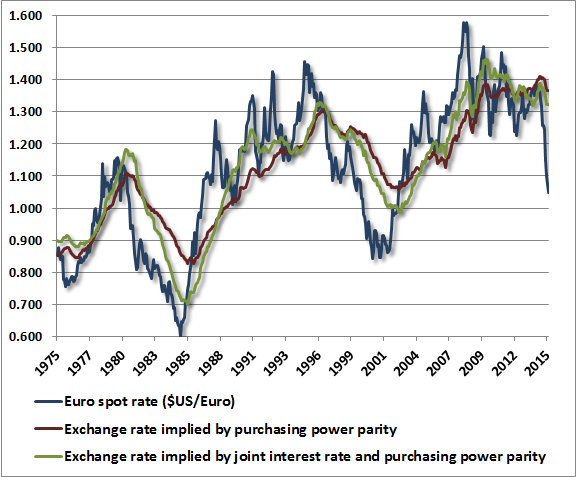
Next, consider the bond market. Unlike 2000, when 10-year Treasury yields of 6.5% still offered somewhere to hide, the present environment offers bond yields to investors that are scarcely higher than 2% in the U.S., with German yields at negative levels even beyond a 5-year maturity. In recent years, yield-seeking speculation has encouraged record issuance of junk debt and “covenant lite” leveraged loans (loans to already highly-indebted borrowers). This is simply a different iteration of what we observed prior to the mortgage crisis, when the yield-seeking security of choice was mortgage debt, and Wall Street’s rush to create more “product” fueled a speculative housing boom as credit was extended to borrowers lacking durable creditworthiness. The current episode is likely to end just as badly, though even more concentrated on the equity market, as a primary object of speculation in recent years has been debt issuance for the purpose of leveraged buyouts and equity buybacks, all of which looks fine only while historically volatile corporate profit margins remain extended at cyclical extremes. On a related note, it’s tempting to believe that low interest rates “justify” elevated equity valuations. But as one can show with any straightforward discounting method, even another 5 years of zero short-term interest rates (compared with a more typical 4% short-term yield) would only justify valuations about 20% above historical norms – essentially 5 years x 4%. Instead, current U.S. equity valuations are about 112% above historical norms on reliable measures. To justify current equity market valuations, interest rates would need to be held at zero for the next quarter century. Understand that while suppressing short-term interest rates may encourage yield-seeking speculation that results in rich stock valuations, those rich valuations are still followed by dismal subsequent returns. Emphatically, low interest rates do not raise the future return on stocks – quite the contrary. Meanwhile, with the Japanese and European central banks still pursuing quantitative easing (despite virtually nothing to show for those efforts), and the Federal Reserve winding down its own reckless program, the perceived difference between foreign and U.S. monetary policies has resulted in a capitulation wave of selling in foreign currencies. While the weakness in the Japanese yen and the euro can be accounted for through fear, extrapolation, and appeal to simplistic but empirically unsupported “quantity theories” of money, this panic to sell foreign currencies has produced the most extreme and measurable valuation gap since fixed exchange rates were abandoned in the 1970’s. That valuation gap can be measured by accounting for factors that have explained currency movements quite well over time: relative price levels and interest rates. The charts below show the position of the Japanese yen and the euro relative to our “joint parity” estimates of their value (see Valuing Foreign Currencies for a review of this approach). Importantly, we do not believe that purchasing power parity holds in the short run – it is decidedly a long-term regularity. Instead, we believe that currency values deviate from purchasing power parity based on expected cumulative real interest rate differences, and that deviations beyond these levels are a key driver of subsequent returns. We certainly could see more capitulation in the yen and the euro, and even larger deviations from our estimates of fair value, but currency values tend to revert toward their joint parity values in the intermediate term. We strongly expect that investors selling foreign currencies against the U.S. dollar here will regret that decision within a few quarters.
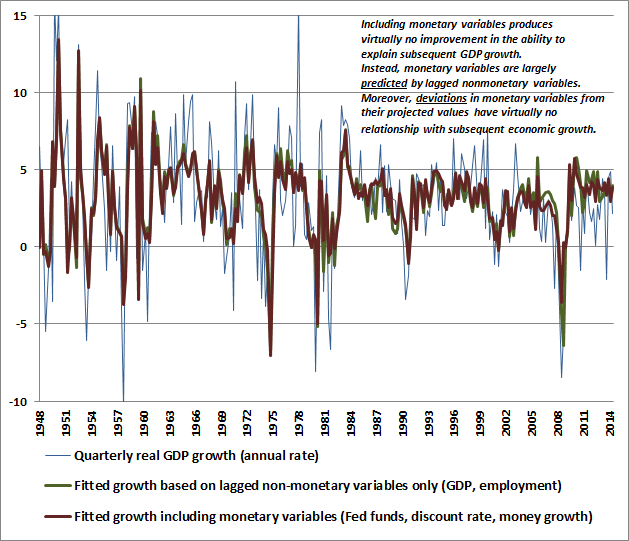
Again, it’s tempting to think about currencies in simplistic terms, assuming that the quantity of the currency is all that matters for valuation, and therefore that quantitative easing in Japan and Europe, coupled with less accommodative policy in the U.S., should result in unending depreciation in foreign currencies. Just as elevated equity valuations in recent years haven’t prevented even further speculative extremes, we can’t rule out the possibility that investors will continue to act on a simplistic mindset that results in massive undervaluation of foreign currencies and overvaluation of the U.S. dollar on the foreign exchange markets. Rather, our assertion is that the deviations of prices from valuation norms mean something about subsequent returns, particularly over the complete cycle. Because the present extreme in the global financial markets couples extreme U.S. equity valuations with extreme overvaluation of the U.S. dollar, we view investment prospects for U.S. stocks as even worse from the standpoint of foreign speculators as they are for U.S. speculators (neither can aptly be considered investors at these valuations). Fed policy, Granger causality, and the intensity-matching fallacy The elephant in the room at present is the prospect of an interest-rate hike by the Federal Reserve, which is generally, though not universally, expected at some point between June and September of this year. Last week, recently retired Fed Governor Richard Fisher spoke at the Baker Institute for Public Policy at Rice University. He observed: ‘In a recent speech to the Economic Club of New York, I quoted Mae West: ‘I generally avoid temptation,’ she said, ‘unless I can’t resist it.’ I think I am safe in saying that Janet Yellen is no Mae West. I leave the Fed with the high expectation that she will ably lead the FOMC down the path of normalizing monetary policy and resist any temptation to delay for too long that path-changing task.” From my perspective, it remains unclear whether the Fed will resist the temptation to defer hiking interest rates, given what we observe as a deteriorating economic landscape. Even so, the single most important action that the Federal Reserve should take is to immediately discontinue the reinvestment of principal as assets on the Fed’s balance sheet mature. The Fed would have to contract the balance sheet by about $1.4 trillion before that contraction had any effect at all on the level of short-term interest rates. The sole impact of maintaining the balance sheet at its current size is to create a massive pile of zero-interest hot-potatoes that encourage yield-seeking speculation, while reinvestment nearly ensures net capital losses in any reasonable scenario of policy normalization. Though a small increase in the interest rate paid on reserves might be important for investor psychology (given that the primary force behind the speculation of recent years has been the sense that zero interest rates provide no alternative but to speculate), there is simply no evidence to expect any material economic impact from a small increase in the federal funds rate. The primary effect on the money markets would be to encourage conversion of currency into interest-bearing bank reserves, drawing a larger pile of idle money into the banking system. On the question of how monetary policy affects the real economy, the chart below is based on the concept of “Granger causality.” If monetary policy actually “causes” changes in the economy, then monetary variables should materially improve the ability to explain changes in the economy, compared with economic predictions based solely on non-monetary variables. The thin blue line is quarterly real GDP growth at an annual rate. The green line shows projected GDP based on lagged values of previous non-monetary variables (prior GDP growth, employment growth, and the ISM purchasing managers index). The nearly identical red line shows projected GDP growth with monetary variables (Fed funds, discount rate, money growth) included. While one can’t strictly rule out a weak statistical effect of monetary variables, that effect is almost meaningless from an economic standpoint, explaining just over 1% of the difference between actual GDP growth and growth that would have been predicted using non-monetary variables alone. The largest exception was 1981, when monetary variables would have helped considerably in anticipating the 1981-1982 recession that followed Paul Volcker’s monetary tightening to combat inflation. By contrast, considering monetary variables would have provided a false sense of hope prior to the 2008-2009 collapse, as the Federal Reserve was already easing rates in late-2007, before the stock market peaked and the economy slumped into recession.
Notice that actual economic performance since 2009 has generally been weaker than the baseline growth that one would have predicted from past values of non-monetary variables. Monetary policy has not been useful in accelerating economic growth – the main effect has been to distort the financial markets. Considering the weak true historical correlation between monetary variables and subsequent economic growth, we should not have expected that monetary policy would have much economic effect anyway. Now, many economists are well aware that there is virtually no historical correlation between monetary variables and subsequent economic performance. This gives rise to the so-called thermostat argument. If a thermostat is doing its job at maintaining the temperature of a home, then variations in the activity of the heating and air conditioning system should be uncorrelated with the constant temperature. Similarly, if a gas pedal is doing its job at keeping the speed of a car constant, the pedal may go down when the car encounters an uphill climb, and ease back when the car encounters a downhill stretch, but the movements in the pedal should be uncorrelated with the constant speed of the car. While this argument is an interesting curiosity (and offers a nice refresher on the implicit function theorem if you’re a geek like me), the fact is that GDP is anything but stable. Moreover, monetary variables can be largely predicted by lagged values of non-monetary variables, but deviations in monetary variables from those predicted values have no correlation with subsequent economic activity. So even If monetary policy is a thermostat, it is in great need of a replacement, most probably by a variant of the Taylor Rule. So why do policy makers so wildly overestimate the real economic effects of monetary policy (while vastly underestimating its effects in distorting financial markets)? In his book, Thinking, Fast and Slow, psychologist and Nobel laureate Daniel Kahneman describes the biases and rules-of-thumb that people often use to estimate the impact of one piece of information in explaining another. When presented with some piece of evidence, some judgements rely on precise calculations and historical estimates. Others, Kahneman writes, “arise from the operation of heuristics that often substitute an easy question for the harder one that was asked... As a result, intuitive predictions are almost completely insensitive to the actual predictive quality of the evidence.” Kahneman describes the way that these intuitions give rise to inaccurate predictions. First, some piece of evidence – the stance of monetary policy – is provided. The associative memory quickly constructs a story that links the evidence to whatever is to be predicted – the most likely story being that easy monetary policy will boost the economy, while tight monetary policy will slow it. The next step, says Kahneman, is “intensity matching.” The flimsy evidence is ranked in intensity, and that same intensity is used to produce the forecast for the variable to be predicted. So regardless of whether monetary policy is actually correlated with the economy or not, we naturally assume that extreme monetary policy should have similarly extreme effects on the economy, and in the expected direction. As Kahneman writes, “Intensity matching yields predictions that are as extreme as the evidence on which they are based, leading people to give the same answer to two quite different questions.” In this case, one question is “how easy is monetary policy?”, while the other is “where is the economy headed?” The problem here is that the quality of the evidence – the strength of the correlation – is not being considered. Kahneman offers a way to improve on these intuitive predictions. In the present context, that method would go something like this: 1) Start with an estimate of baseline economic growth that would be expected in the absence of any monetary intervention; 2) Estimate the rate of economic growth that best seems to match the intensity of monetary policy; 3) Estimate the actual correlation between monetary policy and economic growth (hint: about 0.15); 4) If the correlation is 0.15, move 15% of the distance from the baseline GDP growth to the GDP growth matching monetary policy. Geek’s note: You can show statistically that if Zy and Zx are standard normal variables (where, for example, Zy is just the variable minus its mean, divided by its standard deviation), Kahneman’s formula gives the best linear estimate of Y given X, since the beta in a regression of Zy on Zx is just the correlation between the two. To illustrate, the mean of quarterly real GDP growth is 3.2% at an annual rate, with a standard deviation of 3.9%. The historical mean of the federal funds rate is about 4.9%, with a standard deviation of 3.9%. So holding the fed funds rate at zero is a Z statistic of -1.25. With a correlation of -0.15 between fed funds and subsequent GDP growth, at best, this translates to a Z statistic for GDP of 0.19, and multiplying by the standard deviation of GDP suggests that holding Fed funds at zero (instead of 4.9%) would be expected to provide a bump to real GDP growth of about 0.7% annually. Of course, nobody would expect a 4.9% Fed funds rate here in the first place, so we need one more step. See, much of the variation in monetary variables and GDP growth is unexplained by prior values of non-monetary variables alone. So part of the movement in monetary variables might follow some linear policy rule based on recent changes in the economy, and we should allow for that (basically the thermostat theory). What we're most interested in is the effect of departures from that rule, since the appropriate Fed funds rate - based on statistical estimates, as well as the Taylor Rule - is about 3.4% here, compared with the Fed's activist target of zero. When we examine nearly 70 years of data, what we find is this. Deviations in monetary policy from what one would have predicted (using past non-monetary variables alone) have practically zero correlation or ability to explain subsequent GDP growth (versus the levels that would have been predicted by past non-monetary variables alone). In other words, once we allow for the component of monetary policy captured by a fixed linear rule (the Taylor Rule comes pretty close), one can find no evidence in the historical record that additional activist monetary policy is useful. Now, we certainly believe that the Fed has a legitimate and important role in providing liquidity to solvent banking institutions during banking panics - the lender of the last resort role. During the financial criisis, our preference would have been for the Fed to follow Bagehot's Rule (lend freely to solvent insitutions, but at a relatively high interest rate that encourages prompt repayment instead of creating a subsidy). Interestingly, if you look at what Warren Buffett did during the crisis, he was Bagehot personified - providing capital via preferred stock offering him a high yield. But what the Fed has done in recent years goes beyond lender of the last resort to solvent but liquidity-strapped institutions. It does nothing but distort the financial markets, and there is no evidence that such departures from a standard policy rule have any effect on the real economy. How much impact should we expect a 0.25% increase in the fed funds rate to have on economic growth? 0.25% is only an increase of 0.06 standard deviations in the fed funds rate, which would at best be associated with -0.15 x 0.06 = -0.009 standard deviations in GDP growth. So based on the historical relationship between the fed funds rate and subsequent GDP growth, the impact of a quarter-point hike in the fed funds rate would be expected to be a reduction in GDP growth of just four one-hundredths of one percent below what would otherwise be expected in the absence of that change. The floor quietly drops away While we don’t expect near-term tightening in Fed policy to have any material impact on the U.S. economy, we also would not expect fresh easing to help materially. Non-monetary factors have dramatically more effect on economic output than monetary factors do, and non-monetary factors are deteriorating fast. Unfortunately, this is where we believe investors are wholly unprepared. As I noted several weeks ago (see Market Action Suggests Abrupt Slowing in Economic Activity): “The combination of widening credit spreads, deteriorating market internals, plunging commodity prices, and collapsing yields on Treasury debt continues to be most consistent with an abrupt slowing in global economic activity. Generally speaking, joint market action like this provides the earliest signal of potential economic strains, followed by the new orders and production components of regional purchasing managers indices and Fed surveys, followed by real sales, followed by real production, followed by real income, followed by new claims for unemployment, and confirmed much later by payroll employment. Stronger conclusions, particularly about the U.S. economy, will require more evidence, but from a global perspective, these pressures are already quite evident.” Since then, we’ve observed material shortfalls in the new orders and production components of regional purchasing managers’ indices and Fed surveys, a striking miss in real sales, and a miss in industrial production. Against these, many observers have drawn a great deal of optimism from the continued low level of new claims for unemployment, and from generally strong payroll employment growth. It is important to understand that these employment measures are significantly lagging indicators. The problem is that many observers treat all data as if it is coincident or even predictive about the economy. They see a good employment number and believe it’s informative about where the economy is going, not realizing that the job figures and unemployment rate are the two most lagging indicators in the arsenal. It takes time between the decision to seek a new employee and the date the employee is actually recruited and begins work. Likewise, termination decisions take time because of notice requirements and other processes. Employment figures essentially confirm what the economy was doing 3-5 months ago. While we don’t view recent economic deterioration as sufficient to expect a recession (at least at present), a significant shortfall in the personal income figures in the months ahead, coupled with further weakening in the purchasing managers index and a decline in the S&P 500 much below 2000 would significantly increase these concerns. In the meantime, the Atlanta Fed publishes an estimate it calls GDPNow, reflecting the ongoing receipt of new data throughout the quarter, in an attempt to provide a more timely view of GDP growth as it develops. Last week, that estimate plunged to an expectation of just 0.6% growth rate of real GDP for the first quarter of 2015.
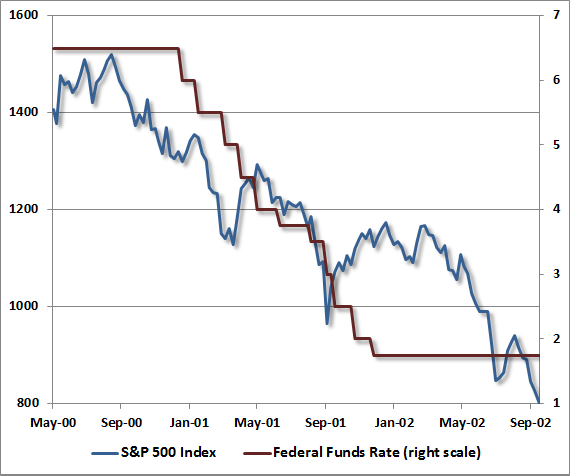
So while Wall Street focuses on the Federal Reserve, trying to guess when some tiny quarter-point tightening will take place, the economic evidence suggests that non-monetary factors should be our primary focus, and that monetary changes are unlikely to have much impact on the real economy. Similarly, investors and speculators seem fully confident that the stock market will remain safe until and unless the Federal Reserve tightens policy. On this subject, history begs to differ. The first chart below shows the 50% market plunge from 2000 to 2002. Note that the Federal Reserve was not tightening, but easing – and easing aggressively – throughout that plunge. Don't fight the Fed, indeed.
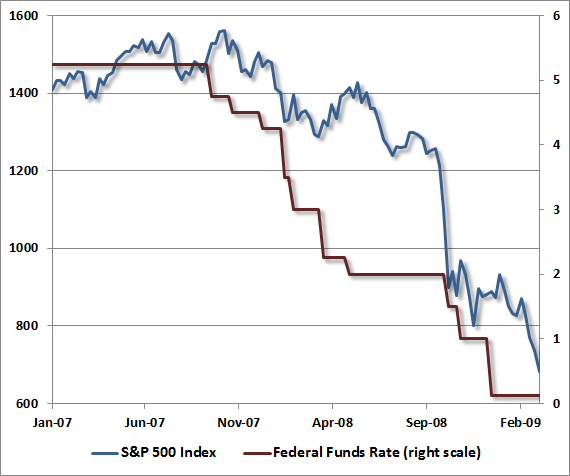
Likewise, the chart below shows the 55% market plunge from 2007 to 2009. Note that the Federal Reserve began easing weeks before the 2007 market peak, and eased monetary policy aggressively all the way down.
The upshot is that monetary policy is a very mixed bag, and many popular and strongly-held views about it are baseless or overly simplified. While decades of historical evidence suggest that there is quite a weak link between monetary policy and real economic activity, we emphatically believe that Fed policy has enormous capacity to distort the financial markets and misallocate resources by encouraging yield-seeking speculation. Those distortions and misallocations ultimately have a far greater real economic impact than Fed policymakers imagine. That is a lesson we should have learned from the global financial crisis. The second essential lesson, and one that emerged from a very difficult transition for us, is that the response of investors to Fed policy, and even to extreme overvaluation, is enormously dependent on the condition of investor preferences toward risk, which can be inferred from observable market internals and credit spreads. The reason that easy monetary policy was unable to stop the collapse of the markets in 2000-2002 and 2007-2009 is that investors had already turned risk averse – something that could be inferred from observable market action and credit spreads. In contrast, the reason that overvaluation was unable to stop the speculation during the past several years is that investors were persistently risk-seeking – something again, that could be inferred from observable market action and credit spreads. The problem for investors here is that market internals and credit spreads continue to indicate a shift toward increased risk aversion that has not yet reversed. Given deteriorating economic fundamentals, and extremely overvalued, overbought, overbullish financial markets, this creates deep potential risk. If market internals and credit spreads improve, and suggest a fresh shift toward risk-seeking speculation, our downside concerns would be deferred despite what we view as strenuous overvaluation. At present, we don’t really see a floor. Obscene valuations make for misleading case studies As long-term readers know, the period from 2009 through mid-2014 reflected a very awkward transition from our pre-2009 methods and our present methods of classifying market return/risk profiles. The full narrative can be found in the December 2014 comment Hard-Won Lessons and The Bird in the Hand. I’ve often heard that I detail that period, and the lessons learned from it, too often. Possibly, but my view is that if an investor happens to be reading our work for the first time, they should know where we’ve stumbled, and how we’ve addressed it. I know I’d appreciate the same candor if that investor was me. What strikes me as less useful, at record highs and obscene valuations, is the strained attempt to make our experience during the advancing half-cycle since 2009 into some sort of “lesson” against strategies that depart from a passive buy-and-hold approach, or against evidence-based investment disciplines that might avoid the losses that investors have repeatedly experienced after similar speculative episodes across history. See Plan to Exit Stocks in the Next 8 Years? Exit Now to see how equity markets have fared under return/risk conditions that match what we presently observe. I wrote the following to a journalist last week. For those who value our work, I’d like share those views: "Our investment strategy has remained constant – to align our investment stance in proportion to the market return/risk profile that we estimate at each point in time. What changed were the methods we use to estimate that market return/risk profile, based on my insistence that they should be robust to both post-war and Depression-era data. My concern about the Depression was that 2009-like valuations were followed by a further two-thirds loss in the market, and our existing methods – despite doing fine through the period as a whole – would have experienced two separate interim losses approaching 50% each. As I noted in dozens of weekly comments and reports during this period, we called this our “two data sets” problem, which led us to introduce ensemble methods in late-2010. The knock-on problem was then that the ensemble methods didn’t capture a bubble-tolerant feature that was part of the pre-2009 methods, which enforces a tolerance for overvalued markets provided certain measures of investor risk-seeking are in place (which we infer from market internals). In short, that insistence on stress testing triggered a long transition as we solved a series of data-driven problems. "My sense is that we are not a particularly informative example of much at the moment. Kurt Vonnegut once described a story narrative he called Man in Hole – 'Somebody gets into trouble; gets out of it again. People love that story. They never get sick of it' (wonderful presentation here). Given that I believe we’ve addressed our difficulties in the advancing part of this cycle (which admittedly began with my fiduciary but poorly timed insistence on stress-testing our methods), I expect there will be a time to tell that story, most likely after the present half-cycle is completed by consequences that have historically followed other episodes of speculative yield-seeking. Market conditions will change, the prospective market return/risk profile will improve, and we’ll have fresh opportunities to become constructive (as we became in early 2003 after the tech crash that we anticipated, as well as late-2008 after the financial crash that we anticipated; although my stress-testing decision shortened that 2008 shift). I realize that it’s tempting to cite me as a case-study against market timing. While it’s currently accurate to cite me as a case-study against ill-timed stress testing decisions, my expectation is that we’ll come out at the end of this cycle as we have in other cycles, as a case-study for value-conscious, historically-informed discipline." The foregoing comments represent the general investment analysis and economic views of the Advisor, and are provided solely for the purpose of information, instruction and discourse. Please see periodic remarks on the Fund Notes and Commentary page for discussion relating specifically to the Hussman Funds and the investment positions of the Funds. --- The foregoing comments represent the general investment analysis and economic views of the Advisor, and are provided solely for the purpose of information, instruction and discourse. Prospectuses for the Hussman Strategic Growth Fund, the Hussman Strategic Total Return Fund, the Hussman Strategic International Fund, and the Hussman Strategic Dividend Value Fund, as well as Fund reports and other information, are available by clicking "The Funds" menu button from any page of this website. |
|||||||||||||||||||||||||
|
For more information about investing in the Hussman Funds, please call us at
1-800-HUSSMAN (1-800-487-7626) 513-326-3551 outside the United States Site and site contents © copyright Hussman Funds. Brief quotations including attribution and a direct link to this site (www.hussmanfunds.com) are authorized. All other rights reserved and actively enforced. Extensive or unattributed reproduction of text or research findings are violations of copyright law. Site design by 1WebsiteDesigners. |