|
|
||||||
|
|

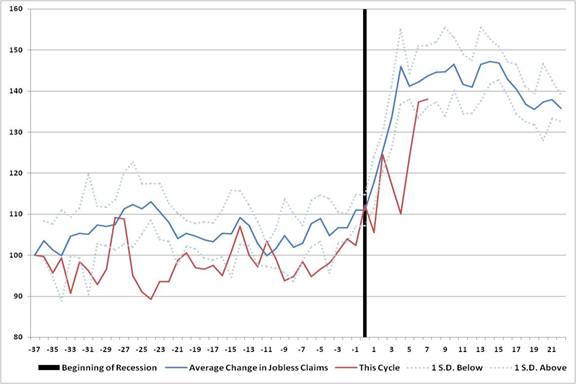
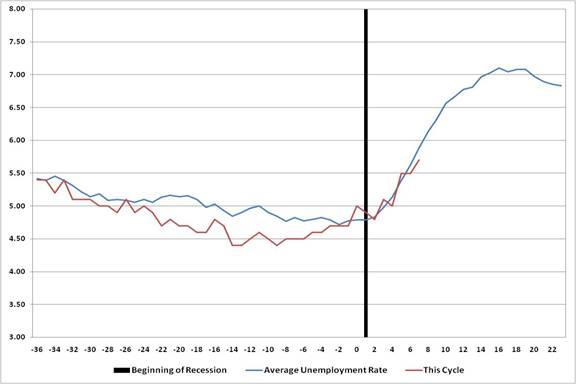
The Beginning of the Middle The suspected U.S. recession is increasingly confirmed by the data Investors may soon learn that the economy is officially in recession. That's because since 1980, the arbiter of that decision - the NBER - has marked the economy's peak publicly an average of 7 months following each contraction's start. The group has marked recessions as early as 5 months from the economy's peak, and no later than 9 months after. Looking at the data most clearly exhibiting recession-like behavior implies that the economy entered into recession late last year or early this year. That suggests an announcement from the NBER may come sometime over the next couple of months. The actual announcement will matter less than how deep the recession turns out to be, and how long it lasts. In some ways this recession is atypical. House activity turned down long before it typically has prior to previous economic contractions. Corporate earnings - mostly as a result of write downs in the financials - have also turned down earlier than usual. But other indicators are on time when compared to previous recessions. Below I've updated a few of the charts that I've written about in previous research pieces. The first set of charts is from a March report titled Recession and the Duration of Bad News. The charts show the average change in this set of economic indicators around the peaks of the business cycle. The blue line in each chart represents the average change in the data series over a five-year period, beginning 36 months prior to the beginning of each past U.S. recession. The light blue lines represent one standard deviation above and below the change in the data series. The red line shows the change in the data for the current cycle, assuming the economy entered into recession in January. In the first chart the average and current cycle lines are cumulative changes from a base of 100. The second chart shows the average unemployment rate. The vertical black line marks the start of a recession. The last 9 recessions are included, where data for the economic series is available.
If we date the beginning of the recession in January, Jobless Claims data are a few weeks behind schedule, but they've been rising quickly of late (dating the beginning of the recession in March overlaps recent data with the average nearly perfectly). After rising gradually through the first part of the year, the data have now jumped above 400 thousand for four straight weeks. Jobless claims may slow the rate of their ascent from these levels and begin to level off. If the data matches the typical behavior during previous recessions , jobless claims may stay elevated through the beginning of next year.
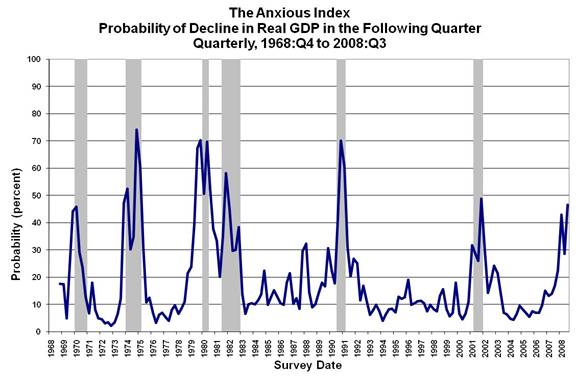
The unemployment rate is also sticking close to history. After bottoming early last year at 4.4 percent, the unemployment rate rose to 5.7 percent in July. If the data continues to match previous recessions, the rise is only about a third of the way through. This poses risks to the outlook of consumers and business executives (both with already fairly dismal expectations). This is because the peak in the unemployment rate expected by economists differs substantially from the trends of previous recessions. In Bloomberg's survey of more than 70 economists the median forecast for next year's second quarter unemployment rate is 5.9 percent. If the unemployment rate continues to trace history, a 7 percent rate is implied. Economists are coming around to the idea that the economy is in recession, or will soon be heading into one. This week the Philadelphia Federal Reserve released its quarterly Survey of Professional Forecasters which collects forecasts from a diverse - and importantly, anonymous group of economists. The question in the survey that tracks the forecasted probability of negative growth in the next few quarters - colloquially named The Anxious Index - showed an important change in this week's release. The survey reported that forecasters believe that there's a 47 percent chance of negative growth in the fourth quarter of 2008, up from just 30 percent in the last survey. The probability has never been this high outside of a recession. (Data is courtesy of the Philadelphia Fed.)
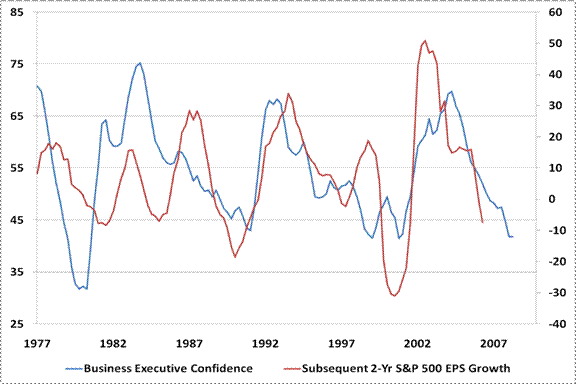
It's difficult to make the case that stock analysts are anywhere near as anxious. In the fourth quarter of 2008 - the same 3-month period for which economists are expecting the economy to contract - stock analysts are forecasting that S&P 500 Index earnings will grow by 46 percent, according to Bloomberg data. A bulk of that is derived from an expected rebound in earnings from the financials group. But even ex-financials, earnings are expected to grow 14 percent in the fourth quarter, and then by 16 percent in the first quarter of 2009. Earnings may not trough until the first quarter of next year, if this recession matches the average change in earnings around recessions. Other indicators are pointing in the same direction. The graph below is from Record Profits Don't Excite Corporate Executives and it shows that there is a correlation between the outlook of executives and subsequent profit growth. Corporate executives (blue line, left scale) haven't been this downbeat since the last recession. Based on the scales in the graph, corporate profit normally overshoots executive pessimism on the downside.
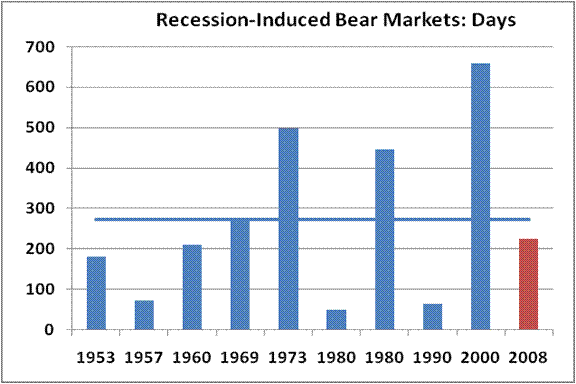
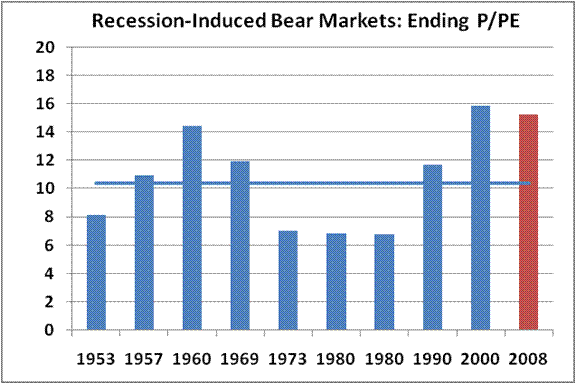
Recession-induced Bear Market Update Even though some of the economic data is closely following traditional recessionary patterns, the stock market has historically demonstrated more variation from one recession to the next. Even so, it can be helpful to put the current decline in context by comparing it with previous recession-induced bear markets. The bar charts below update the data from September's research, Recessions and Stock Prices .
Since the market's top in October, 224 days have passed. This makes the duration of the current bear market shorter than the average recession-induced bear market, which tend to be longer in duration than 'stand alone' declines. If this decline runs the average duration of past recession-induced bears, we could observe the bottom in October. It would be in good company, as a third of all recession-induced bear markets since 1953 have ended in October, but of course, there is far too much variation to place much faith in that outcome. Recession-induced bear markets not only tend to last longer, but the average decline is also greater. The decline during the current bear market thus far is still well short of the average loss for prior bears. The last bar chart is the least encouraging, especially for investors who assume that the market's July low represented a favorable valuation for a bear market bottom. If July turns out to be the low point for this bear market, it will then mark the second highest level of valuation that a cyclical bull has ever started from (the highest starting valuation level was in 2003). The risks are material if this bear market was to end at the average price-to-peak earnings multiple of past recessionary troughs. For the price multiple on peak earnings to touch the long-term average of 10.4, the S&P would need to fall to 885.
Overlaying current trends in economic data with past recessions implies that the economy is entering the beginning of the middle stages of an economic contraction. Weak job-related data should be expected until at least early next year. Also, earnings may be slower to rebound than analysts expect, putting pressure on stock valuations that are better, but are still uninspiring. --- The foregoing comments represent the general investment analysis and economic views of the Advisor, and are provided solely for the purpose of information, instruction and discourse. Prospectuses for the Hussman Strategic Growth Fund, the Hussman Strategic Total Return Fund, the Hussman Strategic International Fund, and the Hussman Strategic Dividend Value Fund, as well as Fund reports and other information, are available by clicking "The Funds" menu button from any page of this website. |
|||||||||||||||||||||||||
|
For more information about investing in the Hussman Funds, please call us at
1-800-HUSSMAN (1-800-487-7626) 513-326-3551 outside the United States Site and site contents © copyright Hussman Funds. Brief quotations including attribution and a direct link to this site (www.hussmanfunds.com) are authorized. All other rights reserved and actively enforced. Extensive or unattributed reproduction of text or research findings are violations of copyright law. Site design by 1WebsiteDesigners. |