|
|
||||||
|
|

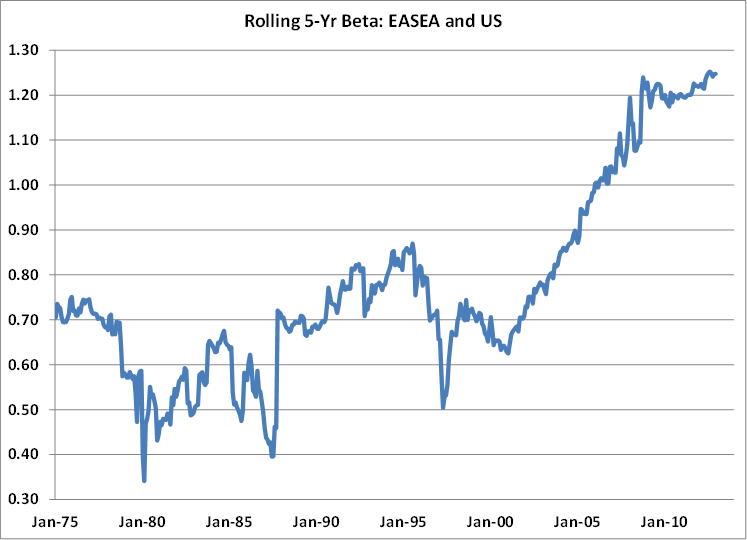
Fed Leaves Punchbowl, Takes Away Free Lunch (of International Diversification) The growing importance of country selection A quiet but important development in global investing over the last few years has been the shift in the relationship between US markets and other global benchmarks. It’s widely known that correlations have been rising over the last few decades. Less discussed though is the shift in the changing sensitivity of international stocks versus US benchmarks. Both of these changing relationships are turning decades of global diversification arguments on their head. Diversification into international equity markets by US investors has relied on one constant benefit: better portfolio risk attributes. Higher returns were also sometimes achieved by US investors – but they were time dependent. During the 15-year period through 1985, international stocks would have boosted the returns of a diversified portfolio versus a portfolio allocated to only US stocks. But during the next 15-year period international stocks would have instead weighed on the performance of a diversified portfolio. The constant benefit of international equity diversification has been the lower risk experienced by portfolios that combine domestic and international markets. These risk attributes were the result of low correlations and low betas between broad global benchmarks and the US markets. During the 1980’s the correlation between MSCI’s EASEA Index (this index tracks the performance of countries in MSCI’s EAFE Index without the effects of Japan) and MSCI’s US Index was about .5. Over the last decade it’s been .8. And, recently, because the volatility of international markets has increased in relation to US markets, along with rising correlations, the beta of global markets relative to US markets has jumped by an even greater extent. The best way to think about the performance of international stocks over the last few years is as high beta investments relative to the US market. The graph below shows the rolling 5-year beta between MSCI’s EASEA Index and MSCI’s US Index. It’s clear that there has been a substantial shift in the beta of international benchmarks versus the US since the beginning of last decade.
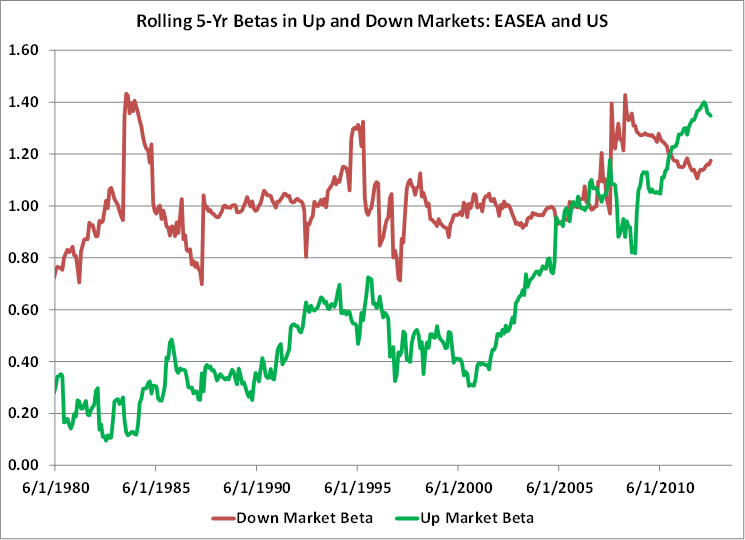
A look into what’s driving this change in sensitivity highlights some interesting and potentially unexpected relationships. Specifically, we can ask whether the higher beta of international stocks relative to domestic stocks has come during periods of rising or falling markets. It’s generally well known that during stock market declines, correlations among global markets rise, which will typically boost betas. (One way to define beta, in this context, is: Correlation of International and US Benchmark * [Standard Deviation of International Benchmark / Standard Deviation of US Benchmark]. So even with constant levels of volatility, higher correlations will boost the beta between benchmarks). And the beta of international stocks has risen in down months in recent years. What’s been making a larger impact more recently, though, is the sensitivity of global markets during periods when US markets are rising. The graph below shows the rolling 5-year beta during periods when the US market is rising (in green) and when it’s falling (red).
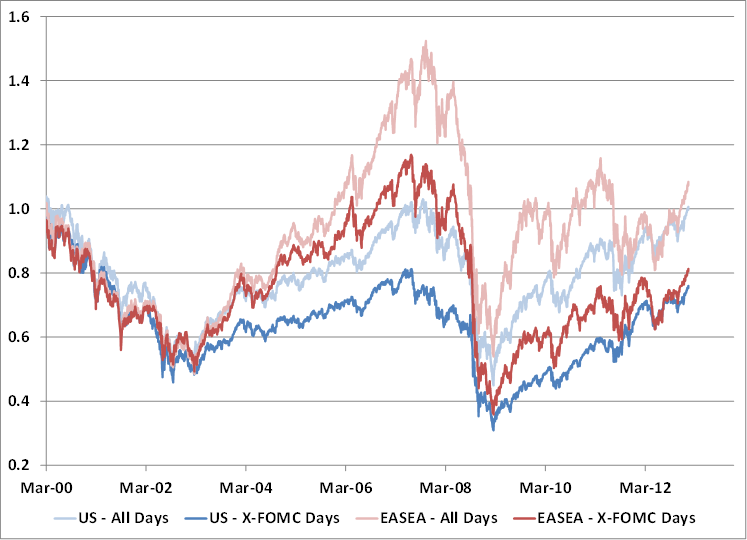
The graph above suggests that the beta between international and US benchmarks has recently risen in both advancing and declining markets. But the larger contributor to the overall recent increase in beta has occurred during periods when the US market is advancing. Why is this? There are a number of explanations for the rising correlation and sensitivity between international and US markets. Economies are increasingly becoming more closely linked. As John Hussman recently pointed out, the correlation between GDP growth in most large developed countries and the US is high - typically between 70 and 90%. Plus, most developed countries are better valued than the US, based on their individual historical range of Cyclically-Adjusted PE ratios. (See An Update on International Markets Valuations. These trends remain in place.) So market advances in other developed countries are beginning from generally better levels of valuation than in the US, spurring greater gains. But some of the recent shift in international beta can also be explained by the concert of central back easings around the world, forcing investors to make investments based on expected monetary policy rather than the individual economic and fundamental corporate performance of each country. Recent research out of the Federal Reserve supports the idea that the beacon that investors are drawn to in making these decisions is the Federal Reserve itself. The FOMC Announcement Drift In a widely quoted paper last year, David Lucca and Emanuel Moench of the Federal Reserve Bank of New York highlighted the performance of stocks during periods surrounding FOMC meetings. They found that since 1994, more than 80 percent of the return from stocks (above risk-free returns) during this period came from a small window of time around FOMC dates. In addition to making the connection between US stock market performance and FOMC dates, the researchers also studied the effects on international markets. There was broad agreement in the data that international markets – including the German DAX, FTSE 100, and the French CAC40 Index – also experienced a bulk of their gains in the days surrounding FOMC meetings. Japan – the last bastion of international diversification, for good or for worse – was the only major stock market index tested that didn’t show a significant FOMC meeting period return. Interestingly, international markets responded more significantly around FOMC meetings, than their own central bank meetings. The graph below shows the role the Fed has exerted on both US and international markets. Ned Davis recently showed a similar chart to his clients that highlighted the performance of the S&P 500 both including and excluding the performance around FOMC meetings. In the chart below, I’ve added the performance of the EASEA index. The blue lines show how the US market has done including the days around FOMC dates (in light blue) and also the performance of the market with the days around the FOMC dates taken out of the calculation (in dark blue). The red lines show the performance of the EASEA including the days around the FOMC dates (in light red) and also the performance of the benchmark with the days around the FOMC dates taken out of the calculation (in dark red).
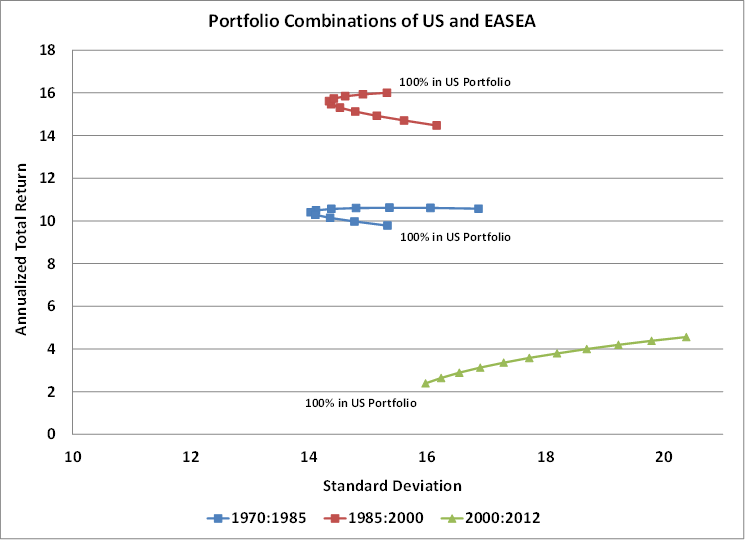
This graph tells a similar message as the earlier graphs. The beta of the EASEA index in relation to the US Index can be seen by the faster advances – and steeper declines. But also, the bulk of returns have occurred around FOMC meetings, just as they have in the US markets. In the case of the EASEA Index, the market is up 8 percent on a price basis since the peak of the market in 2000, but is down 19 percent if the days surrounding FOMC meetings aren’t included. To recap, the secular rise in the correlation of global market returns continues, and the beta of international benchmarks relative to the US has been rising in both up and down markets – but the bulk of that rising sensitivity has occurred when the US market was advancing. And both US markets and international markets have netted the bulk of their advances around FOMC meetings. For investors seeking out the proverbial free lunch of international equity diversification – like returns with lower risk – this doesn’t sound like a favorable shift in trends. And it’s not. Changing Risk Characteristics and International Diversification The role of these changing characteristics in risk measures can be seen in the graph below. It shows portfolios of different combinations of US and EASEA benchmarks, over different periods. Each mark on each curve represents a 10 percent shift in portfolio holdings – from 100 percent of the portfolio in the US benchmark on one end of the line to 100 percent of the portfolio in the EASEA benchmark at the opposite end of the line. The blue curve represents the relationship between return and risk of holding these different portfolios from 1970 to 1985. The red curve covers 1985 to 2000. The green curve covers the time since 2000.
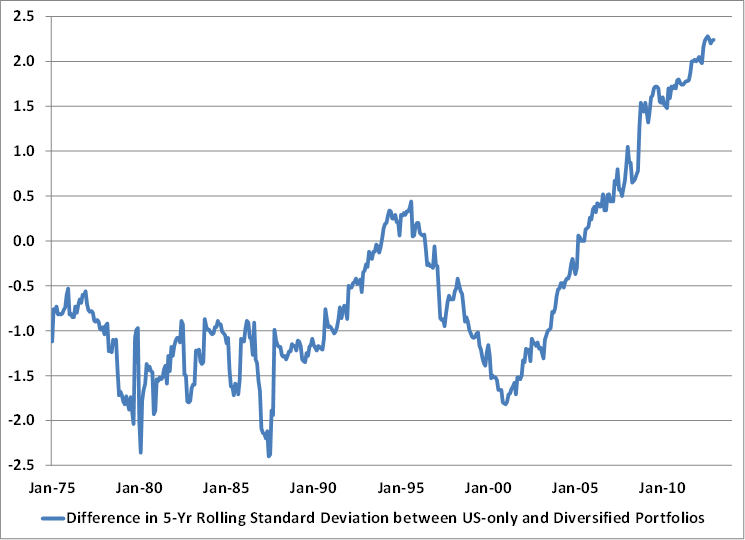
The different heights of the curves (measured by the vertical axis) capture the effects of secular bull and bear markets, and are less important to this analysis. What is important is how different the return and risk characteristics have been in the most recent period compared with history. Typically there has been a reduction in risk by adding EASEA exposure to a US portfolio. During the 1970 through 1985 period, the least risky portfolio was 17 percent less risky than the most volatile portfolio (in this case 100 percent invested in the EASEA Index). During the 1985 through 2000 period, portfolio risk could have been reduced by 11 percent. During the last 12 years, the portfolio results curve climbs upward left to right, implying that international stocks added some extra return, but they did so with much more risk. If these trends continue, many portfolios that were optimized by relying on outdated global stock market relationships could end up delivering poor results. We can show the effects of these changing characteristics another way. As noted above, the one constant benefit of un-hedged international equity diversification has historically been lower portfolio risk. Better returns for US investors have come and gone, but for the bulk of the last 40 years, US portfolios diversified into global markets produced portfolios with lower amounts of risk. That benefit has disappeared. The graph below shows the difference in rolling 5-year standard deviations between a portfolio invested only in the MSCI US benchmark versus a portfolio invested 60 percent in the US and 40 percent in the EASEA index. The graph shows that outside a short period in the mid-1990’s a diversified portfolio always led to lower overall risk. Over the last couple of years, that is no longer the case. The portfolio risk of a diversified equity portfolio has been higher than a US domestic-focused portfolio.
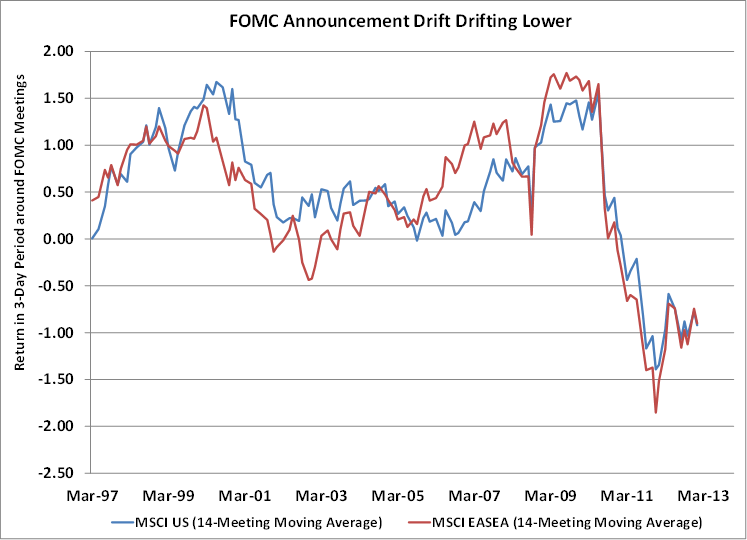
None of this data argues against the benefits of international equity diversification over longer holding periods. The historical lessons Japan offers up on this are clear. The Nikkei Index remains 70 percent below its peak – for buy and hold investors it has been a catastrophically bad investment for more than 20 years. For most of the last two decades, it’s been a combination of periodic profit recessions and persistent price-multiple compression that has continually dragged down the country’s stock market performance. Japan’s history alone should convince investors of the unnecessary level of country-specific risk taken with an undiversified equity portfolio. But now that faith in the Fed has gone global, it’s probably a good time to consider how long these trends will persist. Here are three trends or characteristics of historical data that are worth considering. The FOMC Announcement Drift May Be Disappearing The FOMC Announcement Drift may be about to join a long line of stock market anomalies that once discovered, almost immediately go missing. The graph below shows a 14-meeting moving average of the performance of both the MSCI US and MSCI EASEA Index in the three-day period surrounding FOMC meetings. The trend of strong daily returns can be seen through the middle of 2011, and then drops off noticeably. This may be in part because the Fed’s recent major QE announcements were leaked or slowly assumed into market prices over time, instead of first being announced at a FOMC meeting. But as John Hussman noted last week, the rallies that followed those QE announcements mostly just recovered market declines that had occurred over the preceding 6-month period.
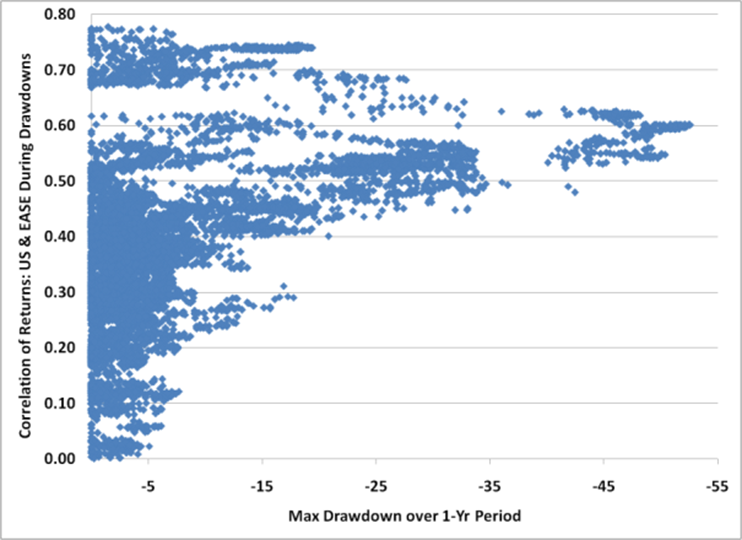
Stock Market Declines & Correlations There are two dynamics of correlation that are working against the diversification benefits of holding un-hedged international investments. The first is the secular rise in the levels of correlation – from 0.4 in the 1970’s, to a recent peak of 0.9 over rolling 6-month periods. The second is how correlations rise in lock-step with the amount of downside experienced in US markets. The graph below shows how markets tend to be more highly correlated the deeper the market drawdown. The horizontal axis shows the maximum drawdown in the US market over prior 12-month periods. The vertical axis shows the correlation of returns of MSCI’s US Index and and MSCI’s EASEA Index in those periods. It shows that as U.S. drawdowns deepen, the correlation among US and international stocks typically grows.
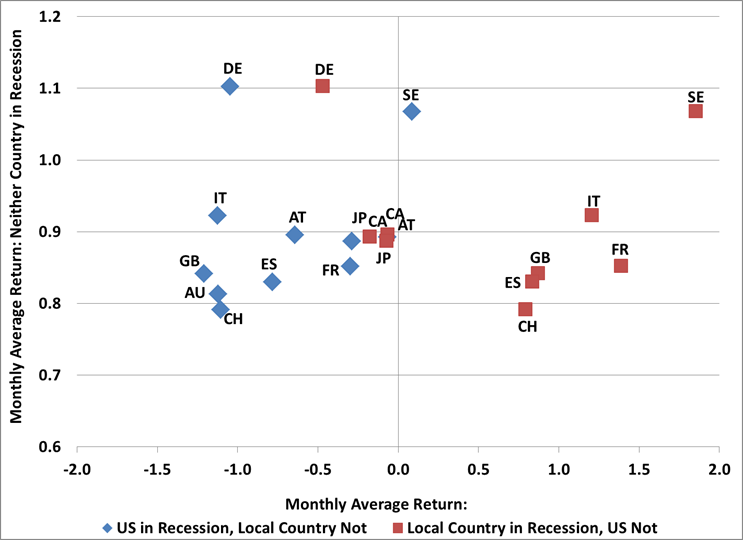
The rise in correlation and beta between global markets and the US essentially heightens the importance of the riskiness inherent in US markets. During moderate pull-backs, investors should expect moderate correlations among global markets. But the greater the risk of a potential large decline in the US market, the more risk there is for international markets as well, and the more likely it is that a larger numbers of countries will participate in further weakness. US Recessions Matter Globally Probably one of the most clearest features of international economic data is that individual country recessions tend to be shared globally. There are a few cases – Japan, clearly being one of them - where countries enter into recession without the company of other countries. But the majority of local recessions coincide with global recessions. The early 1970’s, early 1980’s, early 1990’s, and 2008 all represented global recessions. With Japan, Spain, Italy and the UK are already in - or likely in – recession. The French economy has stopped expanding, and the most recent plunge in the French Purchasing Manager’s Index suggests an economic contraction over the next couple of quarters. The recent improvement in Germany’s PMI should be watched closely, as longer-term measures are pointing to continued deceleration in economic growth. And as more developed countries fall into recession, it becomes increasingly anomalous for the United States not to fall into recession. If the US economy falls into recession this year, what would that mean for the majority of developed countries? Although there is a large amount of overlap among recessions, there are at least some periods where non-US countries fall into recession early, get stuck in a prolonged contraction, or in some cases, have an isolated recession. What is the average performance during these periods? The graph below tries to put this into perspective. The vertical axis measures the average monthly performance of each country when neither that country nor the US economy is in recession. As you would expect, these average monthly returns are all positive. The horizontal axis in the graph also measures the average monthly performance, and separates the recession-linked performance of each country into two categories. The red points represent average returns when the local country is in a recession, but the US is not in recession. The blue points represent average returns when the US is in recession and the local country is not. For example, consider the blue “DE” diamond and the red “DE” square. Both indicate that when neither the U.S. nor Germany has been in recession, German stocks have averaged returns of about 1.1% monthly. The blue square indicates that when the U.S. has been in recession and Germany has not, German stocks have still lost more than 1% monthly, on average. The red square indicates that when Germany has been in recession and the U.S. has not, German stocks have lost about -0.5% monthly.
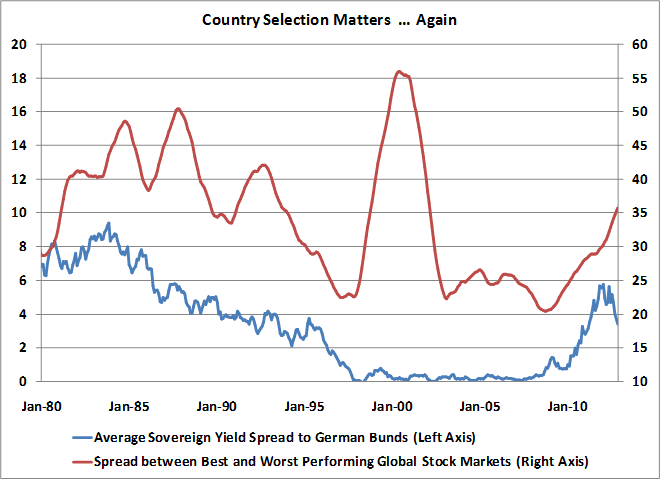
Both set of points tell an interesting story. The red points highlight the fact that the majority of countries actually do modestly well even when their own economy is in recession – as long the US economy is still expanding. (This can be seen in recent data, as some European countries currently in recession booked gains last year). The blue data points suggest that the stock markets of most countries fall when the US economy is contracting – even if the local country is not in recession. This picks up on the strong correlation between international markets and the US market, even if local prospects are more favorable. It’s likely that if the US were to enter into a recession this year, international markets will be pressured downward regardless of their individual country economic conditions. A Solution How should investor’s respond to the changing landscape of international investing? One solution would be to wait out the recent trends in the data, hoping for the free lunch of international diversification to return. That may be too risky a strategy. The bulk of these earlier trends seem unlikely to return because the rise in correlations among large developed international countries and US stocks has been secular in nature. If correlations remain high among broad international indexes and the US markets, a more promising solution may be to begin to think about the investment potential and diversification characteristics of individual countries. This is likely where the next advances in the study of asset allocation will take place: gaining international exposure not through broad benchmarks, but instead through a subset of countries based on individual characteristics. There are a number of investment strategies that would have been successful over the last 40 years. Value-rotation strategies (for example, ranking countries by dividend yield) have historically offered up higher returns than the broad benchmarks. In our work, a focus on characteristics such as valuation, yield trends, market internals, and the quality of a of country’s balance sheet has shown to be a historically robust strategy. On this topic, there’s actually good news - the potential benefits of individual country selection are increasing. One result of the adoption of the Euro was that country selection within a portfolio became less important (which is one reason why correlations have increased). With the exception of the late 1990’s stock market bubble, the spread between the best performing countries and the worst collapsed. Not surprisingly, this performance characteristic also tracked the relative risk taken in sovereign bonds. This made the process of individual country selection less rewarding. Over the last few years as sovereign yield spreads have widened (until recently), so has the spread between the performance of the top and bottom-performing countries. The current spread has nearly doubled and it could continue to widen. In the 1980’s-1990’s, the spread between the best and worst performing countries was at times 50 percent higher than current levels. In the graph below, the red line shows the difference between the three top and bottom performing countries over rolling 3-year periods.
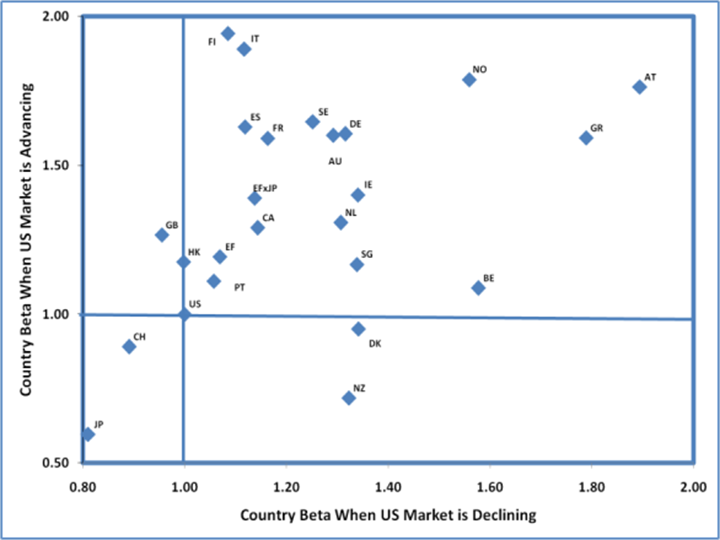
And it’s not only returns that can be boosted by effective country selection; portfolio risk attributes also tend to improve. The graph below shows the performance of countries relative to the US market over the past five years, in both up and down markets. You can see that the majority of markets have betas greater than one – in both rising and falling markets. But individual countries would have provided very different risk and return characteristics to a portfolio, versus a broad benchmark.
As major developed economies around the world become more intertwined, and as long as the Federal Reserve continues to devote its $3 trillion balance sheet to encourage stock market speculation, it seems likely that intermediate-term correlations will stay high, and the potential benefits of a simple, un-hedged international diversification strategy will come up short relative to its own history. A US recession, or steep decline in US markets, will almost certainly push those correlations even higher, at least temporarily. Seeking out countries – instead of broad indexes - that can subsequently offer portfolios favorable return and risk characteristics will likely end up being the strongest defense against the secular rise in the correlations of broad world equity benchmarks. --- The foregoing comments represent the general investment analysis and economic views of the Advisor, and are provided solely for the purpose of information, instruction and discourse. Prospectuses for the Hussman Strategic Growth Fund, the Hussman Strategic Total Return Fund, the Hussman Strategic International Fund, and the Hussman Strategic Dividend Value Fund, as well as Fund reports and other information, are available by clicking "The Funds" menu button from any page of this website. |
|||||||||||||||||||||||||
|
For more information about investing in the Hussman Funds, please call us at
1-800-HUSSMAN (1-800-487-7626) 513-326-3551 outside the United States Site and site contents © copyright Hussman Funds. Brief quotations including attribution and a direct link to this site (www.hussmanfunds.com) are authorized. All other rights reserved and actively enforced. Extensive or unattributed reproduction of text or research findings are violations of copyright law. Site design by 1WebsiteDesigners. |