|
|
||||||
|
|

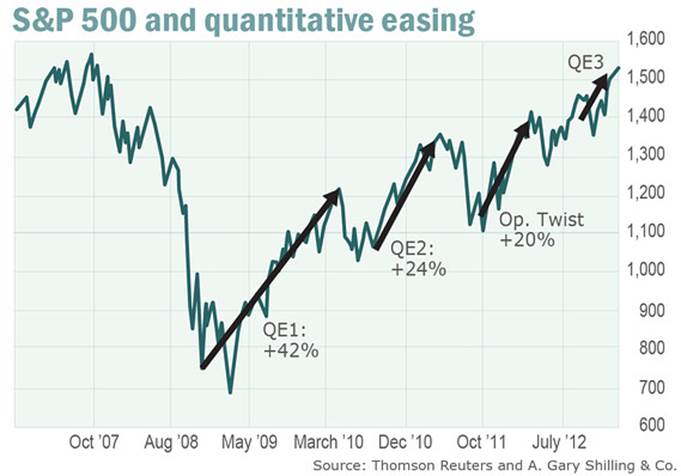
April 15, 2013 Increasingly Immediate Impulses to Buy the Dip (or, How to Blow a Bubble) Mark Twain wrote “Let me make the superstitions of a nation, and I care not who makes its laws.” In recent years, investors have somehow allowed themselves to be convinced that alchemy – exchanging outstanding government debt for zero-interest monetary liabilities despite what are already trillions in excess monetary liabilities – is capable having real, stimulative, and beneficial effects for the economy. Make no mistake – the faith that quantitative easing will produce anything other than temporary and ultimately calamitous financial distortion is superstition. Keep in mind that each dollar of monetary base must remain a dollar of monetary base until it is retired. It cannot “turn into” something else. The only two forms of monetary base are currency and bank reserves, and of the trillions of dollars of monetary base created since 2008, only $300 billion has taken the form of additional currency. All of the other trillions of dollars of base money that the Fed has created take the form of bits and bytes on some computer at one bank or another in the U.S. financial system. At every moment in time, someone in the economy must be the proud owner of those zero-interest bits and bytes. If they try to exchange their bits and bytes for stocks, or bonds, or gold, or real estate, the seller of that asset becomes the new owner of the bits and bytes. The bits and bytes can be exchanged for currency (the other form of base money), and you can then walk out the door of the bank with the dough, carry it in your pocket, or buy something from a Cypriot so they can stuff the dough under their mattress. Still, such cash conversion has been fairly limited in practice, and for the most part, the reserves simply remain in the banking system. The bits and bytes will go away at the point that the Federal Reserve sells Treasury or mortgage securities back to someone the economy, and retires that someone’s bits and bytes out of “circulation” as payment. Meanwhile, all that quantitative easing does, will do, and is capable of doing, is to create the maximum amount of discomfort for the holder of those bits and bytes at each point in time, in the hope that the burden of zero interest will be sufficient to provoke the holder to exchange that hot potato, which goes on to scald someone else’s hands. Undoubtedly, the hope is that the exchange will be for some productive purpose like new investment or constructive demand, but QE cannot create those productive opportunities, and there are already enough credit mechanisms to fund them even when a cash balance is not in hand. The actual effect of QE is to provoke constant yield-seeking for securities that hold out the promise of relieving the discomfort of a zero interest rate. This process has now become pathological, because it has gone to the point that investors are now finding “yield” where yield is illusory. One type of illusory yield is the earnings yield on stocks, where profit margins are presently 70% above historical norms, and where we’ve demonstrated both by accounting identity and with nearly 70 years of hard data (accurate even to the most recent 4-year period), that the primary source of this corporate surplus is a mirror image deficit in the combined savings of government and households (see Two Myths and a Legend and Taking Distortion at Face Value). Stocks are not a claim on next year’s earnings. They are a claim on a very, very long-term stream of future cash flows that will actually be delivered into the hands of investors over time. At present, the “forward earnings yield” on stocks is a terribly elevated and misleading representative of those cash flows, and investors are likely to find themselves disappointed if they use forward earnings as a “sufficient statistic” for long-term profitability. The other type of illusory yield is on junk debt, where yields have fallen to the lowest levels in history, and where the majority – perhaps more than all – of the perceived “yield” is actually a default premium based on the likely frequency of future default. Unfortunately, the sterile reality that QE does nothing but provoke an inefficient and distortionary search for yield is not nearly as encouraging as the superstition that quantitative easing is a magical rabbit’s foot that will defer all potential trouble. This superstition will end badly. As Stevie Wonder sang, “When you believe in things that you don’t understand, then you suffer.” Our estimate of prospective 10-year S&P 500 nominal total returns is presently just 3.3% annually. No doubt, the period since 2007 until today demonstrates that stocks can achieve a positive return if a very rich starting valuation is matched with a very rich terminal valuation. Of course, even that turn of events did not deter the market from falling by more than half in the interim, despite aggressive Fed easing throughout 2008. The problem today is that investors rely on very rich valuations to be sustained from now into the indefinite future, and it is unlikely that the market will be accommodating without similarly disruptive interim declines. This should be reasonably obvious, unless the sole intellectual basis for investing rests on faith in the Fed, and the assumption that profit margins more than 70% above their historical norms can safely be taken at face value and relied on to be permanent. Increasingly Immediate Impulses to Buy-the-Dip “The temporary breaks in the market which preceded the crash were a serious trial for those who had declined fantasy. Early in 1928, in June, in December, and in February and March of 1929 it seemed that the end had come. On various of these occasions the Times happily reported the return to reality. And then the market took flight again. Only a durable sense of doom could survive such discouragement. The time was coming when the optimists would reap a rich harvest of discredit. But it has long since been forgotten that for many months those who resisted reassurance were similarly, if less permanently, discredited.” John Kenneth Galbraith, 1954, The Great Crash It’s important to begin this section clearly: I don’t believe that markets obey math. Markets are complex, adaptive, behavioral systems that reflect the combined behavior and feedback between an enormous number of participants. At the same time, I strongly believe that the results of those interactions often take on observable patterns, and part of the job of investors is to recognize and understand those patterns. For example, we have observed throughout history that the combination of overvalued, overbought, overbullish conditions has regularly produced difficult outcomes for the market – though certainly not always immediately. We’ve also observed that the most severe syndromes of these conditions are associated with unusually large market losses over a typical horizon of about 18-months to 2-years, though as I noted in We Should Already Have Learned How This Will End, taking a defensive stance in anticipation of those outcomes would often have felt intolerable at a day-by-day resolution. As Galbraith noted about the Great Crash, “only a durable sense of doom could survive such discouragement.” Another pattern that we’ve trained ourselves to identify, with some concern, is an emerging tendency toward increasingly immediate attempts by investors to buy every dip in the market. This tendency reflects a broadening consensus among investors that there is no direction other than up, and that any correction, however small, is a buying opportunity. As investors clamor to buy ever smaller dips at increasing frequency, the slope of the market’s advance becomes diagonal or parabolic. This is one of the warning signs of a bubble. It does not require much of a “catalyst” for these bubbles to burst, other than the retreat of some investors from the unanimous consensus that buying every dip is an act of genius. Back in July 2008, I observed this dynamic in the parabolic ramp of oil prices, writing “Geek's Rule o' Thumb: When you have to fit a sixth-order polynomial to capture price history because exponential growth is too conservative, you're probably close to a peak” (see The Outlook for Inflation and the Likelihood of $60 Oil). Indeed, the closest way to describe the price dynamics of oil at the time was to think in terms of a “log-periodic bubble” as described by Didier Sornette. The essential feature here isn’t precision in the fit between the log-periodic wave and the actual price, but rather the tendency of prices to experience a series of increasingly frequent but shallower dips, ending in a nearly uncorrected upward ramp in which virtually every dip is purchased as soon as it emerges. Again, I don’t believe that markets follow math, and Sornette’s approach shouldn’t be taken as implying such precision. For my part, the key feature of log-periodic bubbles is the tendency toward those increasingly frequent and shallow corrections, as investors buy dips with accelerating urgency, ending in a diagonal or parabolic ramp that I’ve identified with the yellow oval. That uncorrected binge at the end of mature, overbought, overbullish advances is a hallmark of bubbles.
[Geek’s Note: The phrase “log-periodic” simply means that if we measure the time between two successive trough dates Ti or Tj and some critical date Tc, we tend to find that (Ti-Tc)/(Tj-Tc) is a constant, or equivalently that the logarithm of that ratio is fixed. Clearly, as Tj approaches Tc, there is a divide-by-zero issue. So time Tc is called a finite-time singularity and corresponds to the terminal point of the bubble]. As another example, back in 2011, I noted that a Sornette-type bubble was becoming evident in the spot gold market. Gold stocks were still reasonably priced relative to the metal, but by early 2012, with the XAU above 200, the full ensemble of market conditions shifted us to a defensive view on the stocks as well. Note the characteristic acceleration of increasingly shallow troughs and the frantic tendency to buy every dip during the final upward ramp in prices.
I should note that last week, spot gold fell to 1486, and the Philadelphia gold index (XAU) declined to just 116, down nearly 50% from its 2011 peak. Importantly, this places the ratio of the spot gold price to the XAU at the highest level in history. This fact does not, in and of itself, imply near-term gains in the XAU. However, looking out over horizons of a year or more, an elevated gold/XAU ratio is a strong indicator of subsequent prospective total returns in gold shares. It’s notable that gold shares have been relatively flat – overall – for the most recent 4-year period, primarily because of the collapse that followed the Sornette bubble in gold itself. The performance of gold stocks has fallen significantly short of what would have been expected solely on the basis of the gold/XAU ratio. But it’s precisely that shortfall that creates such a major disparity today. Gold stocks are certainly volatile, so the prospective appreciation in gold shares should not be considered a low-risk outcome in either the short-term or the longer-term, and aggressive positions in gold shares often come with intolerable volatility. That said, we certainly view the present gold/XAU ratio over 12.5 as indicative of a significant margin for error – looking over a horizon of several years – even in the event of a further decline in the price of physical gold. Gold shares are among the only asset classes for which we can comfortably use the phrase “margin for error.”
While log-periodic advances are often very evident in price fluctuations approaching a bubble peak, not all bubbles show the same amount of precision – another reason why I think it is a stretch to view this tendency as “deterministic.” The chart below shows the advance of the Dow Jones Industrial Average to the 1929 bubble peak. Notice the final advance certainly did feature the characteristic uncorrected ramp in prices to the Dow’s final high of 381. Still, it’s clear that in the absence of hindsight, the advance into Febuary 1929, which reached about 322 on the Dow, must have surely seemed like the final advance at the time. The market found itself yet 18% higher by September 3, 1929, when the final peak was registered. Galbraith is instructive on this point – “The time was coming when the optimists would reap a rich harvest of discredit. But it has long since been forgotten that for many months those who resisted reassurance were similarly, if less permanently, discredited.” The 85% market collapse following that particular bubble (and the ill-fated 50% rally off of the initial crash low) might provide some idea why the initial advance off the 2009 low was not sufficient to abandon our stress-testing concerns about Depression-era data. That’s particularly true given that the post-1929 period was the only other U.S. period that featured similarly extreme credit strains.
My concern about the market at present is driven by a wide range of evidence relating to overvalued, overbought, overbullish conditions, and a broad ensemble of other factors (including trend-following measures, but those tend to be less useful once an extremely overextended syndrome is in place). In the absence of all of those factors, I would be advising not to draw too strong a conclusion from the increasing tendency of investors to buy dips at present. However, given how extreme the set of objective conditions has become, the coincidence of these negatives with a clear log-periodic blowoff in stock prices does contribute to my expectation that all of this will not end well. The chart below presents this accelerating eagerness to buy market dips in the S&P 500 since 2010, and the characteristic terminal ramp. This doesn’t necessarily imply a market crash, but I am certainly the last person who would tell investors to disregard this overbought extension as meaningless.
Undoubtedly, the eagerness of investors to aggressively buy every dip has been driven by the confidence that quantitative easing supports those actions. Still, I doubt that investors have seriously considered the fact that each round of QE has had successively smaller effects, nor that they have asked themselves exactly the mechanism by which QE “works.”
The reason QE "works" - though with weaker and weaker effects each round, is simple. QE creates an ocean of zero-interest money that must be held by someone at each point in time, and is intended to create as much discomfort as possible for each successive someone. That discomfort drives yield-seeking behavior, and ultimately produces precisely the sort of bubble that is now evident. Having successfully produced that result, investors might want to ask themselves who will relieve them of their positions once they decide to take their profits. Looking around them, and seeing a multitude of investors faced with exactly the same problem, they are unlikely to find the answer in fixed-income retirees and “permabears” except at much lower prices. This is a conversation that investors might want to have with themselves now instead of later. Again, this is not to imply any assurance of an oncoming crash in this instance - maybe the rabbit's foot will work a while longer - but is instead to note that the conditions that have preceded other major market losses are already well in place. A Note on Disagreement The intent of these weekly comments has always been to share the evidence that I view as important, instructive, or interesting - not to encourage anyone to depart from some other well-tested and carefully considered discipline – certainly not investors who have carefully weighed their own risk tolerance and understand the extent to which the market is likely to fluctuate over the completion of this market cycle. As even Jack Bogle of Vanguard has noted, investors can reasonably expect two interim bear market declines of as much as 50% in the coming decade. If you are investing with that in mind, and with a tolerance in your portfolio for that potential outcome, follow your discipline. I recognize that it's easy to dismiss my concerns, particularly given my insistence on stress-testing against Depression-era outcomes in 2009-2010 (at a point when we were at the top of our game), which resulted in what seems in hindsight to be a ridiculous “miss” in the interim. But to conclude that I am permanently averse to market exposure – as a matter of ongoing strategy – is difficult to square with my constructive turns early in previous bull market advances. Meanwhile, given that the 2000-2002 decline wiped out the entire total return achieved by the S&P 500, in excess of Treasury bills, all the way back to May 1996, while the 2007-2009 decline wiped out the market's entire total return, in excess of Treasury bills, all the way back to June 1995, it should be clear that risk-management is very forgiving of missed gains in overvalued markets. This will be a point easier made at the end of the present market cycle than it is at the peak of an unfinished half. By then, however, the benefit of understanding that point will no longer be available. In contrast to the one-time stress-testing demanded by the credit crisis, our present defensiveness, like it or not, is something that I would expect in any market cycle that features the same overvalued, overbought, overbullish characteristics as we presently observe (the same warning signs allowed us to anticipate steep market losses in 2000-2002 and 2007-2009). Present valuations are nothing like those that we observed in 2009, and market conditions are nothing like those that have repeatedly invited strong investment opportunities in every market cycle throughout history. Instead, they are very much like those that have repeatedly invited severe losses over the completion of those cycles. I expect the completion of this cycle and the cycles that follow to produce more than adequate opportunities to accept significant or aggressive market exposure. Overvalued, overbought, overbullish, uncorrected diagonal blowoffs in the market, at or beyond upper Bollinger bands at every resolution (daily, weekly, monthly), have not historically proved to be opportunities – unless one was selling. In any event, the best way to disagree is to confront evidence with evidence. Disagree by compiling a long record of data; demonstrating alternate conclusions not just with verbal arguments, but by proving that the alternative measures have a stronger and more reliable relationship with what the market, or profits, or the economy have subsequently done. Prefer to divide apples by the sum of apple trees and orange trees, as some analysts have been inspired to do by comparing U.S. profits to global GDP? Great. Now show that this metric explains subsequent changes in U.S. profits, and subsequent U.S. stock market returns better, and derive the accounting relationships that support that approach.* Prefer some to rely on some variant of the Fed Model to value stocks? You’ll have to get around the weak correlation that the Fed Model has with subsequent 10-year S&P 500 total returns, and show a robust alternative (not a backfitted kitchen-sink regression) that has a stronger than 90% correlation with subsequent 10-year returns, because that’s the floor for the approaches we’ve presented (see Investment, Speculation, Valuation, and Tinker Bell). With respect to QE, the evidence indicates that quantitative easing is not rocket fuel – at best, it is a bungee cord; reasonably effective in helping confidence and risk premiums normalize when they have spiked in response to fear over the prior 6-months, and capable of releasing just enough pent-up demand to kick a can, but with little durable economic effect once short-term interest rates have hit the zero bound (which was nearly $2 trillion ago). We’re really left with are arguments that hinge on superstition – effectively arguments that “the Fed can do this forever, and it’s not going to stop.” There's no problem with claiming that QE outweighs all other considerations, in the same way that we've found that extreme overvalued, overbought, overbullish conditions often outweigh trend-following considerations. Just make sure that this faith in QE is justified. I don't believe it is. My impression is that this is the claim; that quantitative easing, in and of itself, is a lucky rabbit’s foot, and that it changes everything, by mechanisms that investors need not understand, and makes all historical evidence and analysis irrelevant; that despite the historically tight and economically tractable relationship between corporate surpluses and the combined deficits of government and households**, somehow this time is different, and profit margins will remain elevated forever. I doubt that any of this will prove to be correct, but as John Kenneth Galbraith wrote in 1954 about the Great Crash, “the time had come, as in all periods of speculation, when men sought not to be persuaded by the reality of things but to find excuses for escaping into the new world of fantasy.” Footnotes * Presently, global GDP is about $70 trillion, with nearly $16 trillion of that representing U.S. GDP. The U.S. share of global GDP was about 46% in 1945, and is now about 23%. Close to half of large company profits are earned overseas, but the profit margins on foreign sales are not very dissimilar to those in the U.S. itself. So if you use global GDP in the denominator, but U.S. profits in the numerator, you might expect to get a series that trends significantly lower over time, as global GDP has grown disproportionately compared to U.S. GDP. But in fact, even the current ratio of U.S. profits to global GDP comes in above the historical norm (though obviously lower than in 1945). If you work out the algebra and examine the data, the failure to observe a much higher ratio of U.S. profits to global GDP is easily explained: despite the significant growth in global GDP, sales by U.S. companies have remained the majority of total sales to U.S. customers, while sales by U.S. companies have remained a moderate share of total sales to global customers. So growth in global GDP has diluted the ratio over time even as profit margins have become elevated. This has no implication that will prevent the predictable contraction in profit margins (or profits/GDP) as the combined deficit of government and households retreats from historic extremes. It is easy to construct an “indicator." What matters is whether the indicator meaningfully captures what it is intended to measure, and more than that, whether the indicator is actually correlated with the subsequent change in something you are trying to explain. For example, it’s certainly true that U.S. corporate profits are quite low relative to the cumulative number of bicycle spokes produced globally since 1800, but so what? What matters is whether that ratio measures something meaningful, and whether it has predictive or explanatory value. Before allowing yourself to be confused by the myriad “new economy” explanations for presently elevated profit margins, ask at least for evidence that the measures being used can adequately explain the historical changes in profits over the course of the business cycle (3-5 years). If not, what is being presented is an excuse instead of an insight. ** For those who have asked for a more “intuitive” derivation of the Kalecki equation, and how we move from that to the observation that profit margins are primarily driven by changes in the sum of government and household saving (which we’ve demonstrated in about 70 years of data), you can get to this observation most quickly by exploiting the “savings investment identity.” Savings = Investment Household Savings + Government Savings + Corporate Savings + Foreign Savings (the inverse of the current account deficit) = Investment Corporate Savings = Investment – Foreign Savings - Household Savings – Government Savings Profits – Dividends = (Investment – Foreign Savings) – Household Savings – Government Savings The reason (Investment – Foreign Savings) are in parentheses is because particularly in U.S. data, they have a very strong inverse relationship, as “improvements” in the current account deficit are generally associated with a deterioration in gross domestic investment – see the chart in last week’s comment. So the term in parentheses adds very little variability over the course of the business cycle. Likewise, dividends are fairly smooth, and add very little variability to the equation over the course of the business cycle. As a result, the above identity reduces – from the standpoint of overall variability – to a straightforward statement: Most of the variability in corporate profits over the business cycle reflects the mirror image of variability in the sum of household savings and government savings. All of the charts that I’ve presented are empirical evidence of the strength of that relationship (see Two Myths and a Legend). The Kalecki equation can also be written somewhat less intuitively as: Profits = Investment – Household Savings – Government Savings – Foreign Savings + Dividends The foregoing comments represent the general investment analysis and economic views of the Advisor, and are provided solely for the purpose of information, instruction and discourse. Only comments in the Fund Notes section relate specifically to the Hussman Funds and the investment positions of the Funds. Fund Notes As of last week, market conditions remained characterized by unusually extreme, uncorrected, overvalued, overbought, overbullish conditions. The S&P 500 is presently at or above its upper Bollinger bands (two standard deviations above its 20-period moving average) at daily, weekly and monthly resolutions. Investors Intelligence figures indicate bullish sentiment of investment advisors that dwarfs bearish sentiment. All of this may turn out just fine, but I believe that the margin for error in that view has rarely been thinner, and the average historical outcome following similar conditions offers little consolation on that front. Strategic Growth remains fully hedged, with a staggered-strike put option position that raises the put option portion of our hedge to higher strikes, but ones that remain well out-of-the-money. The position amounts to less than 1% of assets, and most of the day-to-day fluctuation in the Fund tends to be attributable to differences in the performance of the stocks held by the Fund and the indices we use to hedge, but we expect the higher-strike put options to fortify our defense against the risk of indiscriminate selling should the market encounter more than a moderate amount of weakness. Meanwhile, Strategic International remains fully hedged, and Strategic Dividend Value is hedged at about half of the value of its stock holdings. Last week, gold stocks declined significantly on a variety of factors, including concerns that Cyprus would be forced to liquidate its gold holdings. By the end of the week, the ratio of spot gold prices to the Philadelphia gold index (XAU) had reached 12.5 – the highest level in history. Though this ratio has little correlation with very short-term fluctuations in gold shares, we do historically observe a tendency for reversion of extreme moves in this ratio over horizons of 1-4 years, with an elevated gold/XAU ratio often preceding significant advances in the XAU. While the volatility of gold stocks and the imperfection of this relationship both support the view that gold stocks continue to have significant risk here, we also view the prospective return of gold stocks (based on this and an ensemble of other factors) as being sufficient to warrant a moderate, though not aggressive exposure to gold shares. Accordingly, in Strategic Total Return Fund, we gradually increased our exposure to precious metals shares to 20% of assets on price weakness late last week. We also sold the majority of our utility holdings in the Fund last week on what we view as significantly overextended price strength and correspondingly lower prospective returns. With the duration of the Fund’s bond holdings at about 3 years (meaning that a 100 basis point change in interest rates would be expected to impact Fund value by about 3% on the basis of bond price fluctuations), we expect that at least in the near-term, fluctuations in gold shares will account for much of the day-to-day fluctuation in the Fund. --- The foregoing comments represent the general investment analysis and economic views of the Advisor, and are provided solely for the purpose of information, instruction and discourse. Prospectuses for the Hussman Strategic Growth Fund, the Hussman Strategic Total Return Fund, the Hussman Strategic International Fund, and the Hussman Strategic Dividend Value Fund, as well as Fund reports and other information, are available by clicking "The Funds" menu button from any page of this website. |
|||||||||||||||||||||||||
|
For more information about investing in the Hussman Funds, please call us at
1-800-HUSSMAN (1-800-487-7626) 513-326-3551 outside the United States Site and site contents © copyright Hussman Funds. Brief quotations including attribution and a direct link to this site (www.hussmanfunds.com) are authorized. All other rights reserved and actively enforced. Extensive or unattributed reproduction of text or research findings are violations of copyright law. Site design by 1WebsiteDesigners. |