|
|
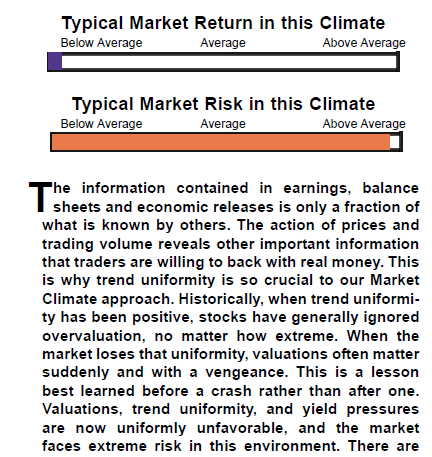
||||||
|
|

June 22, 2015 All Their Eggs in Janet's Basket The financial markets are establishing an extreme that we expect investors will remember for the remainder of history, joining other memorable peers that include 1906, 1929, 1937, 1966, 1972, 2000 and 2007. The failure to recognize this moment as historic is largely because investors have been urged to believe things that aren’t true, have never been true, and can be demonstrated to be untrue across a century of history. The broad market has been in an extended distribution process for nearly a year (during which the NYSE Composite has gone nowhere) yet every marginal high or brief market burst seems infinitely important from a short-sighted perspective. Like other major peaks throughout history, we expect that these minor details will be forgotten within the sheer scope of what follows. And like other historical extremes, the beliefs that enable them are widely embraced as common knowledge, though there is always, always, some wrinkle that makes “this time” seem different. That is why history only rhymes. But in its broad refrain, this time is not different. The central fallacy operating here is the notion that monetary easing provides a kind of mechanical and concrete support to the financial markets, when in fact the primary driver of financial markets in recent years has been pure speculative risk-seeking. While risk-seeking is encouraged by monetary easing, it is not a reliable outcome. Once speculative valuation extremes have been in place, persistent monetary easing has certainly not prevented severe market losses in prior cycles. Investor preferences toward risk distinguish the expanding phase of a bubble from its inevitable crash, and these are most directly measured through the behavior of market internals, not through the behavior of monetary authorities. More enlightened leaders at the Federal Reserve would never have allowed, much less intentionally encouraged, yet the third speculative episode in 15 years. Unfortunately, the idea that repeated cycles of malinvestment and yield-seeking speculation have actually been the cause of the nation’s economic malaise doesn’t seem to cross their minds. They appear more interested in dogma than in data. The dogma is that there is a Phillips Curve between employment and inflation that can be manipulated provided a sufficiently massive distortion of the monetary base and the level of short-term interest rates. The data is that there is a feeble correlation between the Fed’s policy tools and the objects they wish to control. One wonders whether the FOMC has even made the effort to operate a scatterplot to visualize these undependable relationships, or to actually estimate effect sizes to discover how limited their ability is to manipulate the real economy. The strongest line of cause and effect they will discover is their ability to produce repeated financial crises through reckless monetary distortions. Enlightened members of the FOMC should even question the theoretical basis for their actions. The Phillips Curve is actually a scarcity relationship between unemployment and real wage inflation – basically, labor scarcity raises wages relative to the price of other goods (see Will The Real Phillips Curve Please Stand Up and the instructive chart from former Fed governor Richard Fisher in Eating our Seed Corn). That’s the only variant of the Phillips Curve that actually holds up in the data, and there is no evidence that this or other variants can be reliably manipulated through monetary changes. Moreover, consumers spend based on their concept of “permanent income,” not off the value of volatile assets such as stocks. Economists have understood this since the 1950’s. While the Fed has been successful at intentionally promoting yield-seeking speculation since 2009, a century of evidence demonstrates that current valuation extremes also imply a market collapse that is now baked in the cake, and that Federal Reserve policy has much less ability to prevent than investors seem to believe. The one lesson to learn before a crash Let’s get my subjective narrative out of the way so we can focus on the objective evidence. My own stumble in the half-cycle since 2009 – and it was a serious one – was to insist, after a financial collapse that we had anticipated, on stress-testing our methods of classifying market return/risk profiles against Depression-era data. During the tech bubble, we recognized that deterioration in market internals and other risk-sensitive measures such as credit spreads is the central feature that distinguishes an overvalued market that continues to advance from an overvalued market that collapses. The broad behavior of market internals (what I used to call “trend uniformity”) is effectively a measure of investor risk-preferences, and increasing divergence and dispersion is a signal of emerging risk-aversion among investors. Our pre-2009 methods of classifying market return/risk profiles were based on post-war data, and while our stress-testing efforts widened their scope to include Depression-era data, the resulting methods also picked up another regularity: in prior market cycles across history, the emergence of an extreme syndrome of overvalued, overbought, overbullish conditions had generally been accompanied or closely followed by a breakdown in market internals. As a result, we responded defensively immediately when those syndromes emerged. As it happened, if quantitative easing did anything to make the period since 2009 “different,” it was to disrupt that regularity. Quantitative easing repeatedly and intentionally encouraged yield-seeking speculation by investors, despite overvalued, overbought, overbullish extremes. Since 2009, it has only been when market internals have explicitly deteriorated (for example, in 2011), that the stock market has declined meaningfully. In mid-2014, we imposed the requirement that a hard-defensive investment outlook must be coupled with actual breakdown in market internals or credit spreads as a prerequisite. See A Better Lesson than “This Time is Different” and Hard Won Lessons and The Bird in the Hand for a more complete narrative. The following clipping, from my October 2000 commentary, details the lesson that I unfortunately had to learn twice in my career. I strongly encourage investors to learn it at least once – here and now – because market internals and credit spreads have clearly deteriorated, and I view the risk of a market collapse as increasingly palpable.
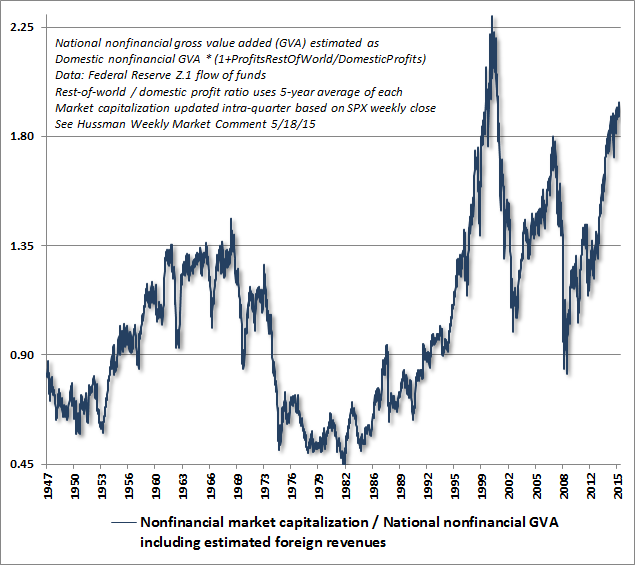
Again, it’s not simply extreme valuation, but the fact that extreme valuation is now joined with deteriorating market internals and widening credit spreads, that drives my rather unrestrained concerns here. Despite wicked valuations, an improvement in market internals and credit spreads would convey a signal about fresh risk-seeking among investors and would substantially ease the immediacy of those concerns. An ominous peer group As a reminder of where valuations stand, the following chart presents the ratio of market capitalization to non-financial gross value added, including estimated foreign revenue. MarketCap/GVA has a correlation of 92% with actual subsequent S&P 500 total returns over the following decade, a reliability that exceeds that of every other valuation ratio we’ve examined across history, including price/forward earnings, the Fed Model, the Shiller P/E, Tobin’s Q, market cap/GDP, dividend yields, price/book, and even price/revenue.
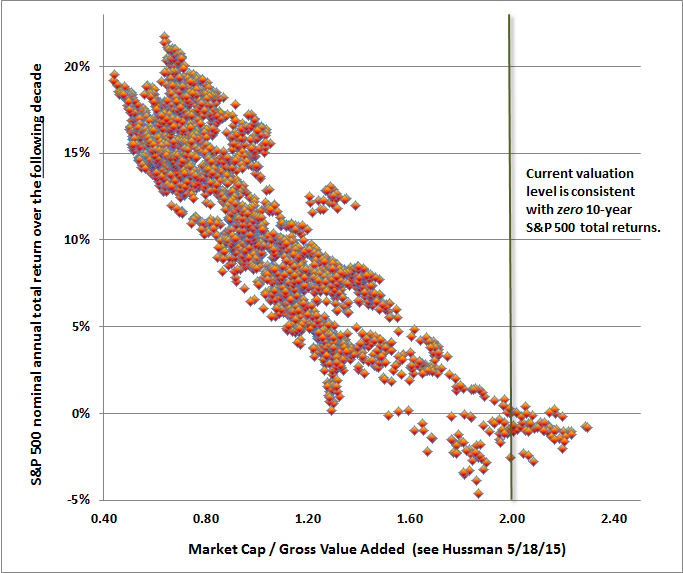
The following scatterplot, based on the same data since 1947, shows the relationship between MarketCap/GVA and actual subsequent annual total returns in the S&P 500 over the following decade. Present valuations are consistent with the expectation of zero return from equities over the coming 10-year period.
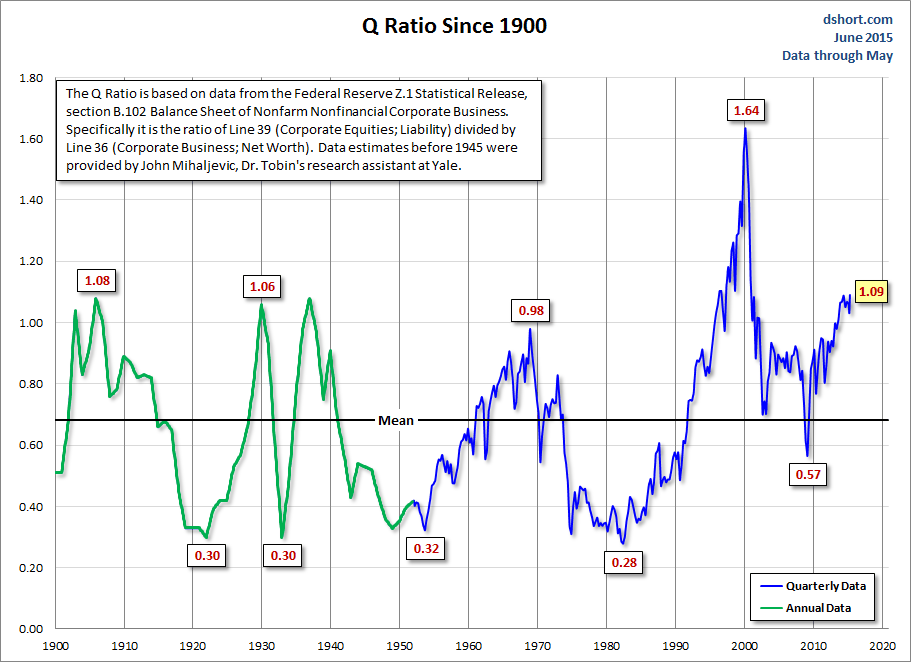
We’ve seen various criticisms based on the misconception that the concerns of value investors such as Jeremy Grantham and I rest simplistically on the Shiller P/E. Those criticisms are coupled with ad hominem criticisms that I’ve repeatedly addressed ad nauseum. All of this might carry more weight if better valuation measures than the Shiller P/E did not also have even worse implications for future market returns. Numerous historically reliable measures, based on earnings, revenues, assets, gross value added, and other fundamentals all line up with a similar message. The following chart from Doug Short provides a very nice long-term perspective based on Tobin’s Q (market capitalization / corporate net worth) going back to 1900.
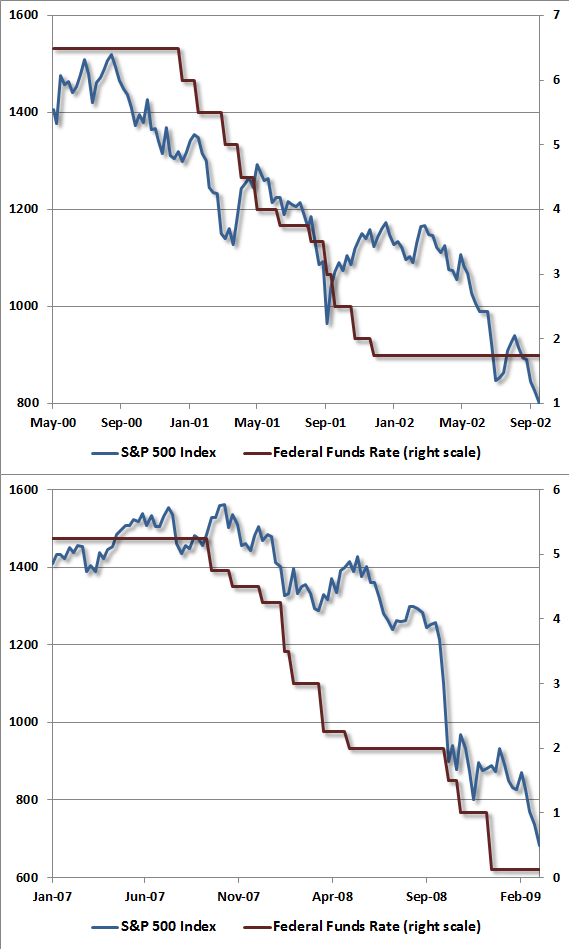
If one draws any lesson from the above chart, it should be a full understanding of exactly how poor market returns were, and for how long, following similar historical extremes. January 1906: Following an initial plunge into July of 1906, the market would recover, and then collapse in what was known as the “panic of 1907,” losing half of its value by the end of that decline. More importantly, however, the Dow Jones Industrial Average would not durably move beyond its 1906 peak until April 1938, more than three decades later. September 1929: Following the initial 1929 crash, the market would briefly rebound by about 50% into early 1930, collapsing again as the Great Depression took hold. From its September 1929 peak of 381.17, the Dow Jones Industrial Average would collapse to 41.22 at its 1932 low, losing 89% of its value. The Dow would not durably move beyond its 1929 high until November 1954. August 1937: One of the repeated fallacies of historical perspective currently making its way among analysts is the notion that the Federal Reserve raised interest rates prematurely in 1937, cutting short the recovery from the Great Depression and causing stocks to crash. There are several problems with this narrative. The first is that the Fed did not raise interest rates at all. Indeed, the Fed discount rate was progressively lowered until it reached 1.0% in September 1937, and the first rate hike would not occur until 1948. The Fed did raise reserve requirements in 1936, but at a time when actual reserves were already more than 200% of required reserves. What actually happened in 1937 was that an already fragile financial bubble crashed. Market internals, on our measures, turned negative in May 1937, before the market actually peaked. Following the August high, the stock market went on to lose half of its value by early 1938. In short, a market collapse was already baked in the cake on the basis of extreme valuations, and the subsequent collapse was clearly preceded by a shift toward investor risk aversion. We have no argument with the idea that the increase in reserve requirements and a modest decline in the monetary base, regardless of actual economic impact, might have contributed to that shift toward risk aversion and the timing of the crash. But again, a crash was already baked in the cake. It was the coupling of extreme valuations with increased risk-aversion – regardless of its origin – that explains the 1937 crash in a context that is fully consistent with more than a century of market history. The Dow Industrials would not durably exceed the August 1937 market peak until November 1949. February 1966: Following an initial bear market that year, the stock market would enter a series bull-bear market cycles, each ending at progressively lower levels of valuation for the next 18 years. That sequence is what defines a “secular” bear market. The S&P 500 would set its August 1982 low within 10% of that February 1966 peak. January 1973: This point is included not because it was the most extreme valuation, but because it was the highest point in terms of price during the early years of the 1966-1982 secular bear market. At the 1973 peak, the S&P 500 Index was only 16% above its Feburary 1966 level. The market would go on to lose half of its value by late-1974. The S&P 500 would not durably clear its January 1973 peak until September 1982. March 2000: We already know that the first collapse from the 2000 peak would take the S&P 500 down by half, and the Nasdaq 100 down by 83%. It also wiped out the entire total return of the S&P 500 – in excess of Treasury bill returns – all the way back to May 1996. Notably, the Federal Reserve was aggressively and persistently lowering interest rates throughout the collapse. It is only the return to obscene historical overvaluation that has even allowed the S&P 500 to post a 4% annual total return over the past 15 years. I expect that every bit of that total return will prove to be transitory by the completion of the current market cycle. October 2007: We already know that the collapse from the 2007 would take the S&P 500 down by 55%. It also wiped out the entire total return of the S&P 500 – in excess of Treasury bills – all the way back to June 1995. Notably, the Federal Reserve began cutting interest rates a month before the 2007 market peak, and continued to cut interest rates persistently throughout the collapse. As a reminder of how “following the Fed” treated investors during the collapse of the most recent market extremes, the chart below shows the Federal Funds rate alongside the S&P 500 during those declines.
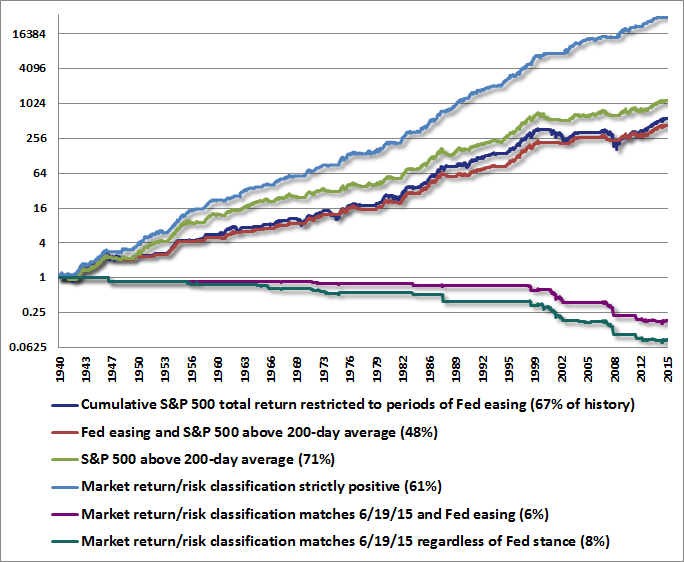
I know. Investors don’t want to believe this. They want to believe that the Federal Reserve has their backs; that as long as the Fed doesn’t explicitly hike interest rates, the market will move higher indefinitely. We saw one question last week that asked “What if the Fed doesn’t raise rates for another 20 years?” Let’s start with an aggressive, optimistic estimate. If we assume that despite conditions warranting two decades of zero interest rates, nominal GDP and corporate revenues will grow at their long-term historical norm of 6% annually over the coming 20 years, we would expect the total return of the S&P 500 to average about 5.5% annually over the next two decades (see Ockham’s Razor and the Market Cycle for the arithmetic behind these estimates). Even in this optimistic scenario, to imagine that this path would be smooth would have no basis in history, requiring the absence of any external shock for the entire period (and I’ve already demonstrated, I hope, that many of the worst market declines in history have been accompanied by Federal Reserve easing). Unfortunately, the foregoing assumptions are largely incompatible. Nominal growth in more recent decades has been much slower than 6% annually. Given 0.5% trend growth in real productivity, 0.5% trend growth in labor supply, and the likelihood that zero interest rates would not tolerate sustained inflation above 2% annually, the appropriate economic growth assumption given a 20-years-of-zero-interest-rates scenario is more likely about 3%, putting likely S&P 500 total returns over that 20-year period closer to 2.5% annually. So call stocks “fairly valued relative to interest rates” if you actually expect 20 years of zero interest rates, but recognize that this assumption still comes along with the prospect of low single-digit total returns on equities over that period, and enormous cyclical volatility in the interim. All their eggs in Janet’s basket Finally, some additional historical evidence may help to build intuition about what has and has not been effective in market cycles across history. First, understand that “following the Fed” is actually a rather poor trading rule. Periods when one or more yields – Federal funds rate, discount rate, or 3-month T-bill yield – were falling (or steady following a prior cut) do capture a meaningful portion of historical market returns and account for about 67% of history, but that condition alone is also associated with a maximum drawdown of about 55% because it actually provides no risk control at all. Tightening the criteria simply captures less return, with no material reduction in drawdown because of the fact that the Fed was easing persistently in 2000-2002 and 2007-2009. Worse, that rule also misses significant upside because the market has also tended to advance, on average, when interest rate conditions have been unfavorable (the average total return of the S&P 500 isn’t strongly dependent on the Fed’s stance, so the rule rarely favors going to cash). In short, following the Fed doesn’t provide an informative distinction about subsequent market returns. Interestingly, it turns out that the majority of the market gain observed during “favorable” monetary environments has occurred when the S&P 500 has been above its 200-day moving average, and those periods have been associated with far smaller drawdown risk. Indeed, an even greater portion of the market’s historical return is captured in periods that omit the Fed-following rule altogether and focus strictly on trend-following. The main problem there is that most popular trend-following methods still fail to outperform a passive investment approach, unless they merge a wider range of measures. On that note, we do find that Fed rates and other yields can be useful components of broadly defined measures of market action. The chart below also partitions S&P 500 returns based on various market return/risk classifications we identify. None of these lines depict a portfolio or investment strategy, but merely reflect the cumulative total return of the S&P 500, restricted to various conditions. There is no assurance that future market outcomes will follow the same regularities. As I’ve frequently noted, I view the most effective approach to be one that combines multiple factors, particularly valuations and measures that reflect the market behavior of numerous individual securities, industries, sectors and security types (including interest and credit-sensitive measures). In mid-2014, we imposed a requirement that a strongly defensive outlook must be validated by deterioration in market internals or credit spreads. Notice that out of the 8% of historical periods that match the current market return/risk classification we identify, three quarters of those periods (6% of history) occurred during periods of Fed easing. The market experienced steep losses anyway.
The foregoing comments represent the general investment analysis and economic views of the Advisor, and are provided solely for the purpose of information, instruction and discourse. Please see periodic remarks on the Fund Notes and Commentary page for discussion relating specifically to the Hussman Funds and the investment positions of the Funds. --- The foregoing comments represent the general investment analysis and economic views of the Advisor, and are provided solely for the purpose of information, instruction and discourse. Prospectuses for the Hussman Strategic Growth Fund, the Hussman Strategic Total Return Fund, the Hussman Strategic International Fund, and the Hussman Strategic Dividend Value Fund, as well as Fund reports and other information, are available by clicking "The Funds" menu button from any page of this website. |
|||||||||||||||||||||||||
|
For more information about investing in the Hussman Funds, please call us at
1-800-HUSSMAN (1-800-487-7626) 513-326-3551 outside the United States Site and site contents © copyright Hussman Funds. Brief quotations including attribution and a direct link to this site (www.hussmanfunds.com) are authorized. All other rights reserved and actively enforced. Extensive or unattributed reproduction of text or research findings are violations of copyright law. Site design by 1WebsiteDesigners. |