|
|
||||||
|
|

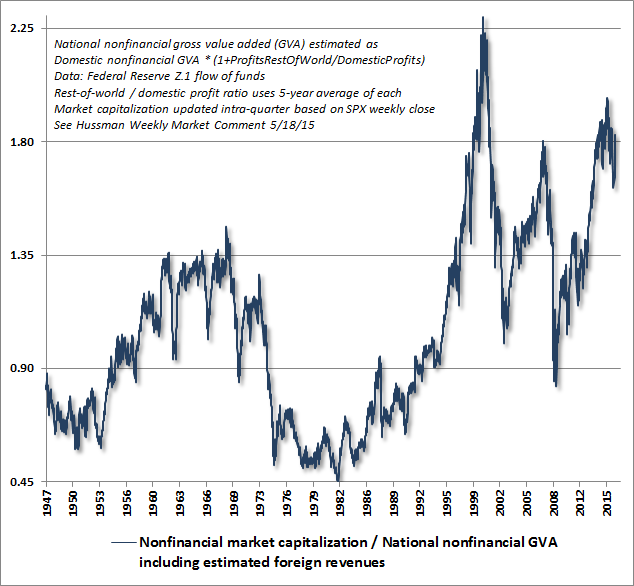
April 18, 2016 Permanently High Plateaus Have Poor Precedents “Stock prices have reached what looks like a permanently high plateau.” Irving Fisher, October 21, 1929 “Stability leads to instability. The more stable things become and the longer things are stable, the more unstable they will be when the crisis hits.” Hyman Minsky “Participants in the speculative situation are programmed for sudden efforts at escape. Thus the rule, supported by the experience of centuries: the speculative episode always ends not with a whimper but with a bang. There will be occasion to see the operation of this rule frequently repeated.” John Kenneth Galbraith Despite a near-term outlook that remains rather neutral (though with negative skew), we believe that one requires either a disregard or an ignorance of market history to dismiss the likelihood of a 40-55% market retreat over the completion of the current market cycle. From present valuations, a market loss of that magnitude would not be a worst-case scenario, but merely a run-of-the-mill completion of the current market cycle. On a longer horizon, we presently estimate that S&P 500 nominal total returns are likely to average just 0-2% annually over the coming 10-12 years, with negative expected real returns on both horizons. Since the dividend yield on the S&P 500 exceeds 2% here, that also implies that we fully expect the S&P 500 Index to trade at a lower level in 10-12 years than it does today. The good news here is that in order to achieve a zero 10-12 year return despite deep interim losses, we should also expect opportunities for strong market advances over this horizon. As I’ve noted frequently over the years, the most favorable market return/risk profile we identify is associated with a material retreat in market valuations that is then joined by an early improvement in our measures of market action. I have every expectation that this opportunity will emerge over the completion of the current market cycle. Based on valuation measures having the strongest correlation with actual subsequent market returns across history, equity valuations have approached present levels in only a handful of instances: 1901 (followed by a -46% market retreat over the following 3-year period), 1906 (followed by a -45% retreat over the following year), 1929 (followed by a -89% collapse over the following 3 years), 1937 (followed by a -48% loss over the following year), 2000 (followed by a -49% market loss over the following 2 years), and 2007 (followed by a -57% market loss over the following 2 years). A few lesser extremes occurred in the 1960’s and 1970’s, followed by market losses in the -35% to -48% range. A few charts will update the current valuation picture. The chart below updates the ratio of nonfinancial market capitalization to corporate gross value added, which we find more tightly correlated with actual subsequent 10-12 year returns than any other measure we’ve tested across history (including price/forward earnings, the Fed model, CAPE, and numerous other metrics). The recent bounce can be seen at the far right of the chart, taking this measure to nearly twice the level that has been approached or breached during the completion of every prior market cycle.
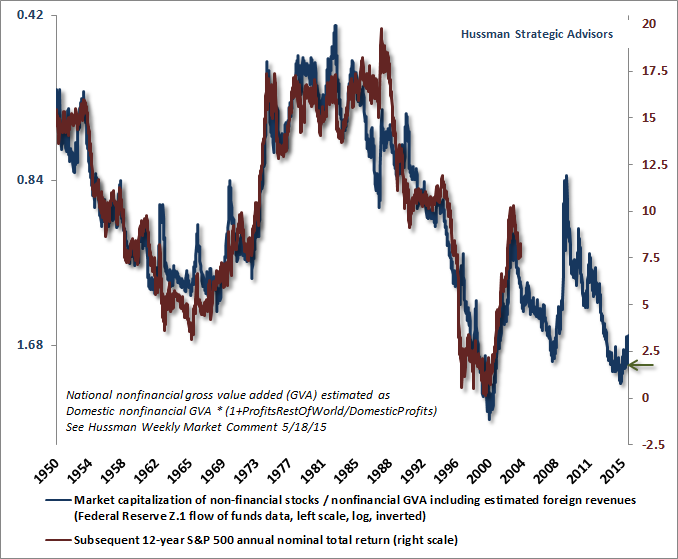
The following chart places this measure on an inverted log scale (left). The red line (right scale) shows the actual S&P 500 nominal annual total return over the following 12-year period. Clearly, valuations and prospective returns are nowhere near levels that have been followed by satisfying returns for investors over time. Be patient. We’ve never seen valuations near present levels without stock prices collapsing over the completion of the market cycle.
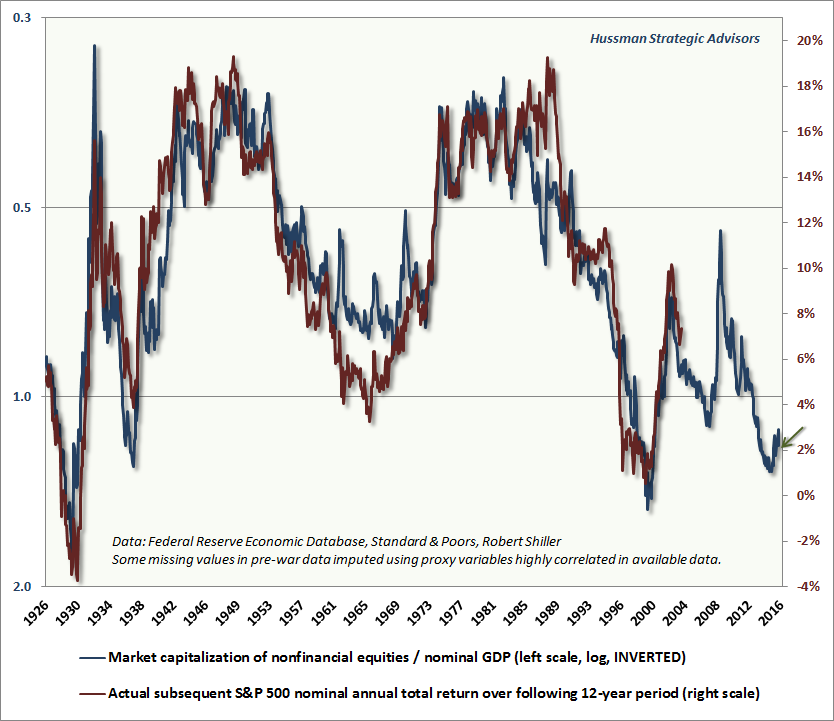
With regard to the idea that low interest rates will ensure a permanently high plateau, keep in mind that the historical correlation between Treasury yields and reliable measures of market valuation is only about -0.3. This weak inverse relationship is entirely captured by the inflation-disinflation cycle from 1972 to 1997. Outside of that period, there is no reliable correlation between interest rates and stock valuations (or prospective equity returns). In fact, the correlation that does exist often goes the “wrong” way: lower interest rates are associated with lower stock valuations across much of history. The only period where equity valuations and bond yields were tightly linked was during the disinflationary period from 1980 to 1997. The "Fed Model" is wholly an artifact based on that single period. For more detail and evidence on this point, see Recognizing The Risks To Financial Stability. Much of what investors believe about the relationship between interest rates and market valuations is fiction, but one only discovers this by making an effort to examine the data. Of course, over the shorter-run, markets are driven by whatever investors believe, regardless of how unsupported or incongruent those beliefs may be. That’s why it’s essential to couple “hard” measures such as valuations with measures that capture the willingness of investors to speculate or avoid risk. Market internals are the primary feature to monitor on that front. Finally, the chart below provides a similar view using market capitalization / GDP, which Warren Buffett cited in a 2001 Fortune interview as “probably the best single measure of where valuations stand at any given moment.” Below, I’ve imputed some of the pre-war data points based on highly correlated proxy data that is available through the full period, as one can do for forward operating earnings and other series. Valuations are presented on an inverted log scale (blue, left), with actual subsequent S&P 500 total returns in red (right scale).
I continue to view the intentional distortion of the financial markets by the Federal Reserve to be a reckless mistake. These policies have produced no benefit to the real economy (output, employment, industrial production) compared with what could have been predicted solely on the basis of non-monetary variables. But these policies have fueled the third financial bubble since 2000; they have elevated security valuations to the point where both stocks and bonds are now priced to produce negative expected real returns for investors on a 10-12 year horizon; they have facilitated heavy issuance of corporate debt with a preference for low-grade “covenant lite” obligations; they have provoked speculative capital flows and “carry trades” in international markets; and they have encouraged competing behavior by central banks across the globe - all from whence will emerge the next financial crisis. On its face, the Fed and other central banks are attempting to foster economic stability. But as the economist Hyman Minsky observed decades ago, attempts to produce such “new eras” of economic stability tend instead to foster the escalation of speculation, debt issuance, and deteriorating loan quality. Those features, in turn, make the economy increasingly vulnerable to crisis: “A new era is destabilizing, in an expansionary direction, in three senses. One is that it quite rapidly raises the value of existing capital. The second is an increase in the willingness to finance the acquisition of real capital... The third is acceptance by lenders of assets that previously would have been considered as low-yield - when the yield is adjusted to allow for the risks. All in all, the euphoric period has a short life span. However, the portfolio commitments of the short euphoric era are fixed in liability structures.” Consider Minsky’s phrase “fixed in liability structures.” Even though speculative episodes are ultimately temporary, their effect is to lock investors, in aggregate, into holding low-quality liabilities that are issued during the bubble, and these liabilities become fodder for the next crisis. This is precisely what happened during the tech bubble, though instead of debt, many of the new liabilities came in the form of new issues that ended up being wiped out. In the housing bubble, the most vulnerable liabilities were mortgage securities that had been created by Wall Street institutions eager to crank out new “product” to satisfy the demand of yield-starved speculators, frantic to gain a “pickup” over the dismally low interest rates engineered by the Fed. The current QE bubble has featured a massive expansion in corporate and covenant-lite debt, largely to finance leveraged acquisitions and repurchase of stock. In recent years, the Fed has not simply engineered a temporary euphoria in valuations, but has also profoundly affected the long-term capital structure of U.S. companies by subordinating the claims of stockholders to the claims of bondholders. Investors are going to figure this out over time. The lesson is unlikely to be pleasant. Speculators seem willing to imagine that the Fed has created a permanently high plateau, but historically-informed investors should know better. The Great Depression took the U.S. economy from euphoria to devastation within a handful years. World War II upended civilization just as quickly. The most extreme episode of U.S. inflation largely came and went in the span of a decade. The tech bubble and the housing bubble both peaked and collapsed within the same 10-year span. Investors have been under the mesmerizing grip of a wholly experimental monetary policy, with no transmission mechanism other than to encourage speculation driven by the discomfort of low yields. To believe that this effect will be permanent is to reject the lessons of history, which teach that economic, political, and social conditions change - and often change abruptly. Still, history doesn’t unfold at random. One can often anticipate the future harvest by examining the seeds that are sown in the present. Long periods of yield-seeking speculation create an illusion of stability in the present, but produce an inevitable harvest of crisis. Long periods of obscene overvaluation create an illusion of permanently high plateaus, but produce an inevitable harvest of poor long-term returns and wicked losses that complete those market cycles. Recognize those seeds here. Yes, repeated cycles of quantitative easing and zero interest rate policy have encouraged speculation, driving valuations to historically obscene levels. But understand that these extremes now mean that U.S. equities are likely to go nowhere for 10-12 years, with deep losses in the interim. The market has never reached similar valuations without suffering same outcome over time. Near-term, our outlook remains fairly neutral, as it has for several weeks. The reason is that various trend-following components of market internals have improved enough to refrain from “fighting” near-term speculation about economic improvement, enthusiasm about central bank policy, and the like. Market conditions are strenuously overbought, and momentum has deteriorated, but despite the wicked long-term and full-cycle prospects for the market, we’re fairly agnostic about immediate prospects. Specifically, present market conditions are associated with outcomes that feature what I call “unpleasant skew”: a relatively high probability of small, incremental market gains, offset by a modest probability of steep losses that can wipe out weeks or months of gains in one fell-swoop. On the downside, we would expect to shift back to a hard-negative outlook on a break below the 1980-2020 area. Stronger bullish sentiment could also push us back to a hard-negative outlook, since our measures of market internals currently don’t show enough uniformity to disable “overvalued, overbought, overbullish” conditions (as our present methods would have done during much of the advance prior to about mid-2014). See the Box in The Next Big Short for the narrative of the challenges we encountered in the half-cycle since 2009, and the adaptations we introduced in mid-2014 to address the central issue. Overall, the stock market continues to trace out a broad arc that we view as the top-formation of the third speculative bubble in 16 years. A marginal new high, if it emerges, would not change that broad assessment. Those who recall the marginal new highs of the S&P 500 in September 2000 (on a total return basis) and October 2007 are well aware that they didn’t represent any sort of “all clear” for the market. Meanwhile, we’re very familiar with the seeds that have been planted by the recent speculative episode, and we believe that the best approach for investors here is to wait for the rain, and be patient for the harvest to follow. Now is not the time nor circumstance to accept material downside risk, because the potential depth and speed of such weakness could be quite severe. As usual, we’ll respond to new evidence as it emerges. The foregoing comments represent the general investment analysis and economic views of the Advisor, and are provided solely for the purpose of information, instruction and discourse. Please see periodic remarks on the Fund Notes and Commentary page for discussion relating specifically to the Hussman Funds and the investment positions of the Funds. --- The foregoing comments represent the general investment analysis and economic views of the Advisor, and are provided solely for the purpose of information, instruction and discourse. Prospectuses for the Hussman Strategic Growth Fund, the Hussman Strategic Total Return Fund, the Hussman Strategic International Fund, and the Hussman Strategic Dividend Value Fund, as well as Fund reports and other information, are available by clicking "The Funds" menu button from any page of this website. |
|||||||||||||||||||||||||
|
For more information about investing in the Hussman Funds, please call us at
1-800-HUSSMAN (1-800-487-7626) 513-326-3551 outside the United States Site and site contents © copyright Hussman Funds. Brief quotations including attribution and a direct link to this site (www.hussmanfunds.com) are authorized. All other rights reserved and actively enforced. Extensive or unattributed reproduction of text or research findings are violations of copyright law. Site design by 1WebsiteDesigners. |