|
|
||||||
|
|

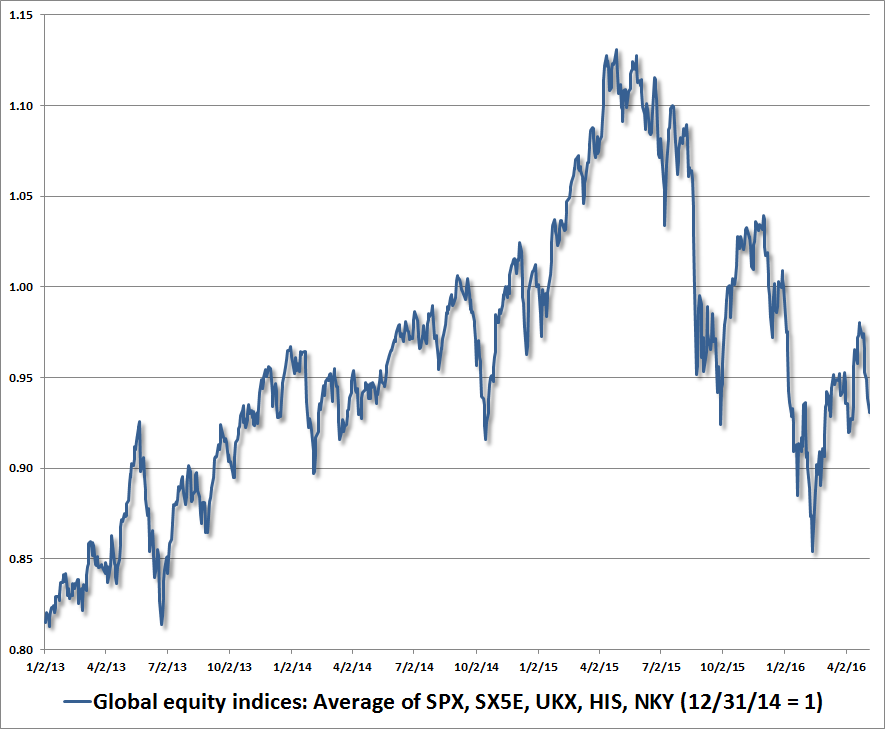
May 9, 2016 Latent Risks and Critical Points The S&P 500 Index remains just 3.5% below its May 2015 peak, yet is also at the same level it set in November 2014, 18 months ago. I continue to view market action as tracing out the arc of a major top formation, completing the third speculative financial bubble in 16 years. Downside risk remains significant, and even our short-term view has shifted back from neutral to hard-negative. Given that the behavior of single indices can be “noisy,” the following chart shows the average behavior of major global equity indices, including U.S., European, British, Hong Kong and Japanese stock markets. This may provide a broader view of equity market pressures here. The respective level of each index on December 31, 2014 is scaled to 1.0.
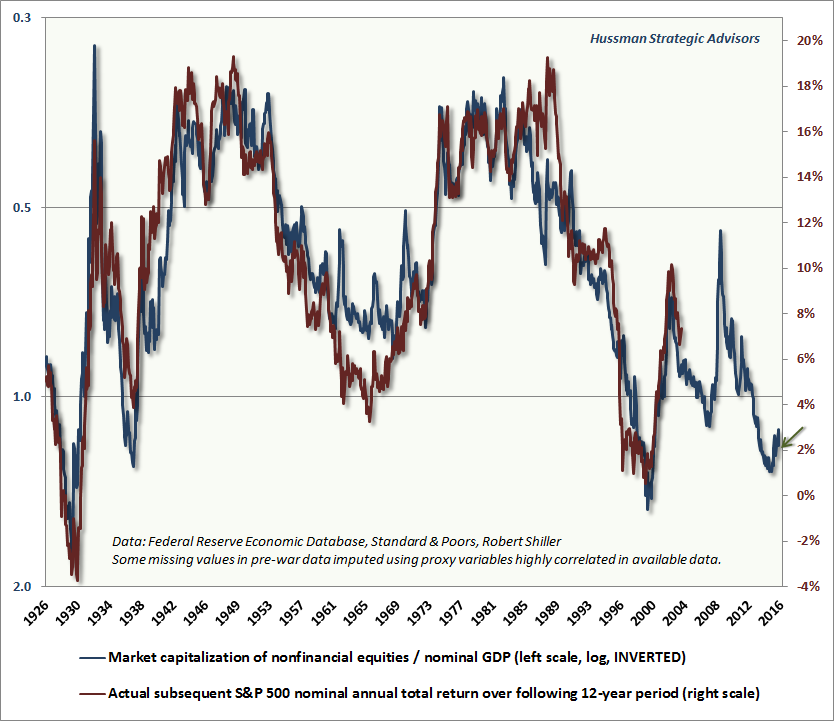
We have to remain open to the potential for fresh speculation, which would be evident through a clear improvement in market internals. In the absence of uniformity similar to what was observed prior to this top formation, my impression is that the best way to understand the next stage of the current market cycle is to recognize the difference between observed conditions and latent risks. This distinction will be most helpful before, not after, the S&P 500 drops hundreds of points in a handful of sessions. That essentially describes how a coordinated attempt by trend-followers to exit this steeply overvalued market could unfold, since value-conscious investors may have little interest in absorbing those shares at nearby prices, and in equilibrium, every seller requires a buyer. Imagine the error of skating on thin ice and plunging through. While we might examine the hole in the ice in hindsight, and find some particular fracture that contributed to the collapse, this is much like looking for the particular pebble of sand that triggers an avalanche, or the specific vibration that triggers an earthquake. In each case, the collapse actually reflects the expression of sub-surface conditions that were already in place long before the collapse - the realization of previously latent risks. Finding the specific trigger that causes the skaters to plunge through the ice isn’t particularly informative. The fact is that catastrophe is inevitable the moment the skaters ignore the latent risk, or rely on faulty evidence to conclude that the ice is stable. The fracture in some particular span of ice is just one of numerous other spots that might have otherwise given way if the skaters had chosen a different course. Hitting that spot creates the specific occasion for the underlying risk to be expressed, but an unfortunate outcome was already inevitable much earlier. Prior to the collapse of a cliff, the buildup of latent risk is expressed as an acceleration in the average size of seismic events approaching the point of failure. Likewise, if you drop grains of sand onto a pile, the slope may become quite steep, but very small-scale, local avalanches will begin to occur before the structure collapses. These subtle breakdowns in what we might call “internals” serve to relieve local imbalances even as global imbalances build - held together by a whole matrix of weak interactions. At some point, you get a “butterfly effect” - some very small disruption triggers a massive, coordinated shift in the whole system. We’ve observed a similar process in recent quarters through a combination of obscene valuation, increased internal dispersion, and a series of intermittent corrections and recoveries, just as we observed during the 2000 and 2007 market peaks. This will become increasingly important to monitor if volatility begins to emerge on very short time-scales, which we should carefully watch here. The following is from my weekly comment in the second-half of 2007, before the global financial crisis (see Market Internals Go Negative): “I've noted over the years that substantial market declines are often preceded by a combination of internal dispersion where the market simultaneously registers a relatively large number of new highs and new lows among individual stocks, and a leadership reversal, where the statistics shift from a majority of new highs to a majority of new lows within a small number of trading sessions. This is much like what happens when a substance goes through a ‘phase transition,’ for example, from a gas to a liquid or vice versa. Portions of the material begin to act distinctly, as if the particles are choosing between the two phases, and as the transition approaches its ‘critical point,’ you start to observe larger clusters as one phase takes precedence and the particles that have ‘made a choice’ affect their neighbors. You also observe fast oscillations between order and disorder in the remaining particles. So a phase transition features internal dispersion followed by leadership reversal. My impression is that this analogy also extends to the market's tendency to experience increasing volatility at 5-10 minute intervals prior to major declines.” To understand major investment collapses, we should distinguish causes from triggers. The central cause of a collapse is typically the extreme overvaluation that preceded it. Indeed, when equity valuations have been similarly extreme on historically reliable measures, as they were in 1901, 1907, 1929, 1937, 2000, and 2007 (as well as lesser instances such as 1973), the market has always followed by losing half of its value. Once reliable measures of valuation become obscenely elevated, steep losses are already inevitable; baked in the cake. What typically triggers the breakdown is the violation of some widely-observed “support” threshold (often roughly 14% below the market peak) that shifts trend-followers from feeding self-reinforcing speculation to feeding self-reinforcing liquidation. For a more formal analysis, see Complex Systems, Feedback Loops, and the Bubble-Crash Cycle, and Lessons from the Iron Law of Equilibrium. Unfortunately, the most reliable measures of valuation (those having the strongest and most consistent relationship with actual subsequent market returns) aren’t always the most popular. The unreliable measures, which include price/operating earnings ratios and the “Fed Model,” create mirages. They’re the misleading evidence encouraging skaters out onto the thin ice. Novel or historically unreliable valuation measures offer hope that market extremes are of little concern; that “this time is different.” As J.K. Galbraith wrote, describing the period leading up to the 1929 crash, they were “necessary to reassure those who required some tie, however tenuous, to reality. This process of reassurance eventually achieved the status of a profession.” A second issue is that the collapse isn’t always immediate. Investors seem very uncomfortable with the idea of latent or unexpressed risk. Instead, there is a misconception that risk must always be expressed immediately, or at least in short order. That mentality shows up in news stories that constantly seek to explain the movement of the financial markets on any particular day with some event that happened that same day. What these stories are actually reporting are triggers, not causes. Numerous other triggers would often have served just as well. In some cases, investors underestimate the amount of disruption needed to relieve latent risks, deciding that once a particular factor is widely discussed, it must be “priced into” the market. That mentality was clear during the dot-com bubble and again during the mortgage bubble. As a result, breakdowns in various sectors that should have been viewed as canaries in the coal mine were instead viewed as evidence that risk was “contained.” Why isn’t latent risk immediately followed by market losses? How can overvaluation persist for long periods of time without the market losing value in the near-term? We have to go back to that concept of “internal dispersion.” As I’ve frequently emphasized, the key factor - the “hinge” that distinguishes overvalued markets that continue to advance from overvalued markets that drop like a rock - is the attitude of investors toward speculation or risk aversion. Historically, we’ve found that the best measure of these attitudes is the uniformity or divergence of market internals across a broad range of individual stocks, industries, sectors, and security types, including debt securities of varying creditworthiness. Generally speaking, when investors are inclined to speculate, they tend to be indiscriminate about it. In contrast, increasing dispersion and recurrent small-scale corrections and recoveries at rich valuation levels are much like the increasing seismic events that happen just before a cliff collapses. The greatest danger comes when investors insist on speculating even after market internals have deteriorated and momentum has rolled over. Following a long period of speculative success, they may be tempted to ignore latent risks, and to keep speculating on the time-delay between the emergence of latent risks and their abrupt expression. They fall victim to the delusion that, in the words of Citigroup’s Chuck Prince just before the global financial crisis, “as long as the music is playing, you’ve got to get up and dance.” No, you don’t. When you insist on tap dancing at the edge of a fragile cliff, or lace up your skates when the ice is thin, each moment of success may offer false encouragement to press your luck, but it also ensures that you’ll have no escape when underlying risk inevitably meets an occasion to express itself. Current conditions, valuations, and profit margins With regard to current market conditions, we should be very clear that reliable valuation measures are presently consistent with S&P 500 nominal total returns in the range of 0-2% annually over the coming 10-12 year horizon. Given that the current S&P 500 dividend yield is slightly above 2%, this implies that we expect the S&P 500 Index itself to be lower a decade from now, than it is today (an expectation that I also correctly expressed in 2000 based on similar arithmetic). From a cyclical perspective, a 40-55% market retreat over the completion of the current cycle would represent a run-of-the-mill outcome, not a worst-case scenario. From a shorter-term perspective, while bullish sentiment has retreated modestly, bearish sentiment remains scarce, and the momentum components of trend-following measures have deteriorated enough that - combined with other considerations relating to valuations and market internals - market conditions have shifted our present outlook from fairly neutral to hard-negative. I’ll emphasize again that while valuations provide a highly reliable view of 10-12 year investment prospects, as well as useful guidance about cyclical return/risk prospects, they provide very little information about investment prospects over shorter portions of the market cycle. On that horizon, what matters most is the inclination of investors toward speculation and risk-aversion, which is best inferred from the uniformity or divergence of market internals (what I used to call “trend uniformity” during the tech bubble). That recognition served us extremely well in previous, complete market cycles. In contrast, our challenges in the half-cycle since 2009 (which I view as fully addressed by the adaptations we introduced mid-2014) underscores, rather than diminishes, the importance of focusing jointly on valuations and market internals. See the Box in The Next Big Short to understand that narrative, so you don’t mistakenly ignore market risks amid ad hominem attacks about things we’ve already discussed and addressed. While we prefer to compare market capitalization with corporate gross value added, including estimated foreign revenues, the following chart provides the most comprehensive historical review of where reliable valuation measures stand at present. The chart shows market capitalization / GDP, which Warren Buffett cited in a 2001 Fortune interview as “probably the best single measure of where valuations stand at any given moment.” Below, I’ve imputed some of the pre-war data points based on highly correlated proxy data that is available through the full period. Valuations are presented on an inverted log scale (blue, left), with actual subsequent S&P 500 annual total returns in red (right scale).
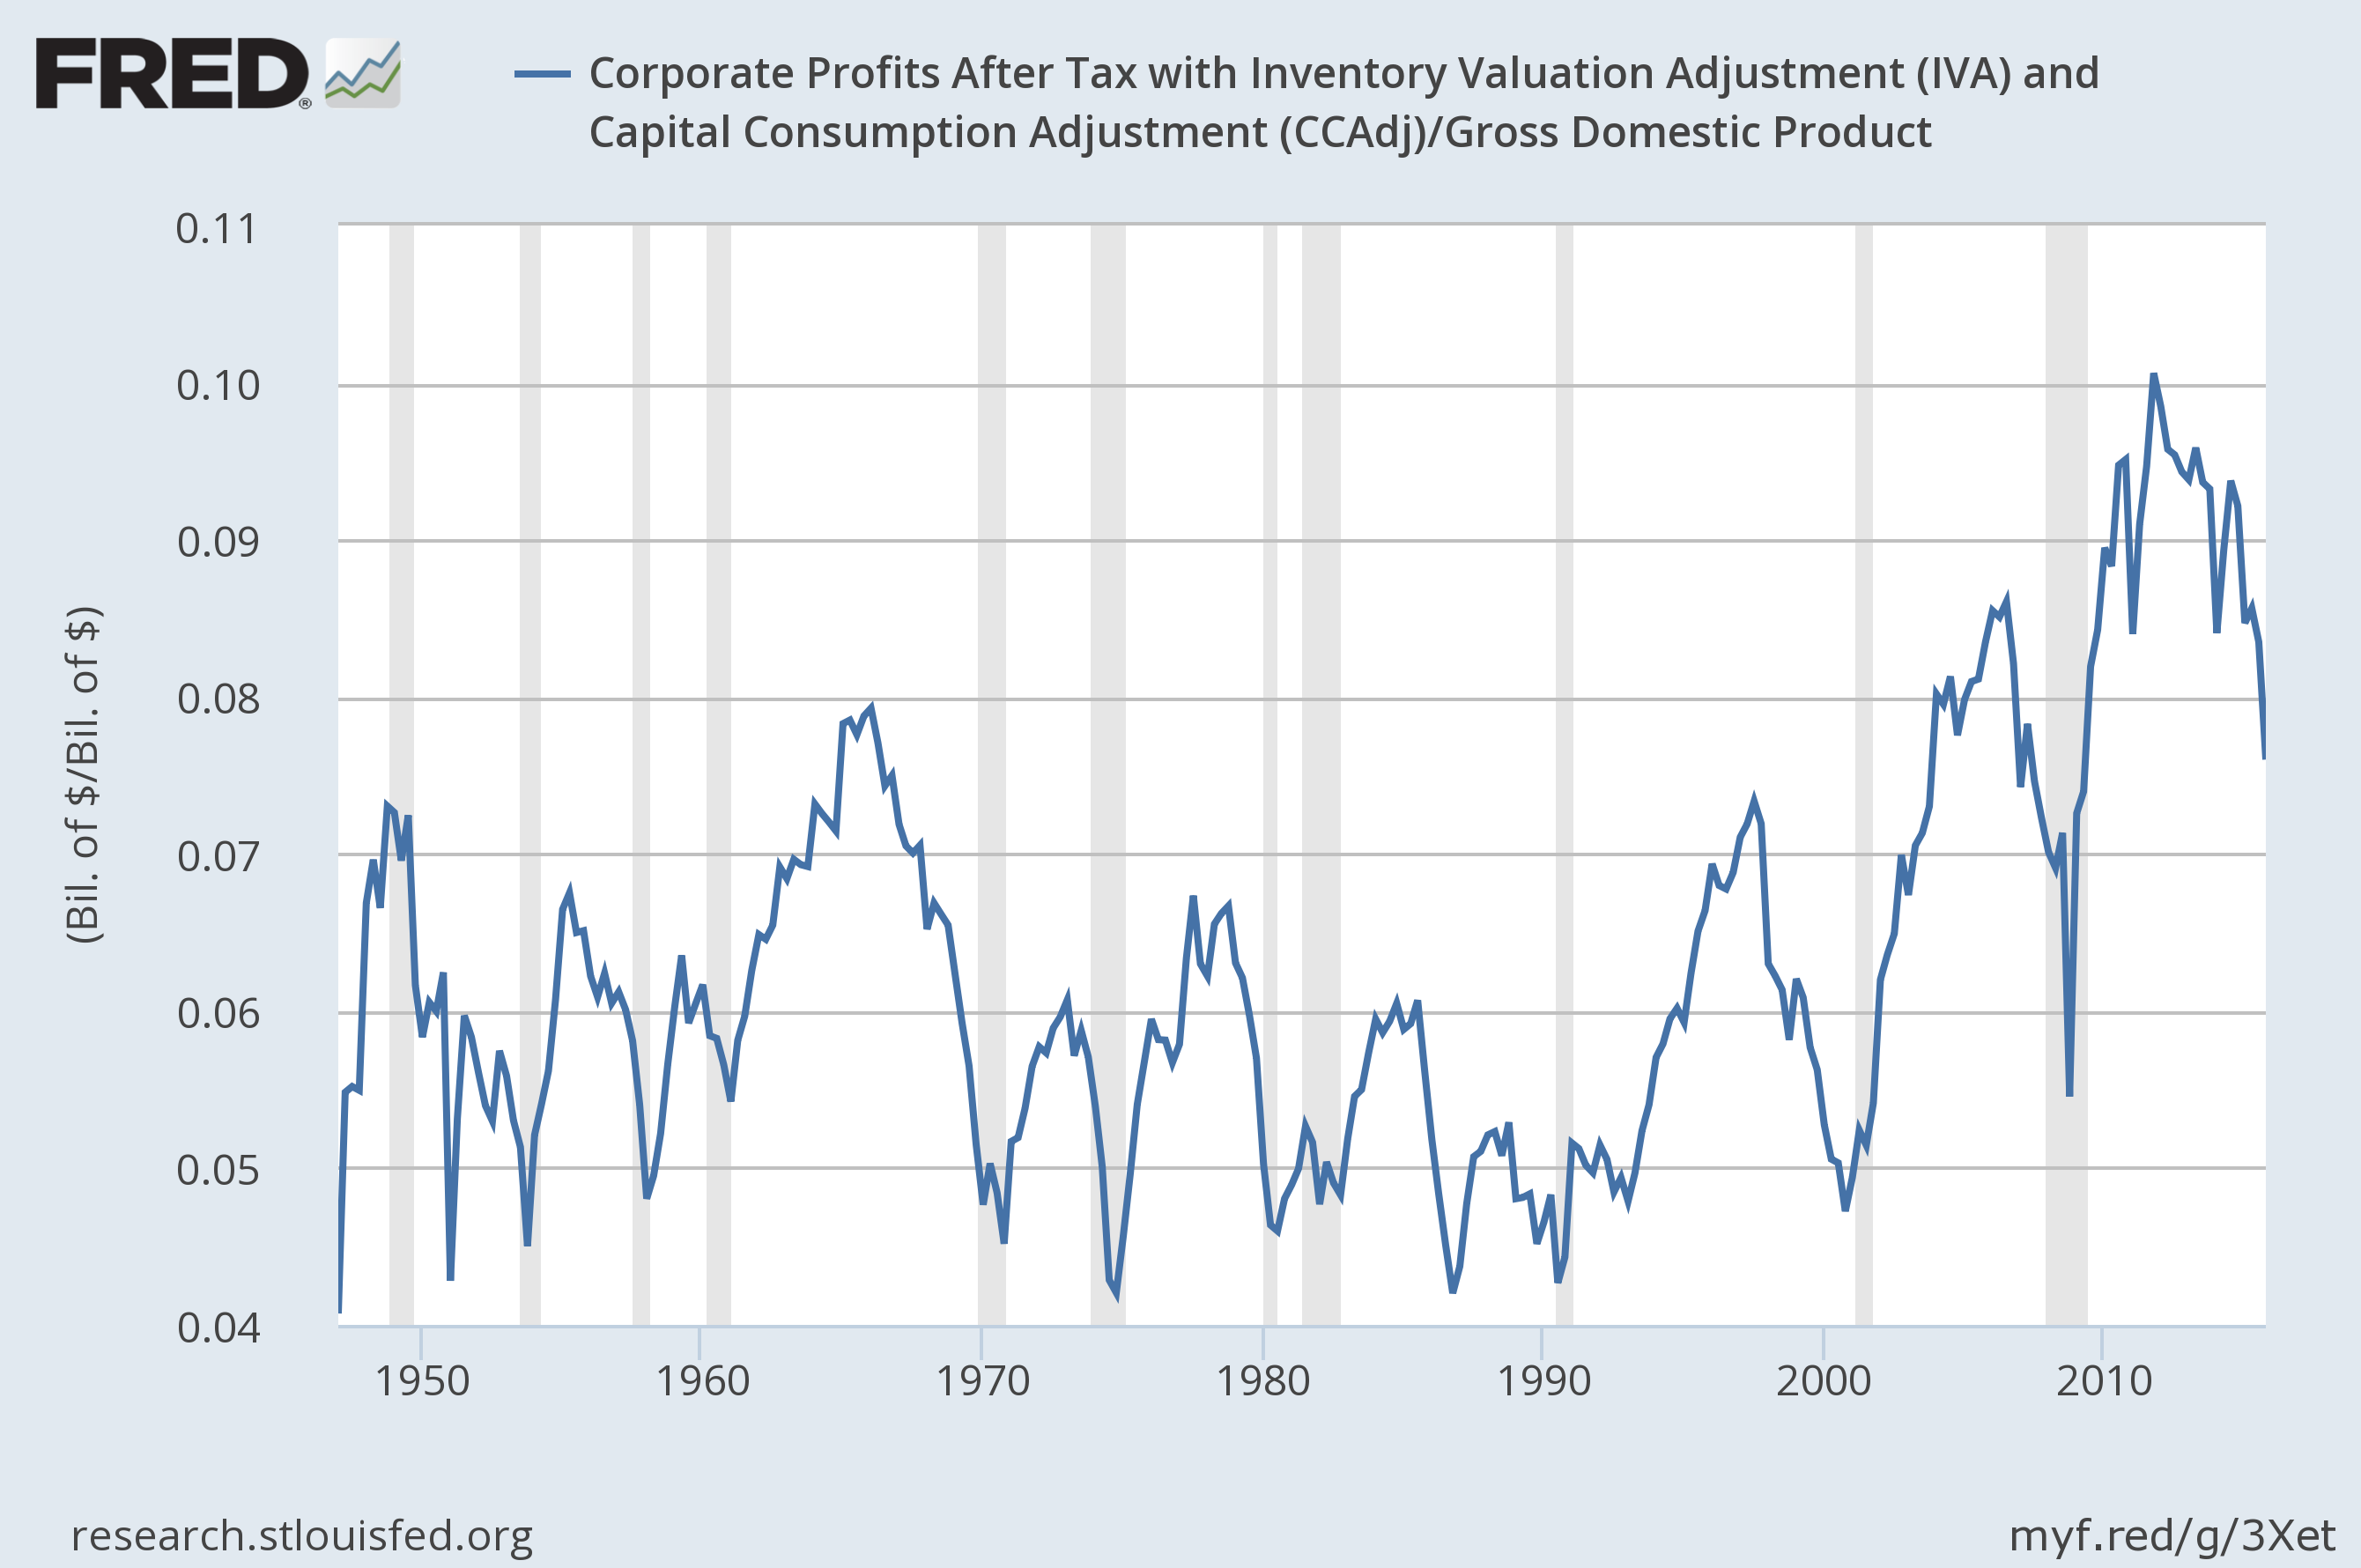
As I’ve frequently noted, the problem with many earnings-based measures is that while earnings are certainly necessary to generate the long-term stream of cash flows that can be delivered into the hands of investors over time, earnings are actually a poor “sufficient statistic” for those long-term cash flows because profit margins vary considerably over the economic cycle (see Margins, Multiples, and the Iron Law of Valuation for more detail and historical evidence on this point). There are a number of complementary ways to think about profit margins. From an accounting standpoint, we know that deficits in one sector have to be offset by surpluses in another. Accordingly, we know that large deficits, particularly in the government and household sectors, tend to be associated with surpluses in the corporate sector that we observe as elevated profit margins. We also import surplus foreign saving (which we observe as trade deficits), but since deterioration in the trade deficit tends to be matched by opposite movements in gross domestic investment, fluctuations in those terms of the savings-investment balance have less impact on profit margins (for a detailed analysis of these relationships, see An Open Letter to the FOMC: Recognizing the Valuation Bubble In Equities). Put simply, most of the fluctuation in corporate profit margins is a mirror-image of fluctuations in combined government and household saving. Historically, sum of government and household saving has averaged about 3.5% of GDP, but that figure moved to a deep combined deficit of nearly 7% of GDP in 2010. In recent quarters, that deficit has nearly vanished, which has been associated with a substantial decline in corporate profits as a share of GDP (see the chart below). We’re still not to the point where the combined savings of the government and household sectors are positive, but both have clearly moved in that direction.
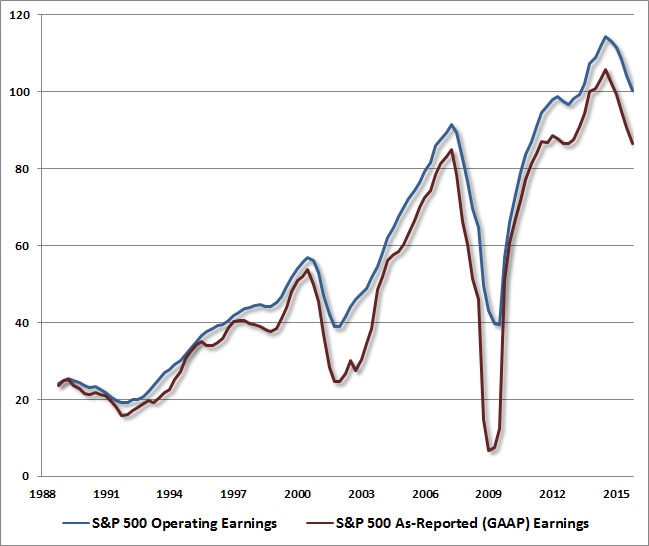
The following shows similar deterioration in S&P 500 earnings, both operating (which selectively excludes certain expenses in a way that often varies considerably company-by-company), and as-reported earnings following generally accepted accounting practices (GAAP).
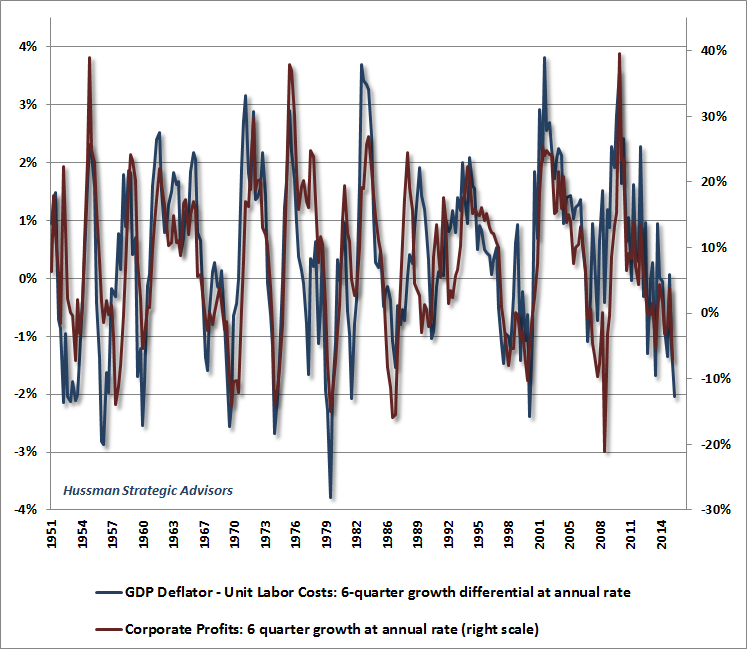
Another way to think about corporate profits is from the standpoint of input costs and output prices. Think of the GDP deflator as measuring the price at which a generic “unit” of goods and services can be sold in the economy. Meanwhile, think of unit labor cost as the amount that companies have to pay for the labor that goes into that “unit” of output. Unit labor costs rise when wages increase or productivity is weak, and fall when the converse is true. From this perspective, we would expect profit margins to rise when the GDP deflator is rising faster than unit labor costs, and we would expect profit margins to fall when the GDP deflator is rising slower than unit labor costs. As shown in the chart below, that’s exactly what we observe.
To believe that the recent decline in corporate profits will be quickly reversed is to either ignore or dismiss the underlying dynamics, which instead suggest the likelihood of further mean-reversion in profit margins. Note that the difference between unit labor costs and the GDP deflator has become particularly hostile to profits in recent quarters. Indeed, we’ve never seen unit labor costs rise more than 2% faster than the GDP deflator without being associated with a subsequent U.S. recession. That’s because the first response of companies in this situation is to economize on labor. Given that employment responds with a lag, we would expect this adjustment to occur over a number of quarters, rather than immediately. Emphatically - and this point is worth reflection - I am not concerned about major stock market losses because we expect profit margins to decline, or because present conditions remain consistent with an oncoming U.S. recession. Rather, my concern about profit margins is, and always has been, that they can create the mirage of reasonable valuations during periods when business conditions are strong. The argument is not “profit margins are going to decline, and that will bring prices down.” The simple fact is that profit margins don’t have a particularly high correlation with stock price fluctuations to begin with. Rather, the argument is that rich profit margins have distorted popular earnings-based valuation measures (as they always have, but to a much greater degree in recent years), so that investors vastly underestimate how obscene valuations have actually become. This argument continues to hold, and in my view, investors still have a small window to act on that recognition. As for economic risks, I’ll reiterate that while leading economic data are already sufficiently weak to raise concerns about recession, our views about the immediacy of those risks would be stronger if the stock market was to decline by even a few percent. Stock market declines, in and of themselves, have quite a weak relationship with recessions. However, when those declines occur jointly with tepid economic data on other fronts (for example, relatively weak new orders and order backlogs, declining industrial production, weakness in real sales, flat aggregate hours worked, and so forth), those tepid economic conditions generally deteriorate quickly for the worse. We’re more interested in accurately responding to the evidence as it emerges than in pounding the table with predictions, so it will suffice to emphasize a) our assessment of recession risk would increase substantially on a market break of even a few percent; b) we continue to view the 1820-1850 level on the S&P 500 as a sufficiently critical and widely-monitored threshold that a violation could be followed by concerted attempts by trend-following speculators to exit, but with little buying interest from value-conscious investors at price levels anywhere near that threshold, and; c) our expectation of a 40-55% market decline over the completion of the current market cycle doesn’t rely on any particular expectation of economic deterioration, but a market break of more than a few percent could present an occasion for steep downside risks - which are ultimately inevitable - to be more quickly realized. The foregoing comments represent the general investment analysis and economic views of the Advisor, and are provided solely for the purpose of information, instruction and discourse. Please see periodic remarks on the Fund Notes and Commentary page for discussion relating specifically to the Hussman Funds and the investment positions of the Funds. --- The foregoing comments represent the general investment analysis and economic views of the Advisor, and are provided solely for the purpose of information, instruction and discourse. Prospectuses for the Hussman Strategic Growth Fund, the Hussman Strategic Total Return Fund, the Hussman Strategic International Fund, and the Hussman Strategic Dividend Value Fund, as well as Fund reports and other information, are available by clicking "The Funds" menu button from any page of this website. |
|||||||||||||||||||||||||
|
For more information about investing in the Hussman Funds, please call us at
1-800-HUSSMAN (1-800-487-7626) 513-326-3551 outside the United States Site and site contents © copyright Hussman Funds. Brief quotations including attribution and a direct link to this site (www.hussmanfunds.com) are authorized. All other rights reserved and actively enforced. Extensive or unattributed reproduction of text or research findings are violations of copyright law. Site design by 1WebsiteDesigners. |