|
|
||||||
|
|

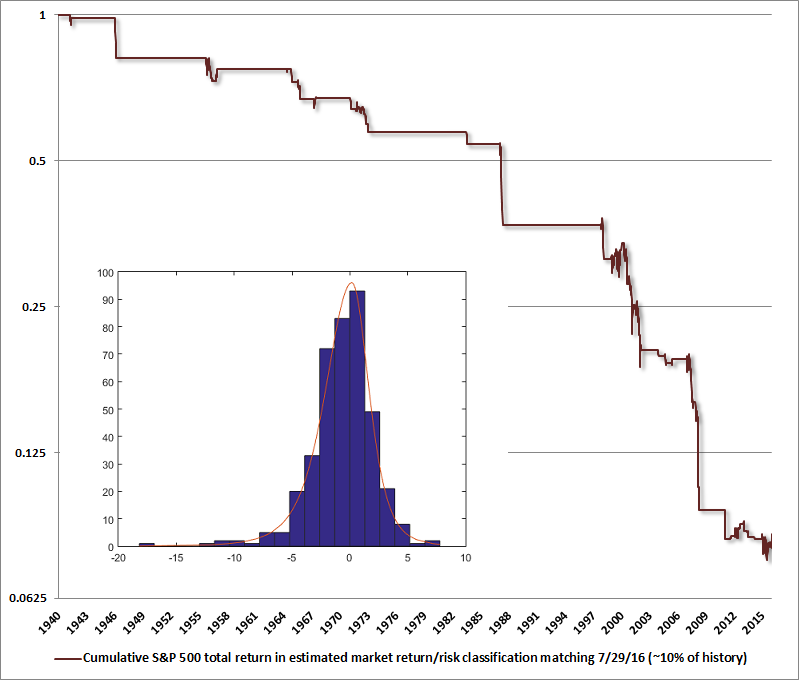
August 1, 2016 Impermanence and Full-Cycle Thinking My friend and teacher Thich Nhat Hanh once said, “It is not impermanence that makes us suffer. What makes us suffer is wanting things to be permanent when they are not. Wilting flowers do not cause suffering; it is the unrealistic desire that flowers not wilt that causes suffering.” We observe an extremely aged and overvalued bull market here; where the S&P 500 Index, despite the exuberance of “record highs,” is just 2% above its May 2015 peak; where the broad NYSE Composite remains below its June 2014 level; where international markets, despite a recent short-covering panic on post-Brexit monetary enthusiasm, remain in a larger pattern of retreat; where valuation measures most reliably correlated with actual subsequent outcomes in market cycles across history now imply S&P 500 nominal total returns averaging less than 1.5% annually over the coming 12-year period; where a retreat to even the richest valuations observed by the completion of any market cycle in the past century (even cycles where interest rates were depressed) would imply a market loss of at least 40% over the completion of the current cycle; where market internals remain mixed despite positive whipsaws in various trend-following components; where, as a minor technical point, any serious reading of Hamilton and Rhea would still classify stocks in an ongoing Dow Theory bear market that began more than a year ago; and where the S&P 500 has pushed to the most extreme “overvalued, overbought, overbullish” syndrome we identify, in an environment where cyclical momentum has rolled over. Whether one is bullish or bearish, if one recognizes that current extremes are impermanent, one will ultimately suffer less. Full-cycle thinking I should begin this comment by emphasizing that our current investment outlook is driven by the combination of market conditions that we observe at the moment, considering both valuations and market action, with components that include the behavior of internals, trend-following measures, sentiment, interest rate behavior, and other factors. Those conditions will change. The chart below shows the cumulative total return of the S&P 500 in the expected return/risk classification that we presently identify, based on observable evidence. This particular classification spans about 10% of periods across market history, and captures a cumulative market loss of over 91%. I’ve placed a little inset in the chart, showing a histogram of weekly returns that comprise that 91% cumulative loss in the S&P 500, as well as the probability distribution that we infer from those returns. Notice that while the cumulative progress of the S&P 500 in this return/risk classification may mislead investors to believe that something is going wrong if the market isn’t dropping like a rock, the actual weekly market outcomes that produce that seemingly stair-step decline include a large number of flat or positive returns. What really produces the awful cumulative market return in this particular classification is what I call “unpleasant skew” - the single most probable outcome is actually a small gain, but gains are regularly overwhelmed by abrupt, wicked losses that wipe out weeks or months of upside progress in one fell swoop. If you look at the edges of that probability curve, you’ll see that it has a long “left tail” and a short “right tail,” meaning that large moves are skewed to the downside, and steep losses are far more likely than strong gains. That’s a standard feature of a steeply “overvalued, overbought, overbullish” environment, particularly when market internals don’t feature robust and favorable uniformity.
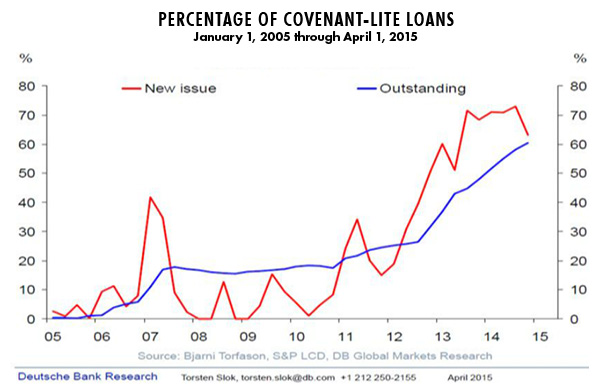
The present, strikingly negative market return/risk profile will change. I would certainly prefer this change to feature a steep retreat in valuations, followed by an early improvement in market action, which is an outcome that would shift the expected return/risk classification to the most favorable one we identify across history, but we’ll take the evidence as it arrives. Understand now that my identification as a “permabear” is an artifact of challenges we encountered after my 2009 insistence on stress-testing our methods against Depression-era data. I’ll emphasize again that our present methods (reflecting our mid-2014 adaptations) would encourage a constructive or aggressive investment stance across about 71% of market history, including significant portions of recent market cycles. We know very well that maintaining a patient, value-conscious, historically-informed discipline does, in fact, require patience and discipline. We’re committed to that discipline, we’ve always attempted to adapt it to new evidence, and we certainly enjoyed the benefits of that in complete market cycles prior to the recent speculative half-cycle advance. I’ve been asked whether it’s frustrating to maintain a defensive outlook when the S&P 500 has made new highs. The answer is that while we experienced great frustration in this half-cycle prior to the adaptations we introduced in mid-2014, we’re quite comfortable with our present outlook because we know how frequently the same investment discipline that makes us defensive here would have encouraged a constructive or aggressive outlook in market cycles across history, including recent ones, as conditions have changed. While it’s true that our own outlook is often uncorrelated or inversely correlated with that of others, we’ve never taken a hit as deep as the 2000-2002 or 2007-2009 losses in the S&P 500, and certainly nowhere near those of the Nasdaq. The completion of a market cycle dramatically changes compound arithmetic. A fairly run-of-the-mill completion of the current cycle would wipe out the entire total return of the S&P 500 since 2000. In an advance that’s longer in the tooth than any speculative episode except the one that ended with the 2000 peak, and with the most reliable valuation measures more extreme than at any peak other than 1929 and 2000, one might consider Kenny Rogers’ advice: never count your money while you’re sitting at the table. It remains clear that every advance in a speculative market transforms “expected future return” into “realized past return,” leaving less and less on the table for long-term investors. Over the completion of every market cycle, that process is also reversed, and as prices collapse, poor prospects for long-term return are transformed into strong ones. My error in the recent half-cycle was underestimating how dismal the long-term returns were that investors would be willing to accept (and, identically, how extreme the valuations were that investors would be willing to pay). We had to abandon the belief that any amount of historically-informed rationality might prevail among policy makers or investors, without abandoning tools that would help us to navigate a deranged financial environment. In the presence of zero interest rates, previously reliable “overvalued, overbought, overbullish” warnings were not enough. One had to wait for market internals to deteriorate, indicating a subtle psychological shift toward increasing risk-aversion, before adopting a hard-negative market outlook (see the “Box” in The Next Big Short for the full narrative). The adaptations we introduced in mid-2014 would have had a dramatic effect on our willingness to accept market exposure during much of the half-cycle since 2009, even encouraging a leveraged position at various points. Since mid-2014, the broad market has gone nowhere, but has lagged the capitalization-weighted S&P 500. That difference has still created something of a headwind for hedged-equity strategies. Still, for us, it’s been critical to focus on factors that distinguish overvalued markets that continue higher from overvalued markets that collapse, because this extreme, too, will ultimately collapse. I have no question that this cycle will be completed, and the market return/risk profile will change substantially over that course. That’s where we differ from speculators who insist on the permanence of the recent bull market; who, ignoring the ineffectiveness of persistent monetary easing during the 2000-2002 and 2007-2009 collapses, rely central-bank stick-saves to ratchet the markets along a permanently high plateau. To deny impermanence is to invite suffering, and unfortunately, no amount of evidence seems capable of averting the belief of speculators in permanence. So they will suffer. “Sell everything” At present, the greatest risk of ignoring impermanence is the belief that market risk has been removed from any consideration, and that even the most obscenely overvalued markets should never be sold. We can see that belief reflected in current price/volume data, as the post-Brexit plunge in interest rates mesmerized investors and prompted a low-volume “sellers strike.” As a security moves from one level of overvaluation to an even more extreme level of overvaluation, looking over one’s shoulder at positive past returns can reinforce the notion that the advance will never end. But extreme valuations imply dismal future returns, and that’s largely forgotten amid the eager lip-smacking of investors for ever lower or even more negative interest rates. Understand that at a 10-year Treasury yield of 1.45%, investors stand to earn a cumulative total return of about 15% on those bonds between today and their maturity a decade from now. If one invests at current prices, nothing will make that long-term return better. Driving interest rates to negative levels in the interim won’t change the arithmetic. It would only front-load the returns, leaving only losses available to investors for the remaining portion of the decade. Put differently, the most that investors can expect to gain in 10-year Treasury bonds over any horizon, without subsequently giving it back over the coming decade, is about 15%; unless they actually sell at rich valuations and poor long-term yields. The urging of central banks, which has become nearly a form of propaganda, is that there will always be a lower rate, a higher price, and a greater fool. The effect of this is not to repeal market cycles, but to extend their recklessness in a way that increases the risk of Depression. The majority of global debt is now “covenant lite,” providing little protection against bankruptcy. Accordingly, recovery rates have already fallen to the lowest level in history, and we haven’t even seen a recession.
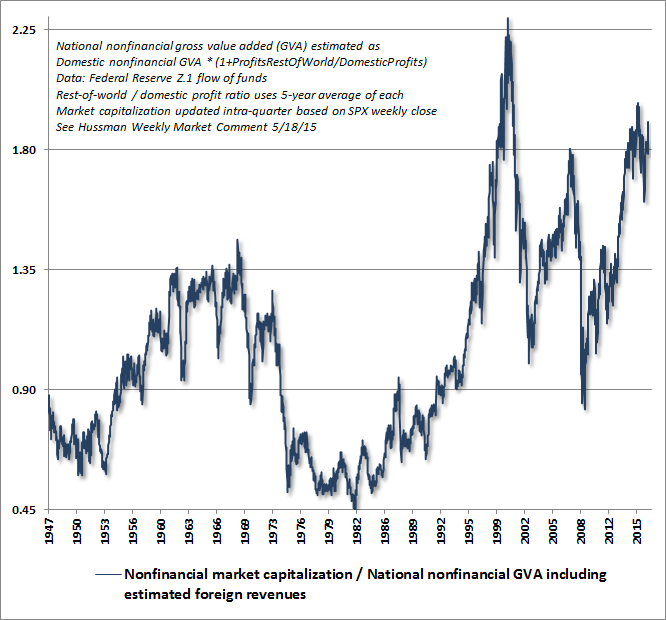
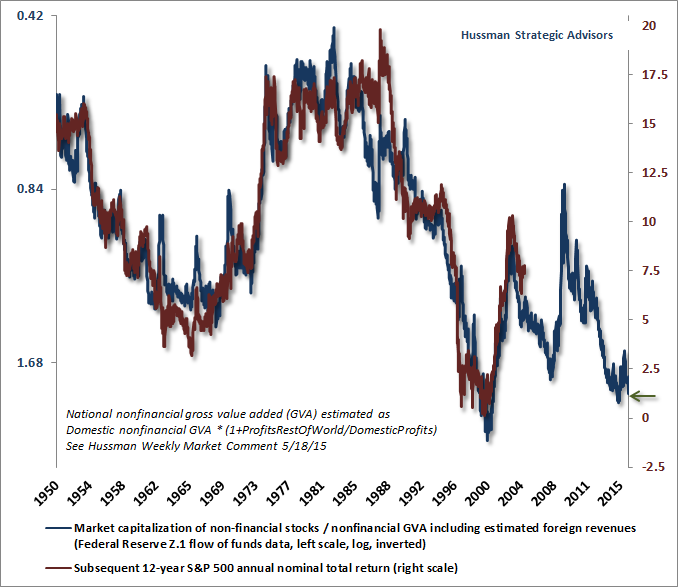
Likewise, the most reliable valuation measures imply that stock market investors can expect a cumulative total return in the S&P 500 of less than 20% over the coming 12-year period, all of that from dividends. This projection is robust to assumptions about future growth and interest rates, as detailed in Rarefied Air: Valuations and Subsequent Market Returns. We can’t rule out the front-loading of those returns either, and we’ll take our cues from market internals and related factors. But again, we estimate that the most investors can expect to gain in the S&P 500 over any horizon, without giving it back by the end of the coming 12-year period, is less than 20%; unless they actually sell at rich valuations. Frankly, my opinion is that we are at the peak of the third speculative episode since 2000, and I doubt that the S&P 500 will approach or exceed current levels again until late in that 12-year horizon. However, we remain more flexible toward changes in market conditions and the associated investment outlook than observers might imagine. Even at current extremes, we could embrace an outlook that might be described as “constructive with a safety net,” provided that we see a greater improvement in market internals across a broad range of individual stocks, industries, sectors and security types (when speculators are risk-seeking, they tend to be indiscriminate about it). That possibility would be particularly relevant if short-term interest rates were to drop back into single basis points. There’s no question that a robust shift to fresh speculation would make long-term matters even worse, but that’s the point of a safety net. In any event, I’m quite certain that the range of investment conditions in the coming 2-3 year period, and our response to them, will be far more varied than many appear to expect. The following charts bring the valuation picture up-to-date. The first shows the ratio of nonfinancial market capitalization to corporate gross value-added. MarketCap/GVA is more strongly correlated with actual subsequent S&P 500 total returns than a score of alternative measures we’ve examined across history. It is also generally consistent with the broader class of reliable valuation measures (Shiller P/E, market cap/GDP, Tobin’s Q) that are defined by the fact that they mute the impact of cyclical variability in profit margins.
The chart below shows MarketCap/GVA on an inverted log scale (blue line, left scale), along with the actual subsequent S&P 500 annual nominal total return over the following 12-year period (red line, right scale).
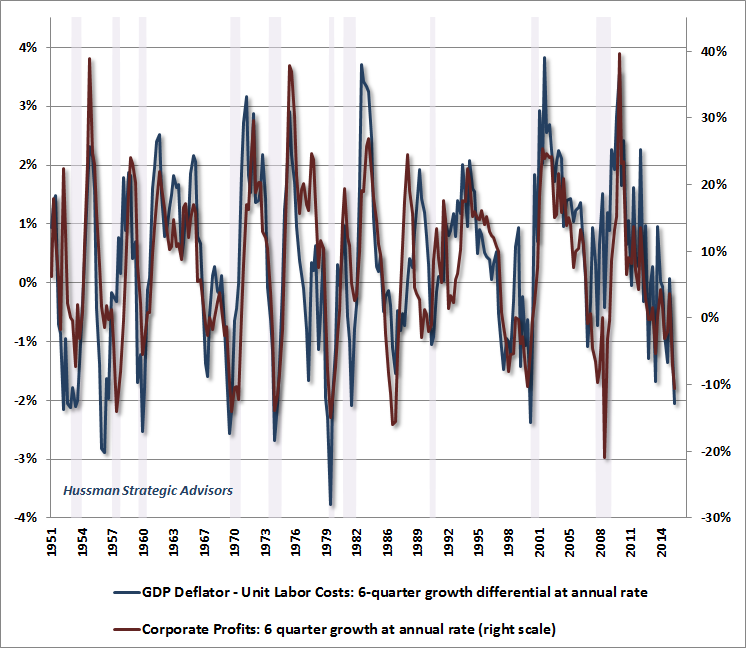
I should note that corporate debt as a fraction of corporate gross value-added has surged to the highest level in history. As profits have begun to stumble, companies have aggressively issued debt, using the proceeds to repurchase stock in order to boost per-share earnings. The problem is that even today’s depressed corporate yields are higher than the prospective total return we estimate for U.S. stocks over the coming 10-12 year period. As a result, stock repurchases, far from being a benefit to shareholders, represent a destruction of shareholder value. The only shareholders who benefit from stock repurchases here are those who are cashing out, leaving remaining shareholders to hold a more concentrated and leveraged bag over the completion of this cycle. As for corporate bonds, be sure to distinguish stated yield from realized yield. Over the completion of this cycle, buyers of corporate debt are unlikely to realize those stated yields once defaults kick in and low recovery rates eat into them. This whole speculative mania will end tragically. How did we not learn this from 2000-2002, or 2007-2009, or the collapse of every other mania in history? My sense is that it’s a mistake to assume that yield-seeking hasn’t been fully exhausted across every class of securities. The notion that some “pocket” of value and opportunity remains untapped is largely based on a misunderstanding of yield relationships (e.g. the Fed Model). While we do still estimate a positive expected return/risk profile in precious metals shares, even these will be vulnerable if we observe even modestly greater dollar strength or slightly lower inflation. Meanwhile, there’s some potential for Treasury yields to decline a bit further in the event of an economic softening, but at this point, even that is more a speculation than an investment. The bottom line is that we’re inclined to limit risk exposure in every class of investment here. Over the weekend, Jeff Gundlach of DoubleLine observed, correctly I think, that investors have “entered a world of uber complacency,” advising “Sell everything. Nothing here looks good. You can’t save your economy by destroying your financial system.” Likewise, Jim Grant of Grant’s Interest Rate Observer was asked by Barron’s where investors might find opportunities for yield. He replied “I’m stumped. I’m not going to try to find opportunities where they can’t be found.” For those who insist that there is always a bull market somewhere, I would suggest that the most likely bull market to emerge here will be in bear market assets. Fortunately, inevitable periods of investor panic, speculative collapse, and improved valuation can shift market return/risk prospects substantially, which creates new opportunities for conventional assets. Long live impermanence. Economic notes An environment of continued low interest rates is almost necessarily an environment of dismal economic growth. That point was reinforced last week by the anemic 1.2% annualized growth reported for second-quarter GDP. The 5-year growth rate of U.S. labor productivity has dropped to just 0.8% annually, the lowest level in post-war history except the third-quarter of 1982. But unlike 1982, we observe no meaningful prospect for labor productivity to be boosted by fresh accumulation of real gross domestic investment. Instead, U.S. real gross domestic investment has grown since 2000 at just 0.8% annually, less than one-fifth of the 4.6% annual growth it enjoyed over the preceding half-century. Over the past decade, real gross domestic investment has actually contracted. It is utterly mind-numbing that U.S. economic policy has gone off the rails to prioritize debt-financed consumption over productive investment. This misguided focus will destroy the U.S. economic future if we don’t diminish the Federal Reserve and build up our productive capital stock. The 5-year growth of the U.S. labor force has averaged just 0.7%, and demographic trends suggest a slowing to 0.5% in the coming years. Even if the participation of this potential labor force in the job market (currently the lowest level since 1977) was to increase back to the highs of 2000, it would only add another 0.6% annually to employment over the coming decade. Given zero growth in gross domestic investment over the past decade, stagnant labor productivity appears likely, but let’s optimistically assume it remains at 0.8% annually. Combine labor force growth and participation with productivity, and the upshot is that without a substantial boost to gross domestic investment, 2% real GDP growth is a best-case scenario in the coming decade, with GDP growth of just 1% being more likely. Meanwhile, with unit labor costs now rising substantially faster than the GDP deflator, corporate profit margins are shrinking, not expanding (see the chart below to understand the underlying reason that earnings expectations are being persistently downgraded). Slow growth in real and nominal revenues, combined with narrowing profit margins, implies a challenging outlook for corporate profits.
Investors are currently paying extravagant multiples on cyclically elevated earnings, at a point where a misplaced focus on debt-financed consumption and yield-seeking speculation has ravaged U.S. real investment and the accumulation of productive capital, setting the stage for persistently anemic economic growth. The situation will become far more promising for investors after a steep retreat in valuations, particularly if policy makers ever become enlightened enough to shift our economic focus toward incentives for productive capital investment at the private level, expanded infrastructure at the public level, and the accumulation of knowledge, job training, and education at the individual level. As I’ve regularly emphasized, the true wealth of any nation is embodied in its accumulated stock of productive capital, infrastructure, unused resources, and knowledge. The use of this productive capital to generate “value-added” - goods and services that have a greater value than the inputs used to produce them - is how new income, productive capital, and wealth emerge. The Federal Reserve’s deranged and wholly experimental attempt to create illusory paper “wealth” through speculative overvaluation is no substitute for thoughtful and historically-informed economic policy. Holding interest rates down too low, for too long, is exactly how Fed-induced yield-seeking speculation created a bubble in mortgage debt and housing, and triggered the deepest financial collapse since the Great Depression. Now that the Fed has repeated this error, it has painted itself into a corner where even a timid quarter-point interest rate hike is the subject of quivering indecision. Unfortunately, having pushed the system to a speculative extreme, a collapse is baked in the cake. Remember that risk-free liquidity is only a hot-potato that provokes speculation if it’s regarded as an inferior asset, which is why Fed easing has the greatest effect on the market when investors are already inclined to speculate. Once losses and defaults kick in, risk-free liquidity is instead regarded as desirable, so creating more of the stuff doesn’t trigger a yield-seeking game of hot-potato, and does nothing to halt a panic. That’s why persistent Fed easing did nothing to keep the market from collapsing in 2000-2002 and 2007-2009. The insistence of central banks on promoting yield-seeking speculation, a game that always ends in destruction, reminds me of the 1983 Cold War movie “War Games” where a teenage Matthew Broderick hacks into a Defense Department computer called WOPR, and launches a “global thermonuclear war” simulation that’s mistaken for the real thing. How much yield-seeking speculation do central banks have to provoke, and how much do future economic prospects have to be injured, before they stumble onto the same conclusion as WOPR: “A strange game. The only winning move is not to play.”The foregoing comments represent the general investment analysis and economic views of the Advisor, and are provided solely for the purpose of information, instruction and discourse. Please see periodic remarks on the Fund Notes and Commentary page for discussion relating specifically to the Hussman Funds and the investment positions of the Funds. --- The foregoing comments represent the general investment analysis and economic views of the Advisor, and are provided solely for the purpose of information, instruction and discourse. Prospectuses for the Hussman Strategic Growth Fund, the Hussman Strategic Total Return Fund, the Hussman Strategic International Fund, and the Hussman Strategic Dividend Value Fund, as well as Fund reports and other information, are available by clicking "The Funds" menu button from any page of this website. |
|||||||||||||||||||||||||
|
For more information about investing in the Hussman Funds, please call us at
1-800-HUSSMAN (1-800-487-7626) 513-326-3551 outside the United States Site and site contents © copyright Hussman Funds. Brief quotations including attribution and a direct link to this site (www.hussmanfunds.com) are authorized. All other rights reserved and actively enforced. Extensive or unattributed reproduction of text or research findings are violations of copyright law. Site design by 1WebsiteDesigners. |