|
|
||||||
|
|

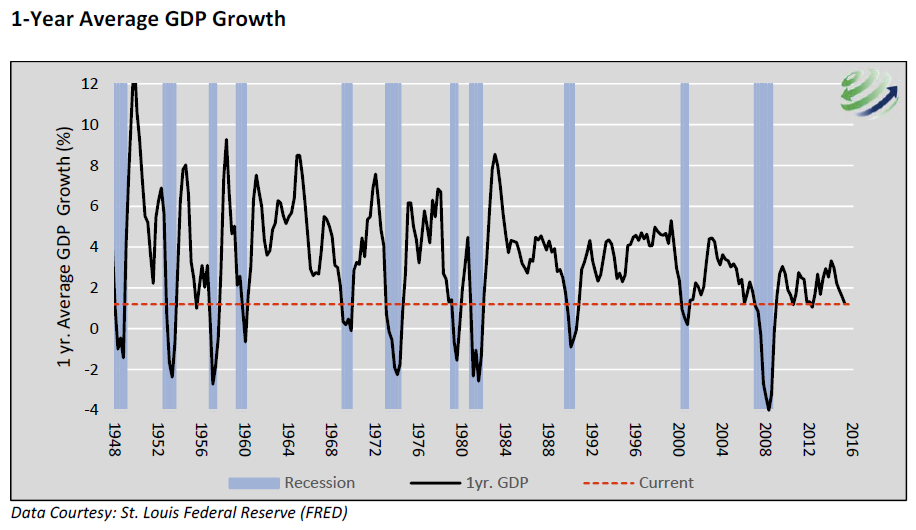
August 8, 2016 Morton's Fork Despite the bump in the S&P 500 to marginal new highs on better-than-expected employment figures last week, the expected market return/risk profile remains in the most negative classification we identify. That said, I’ve emphasized in recent weeks that some trend-following components among our measures of market internals have improved, and while the overall profile hasn’t improved, we’re also not pounding the tables about near-term market losses. Concerns about major, imminent losses would become much more pointed in the event the S&P 500 breaks below the 2000 level. At present, we continue to classify the overall risk/return profile as negative, but characterized by "unpleasant skew," with a short right tail and a fat left tail. Over the near-term, the single most likely outcome in any given week is actually a modest gain, but those outcomes are coupled with a smaller probability of wicked losses, so the "mode" of the distribution is positive, but the average outcome is significantly negative (the chart in last week's comment, Impermanence and Full-Cycle Thinking, includes an inset to illustrate what this looks like). On the economic front, the data aren’t screaming negative either, but the overall situation is much less constructive than lagging employment data might suggest. Indeed, despite a better-than-expected July payroll gain of 255,000 jobs, the 3-month average of employment gains remains below the 12-month average, and the 1.7% year-over-year growth in payroll employment is still not far from the 1.4% rate that has typically been slow enough to observe at the start of most U.S. recessions. Meanwhile, U.S. industrial production has been in decline for over 18 months, and GDP growth has also slowed to rates consistent with the start of recessions. Here again, fresh market weakness, particularly below S&P 2000, would substantially elevate our concerns, but the main point is that economic data isn’t nearly as strong as a one-variable, one-month employment surprise might suggest. As Michael Lebowitz of 720 Global observes with respect to real U.S. GDP growth: “All recessions since 1948 started with an average growth rate greater than the current 1.20% rate. “There are only three instances where the 1-year growth rate was below the current level and recession did not occur. In the two most recent instances (2011/2012), weak growth was met with renewed rounds of extraordinary stimulus in the form of quantitative easing (QE). “Only 18% of all observations going back to 1948 are below the current 1.20% level. “Of that 18%, 94% occurred during or within a quarter of a recession.”
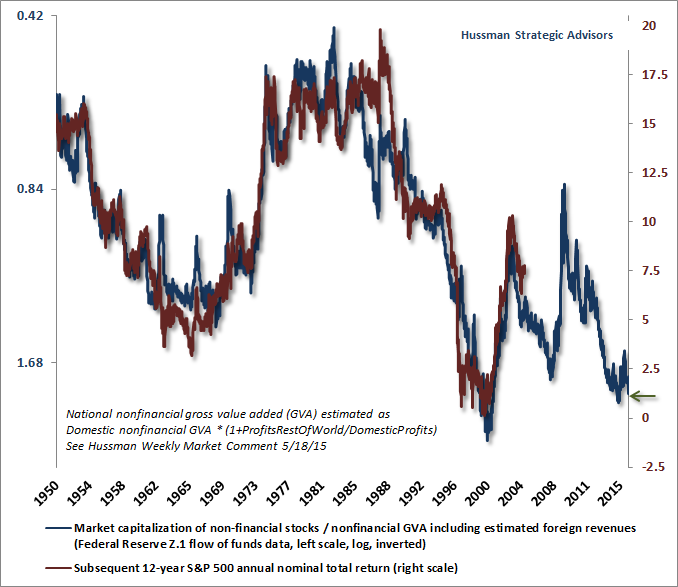
Having incorrectly anticipated an oncoming recession in the 2011-12 period, and with equity market action still holding to what we view as a very extended top formation (the S&P 500 Index has gone essentially nowhere since May 2015, and the NYSE Composite remains below the level it set in June 2014), my inclination is to defer any table-pounding about recession risk until the warning signals we observed earlier this year are refreshed. In particular, my own recession concerns would be substantially amplified on a break of the S&P 500 materially below the 2000 level, coupled with a retreat in year-over-year payroll employment growth below about 1.4% and a renewed widening of credit spreads. At present, it’s sufficient to recognize that the actual economic evidence remains fairly mixed. Morton's Fork In all of the exuberance about low interest rates “justifying” elevated equity valuations, what’s striking is how little investors appear to appreciate the Morton’s Fork - two opposing possibilities that lead to the identical outcome - they’re actually facing. Whether one believes that economic growth will remain dismal and interest rates will remain low, or that economic growth will accelerate and interest rates will gradually normalize, the inevitable outcome for market returns is likely to be very much the same. Specifically, investors should fully expect that over the coming 12-year horizon, the nominal total return of the S&P 500 will average less than 1.5% annually. The chart below presents one of the reasons for this expectation, broadly consistent with a whole class of valuation measures that have extremely high correlations with actual subsequent S&P 500 total returns on a 10-12 year horizon. Again, the most historically reliable valuation measures we identify are consistent with expected 12-year S&P 500 total returns averaging less than 1.5% annually. See Blowing Bubbles: QE and The Iron Laws for a more extended chart using the ratio of market capitalization to nominal GDP since the 1920’s.
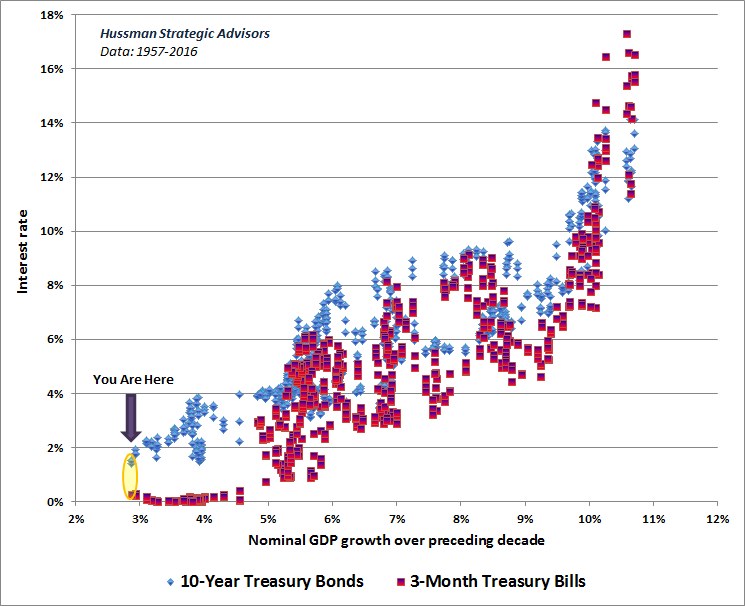
It’s fine to assert that the S&P 500 is “fairly valued” here, provided that “fair” is defined as an expected nominal total return averaging less than 1.5% annually on the S&P 500 over the coming 12-year period. Understand that when anyone says that stock market valuations are “justified” by the low level of interest rates, that’s exactly what they mean, whether they realize it or not. Put simply, years of yield-seeking speculation have already driven stock valuations to levels where prospective 10-12 year total returns for the S&P 500 are likely to be no different than the near-zero yields available on Treasury securities. The main difference is that equities have several times the volatility and downside risk. GDP growth, interest rates, and equity returns As I detailed in Rarefied Air: Valuations and Subsequent Market Returns, the correspondence between reliable valuation measures and subsequent long-term market returns is almost entirely independent of the level of interest rates or economic growth. Be careful not to misinterpret that statement. I am not at all saying that interest rates and economic growth don’t affect valuations. Rather, as discussed below, once interest rates and economic growth exert their effect, reliable valuation measures behave as sufficient statistics for subsequent market returns; various levels of starting valuation have a virtually one-to-one correspondence with the market returns investors experience over the subsequent 10-12 year horizon. Since this may be a source of confusion, let’s start with a simple bond example, and then we’ll extend it to stocks. Consider a particular 10-year Treasury bond with a specific coupon payment and expiration date. Let’s call that bond Harold. Undoubtedly, factors like economic growth and the interest rates available on other Treasury bonds will all have a strong impact on Harold’s valuation. The point, however, is that once we know Harold’s valuation, we can immediately calculate Harold’s 10-year return. We don’t have to “correct” Harold’s valuation for the prevailing level of interest rates. No, Harold’s valuation is a sufficient statistic for future returns. It turns out that this same principle, perhaps surprisingly, extends to reliable measures of equity market valuation as well, for reasons detailed below. One striking feature of market history is that the correlation between 10-12 year S&P 500 nominal total returns and nominal GDP growth over the same period is quite literally zero. Instead, market returns on that horizon are almost entirely determined by the starting level of valuation on reliable measures such as MarketCap/GVA. While there’s strong evidence that investors respond to past nominal GDP growth in setting the level of interest rates and equity valuations, it bears repeating that once those valuations are set, subsequent investment returns are essentially baked-in-the-cake. One of the reasons for the low correlation between GDP growth and market returns over the same horizon is that regardless of cyclical variations, nominal GDP has typically reverted to a fairly robust 6% growth trajectory when measured peak-to-peak across economic cycles. In recent years, growth has materially fallen short of that trend. Without a clear acceleration back to the 6% historical norm, it’s quite possible that prospective 12-year S&P 500 total returns will be even less than the roughly 1.5% annual returns we expect. However, the other side of that coin is that substantially lower nominal GDP growth would also be associated with lower interest rates for a longer period, which would tend to boost terminal valuation multiples at the end of the 12-year horizon. Generally speaking, growth and interest rate effects like this have regularly canceled each other out across history. That’s why the correspondence between starting valuations and subsequent returns has typically been stable regardless of whether economic growth turns out to be fast, slow, inflationary, or disinflationary. When one examines the data across history, it becomes clear that investors are suckers for recent experience. Give investors an extended taste of low nominal economic growth over a 10-year period, and they systematically drive interest rates lower, including long-term interest rates. The kicker here is that past nominal growth rates are very weakly correlated with subsequent nominal growth rates (the correlation between past 10-year and subsequent 10-year nominal GDP growth is less than 0.25). So investors tend to set interest rates by attending to the most recent thing they see in the rear-view mirror. The chart below illustrates this tendency, in post-war data, for investors to set interest rates largely in response to past growth in nominal GDP.
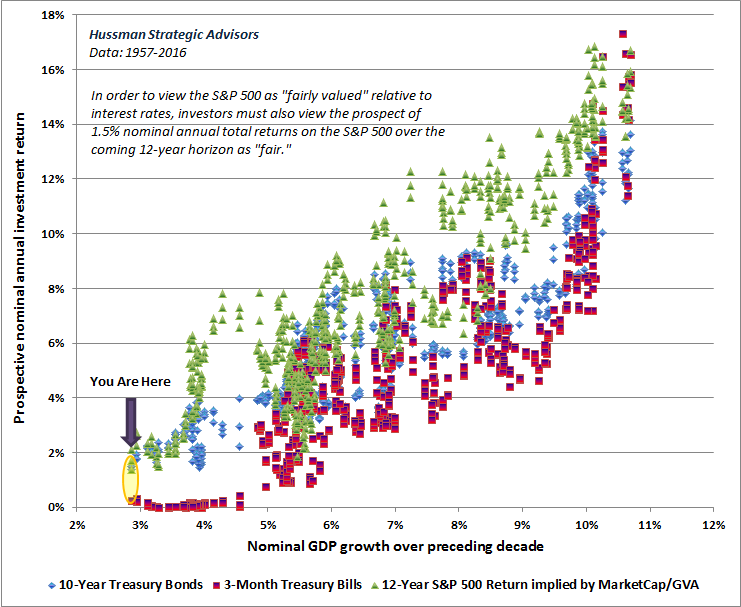
In prior comments, I’ve shown that short-term interest rates have, for a century, demonstrated a very well-defined relationship to the ratio of monetary base to nominal GDP (our version of the so-called “liquidity preference curve” – see Blowing Bubbles: QE and the Iron Laws for a recent chart). Yet it’s clear from the chart above that much of the fluctuation in interest rates over time has been loosely associated with the prior growth rate of nominal GDP, suggesting that interest rates are “determined by the market.” The fact is that throughout most of history, before central bankers became nutty as a fruitcake, it was hard to distinguish whether short-term interest rates were determined by the market or by the Fed. That’s because, as Stanford economist John Taylor has pointed out, the movement of the Federal Funds rate through most of history has been well described by fairly simple policy rules. But look at the compressed scatter of red dots on the left side of the graph above, when short-term interest rates were pressed straight to zero once 10-year nominal growth fell below 5% annually. That’s pure central bank intervention. You’ll notice that the range of scatter has also narrowed for 10-year Treasury yields in the lower-left region of the chart. It’s really this compression that’s unlikely to last. Even though central banks, via the liquidity preference curve, can hold short-term interest rates near zero (as long as no inflation shocks emerge), we would expect 10-year Treasury yields to take on a broader range of fluctuation in the 1-4% range in the coming years, despite Treasury bill yields currently at just 0.25%. The following chart adds another series, which is the prospective 12-year S&P 500 total return implied by MarketCap/GVA (which has a 93% correlation with actual subsequent market returns on that horizon). Note that prospective equity returns generally have a wide scatter. For example, the dismal 12-year returns we observe at present were also observed at the 2000 market peak, when trailing nominal GDP growth was close to 6% annually. The compressed block of green points at the bottom left reflect the lowest level of nominal growth observed in the post-war era, along with equally dismal prospective investment returns. Those awful 10-12 year prospects for investment returns in stocks and bonds are now baked in the cake, and as noted above, will be largely independent of where economic growth goes from here. Take the green, red, and blue points together, and the combined result is that the expected 10-12 year return on a conventional portfolio mix (60% stocks, 30% bonds, 10% cash) has plunged to one of the lowest levels in history.
Again, notice that the green scatter (prospective stock market returns) has had a much narrower range than usual as it has approached the current point in recent years. This too is unlikely to persist. Even without any pickup in nominal GDP growth or interest rates, investors should fully expect the prospective 12-year return on stocks to fluctuate in a much broader range than we’ve observed recently. It’s important to note that the chart above shows only post-war data. In data prior to 1957, the scatter of prospective stock market returns appears much looser at low interest rates. In particular, pre-war nominal GDP growth regularly hovered near zero, and while interest rates were quite depressed, equity valuations regularly fell to levels consistent with 8-12% S&P 500 total returns on a 10-12 year horizon. It’s clear that weak economic growth and low interest rates have contributed to today’s extreme valuations, but it’s also clear that 10-year growth has now fallen to the lowest level in post-war history. Moreover, U.S. real gross domestic investment has slowed dramatically since 2000, and has actually contracted over the past decade; a striking shift from the 4.6% annual growth that fueled growing productivity and living standards in the preceding half-century. With the combination of equity market capitalization and corporate debt at the highest multiple of corporate gross value-added in history, don’t imagine that the stock market can’t retreat substantially even if GDP growth remains depressed. Remember that every market cycle in history (even those prior to 1957 when interest rates and economic growth were often comparably low) has ended by restoring prospective returns to 8% or higher. Investors certainly should not rule out 8% in this cycle. Equity valuations aren’t likely to sit range-less at current extremes, even if short-term interest rates do. The analysis in Choose Your Weapon maps out the levels on the S&P 500 that would be consistent varying expectations for 12-year nominal total returns. Among those S&P 500 levels and associated prospective 12-year returns, here are some current estimates: 1763 (4%), 1480 (6%), 1246 (8%) and 1052 (10%). Given that weak long-term market returns are effectively baked in the cake, the only real question in this matter relates to cyclical risk over shorter horizons; whether the S&P 500 will experience a typical full-cycle completion, or whether central banks will encourage enough yield-seeking speculation to maintain valuations and prospective returns in a narrower range. Again, looking across a century of market history, not a single market cycle has been completed without bringing valuations down to the point where prospective S&P 500 12-year total returns of at least 8% (and more typically 10% or higher) were restored. At present, that sort of run-of-the-mill cycle completion would draw the S&P 500 40-55% lower over the completion of the current market cycle. That’s our primary expectation, largely because I doubt that the global economy will escape a meaningful economic shock in the coming years. Still, there’s another possibility. If no material economic shock unfolds in the coming years, uninspiring economic growth and depressed interest rates could hold valuations at levels consistent with 12-year prospective returns in a narrower range of about 2-6% annually. That, in turn, would imply shallower, but probably more frequent retreats on the order of 15-30%, but without the kind of wipeout that would take valuations toward more durable historical norms. We should certainly allow for that possibility, which we would still expect to provide reasonably frequent opportunities to accept market exposure. In contrast, I think it’s very ill-advised to assume that the equity market will escape regular and material corrections altogether, or that it will enjoy any durable returns from current valuations. Current market conditions couple the third most extreme valuations in history (next to 2000 and 1929, in that order) with extraordinarily high levels of debt (much of it covenant-lite, providing bondholders little defense in the event of bankruptcy). My sense is that this will end quite badly, but we don’t need to rely on spectacular outcomes. We’ll take our evidence as it comes. Meanwhile, a final thought. The problem with speculative bubbles is that until the consequences arrive, idiocy can masquerade as genius, and vice versa. Those two have a remarkable way of reversing over the completion of a market cycle. Whatever you do with your own portfolio, think carefully about the assumptions you are relying on, and whether those assumptions can be backed by evidence. Too many investors seem mesmerized by the idea that central banks have near-magical powers, never fully defined, and never clearly articulated. The best advice I can offer is this: put your assumptions into words, and then take them to the data to make sure that what you believe is actually true. The foregoing comments represent the general investment analysis and economic views of the Advisor, and are provided solely for the purpose of information, instruction and discourse. Please see periodic remarks on the Fund Notes and Commentary page for discussion relating specifically to the Hussman Funds and the investment positions of the Funds. --- The foregoing comments represent the general investment analysis and economic views of the Advisor, and are provided solely for the purpose of information, instruction and discourse. Prospectuses for the Hussman Strategic Growth Fund, the Hussman Strategic Total Return Fund, the Hussman Strategic International Fund, and the Hussman Strategic Dividend Value Fund, as well as Fund reports and other information, are available by clicking "The Funds" menu button from any page of this website. |
|||||||||||||||||||||||||
|
For more information about investing in the Hussman Funds, please call us at
1-800-HUSSMAN (1-800-487-7626) 513-326-3551 outside the United States Site and site contents © copyright Hussman Funds. Brief quotations including attribution and a direct link to this site (www.hussmanfunds.com) are authorized. All other rights reserved and actively enforced. Extensive or unattributed reproduction of text or research findings are violations of copyright law. Site design by 1WebsiteDesigners. |