|
|
||||||
|
|

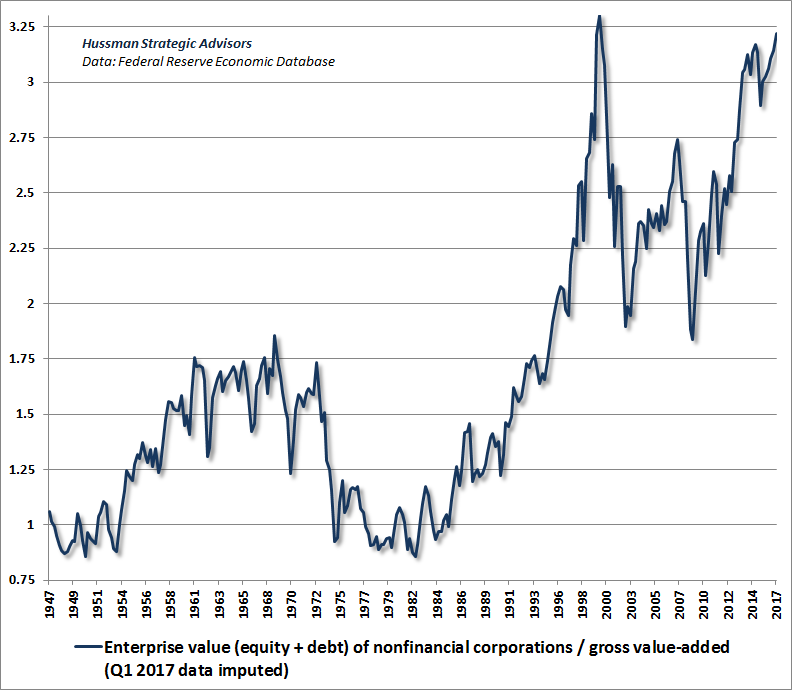
March 20, 2017 Expect the S&P 500 to Underperform Risk-Free T-Bills Over the Coming 10-12 Years Last week, Treasury bill yields rose to 0.75% following the Federal Reserve’s quarter-point hike in the target Federal Funds rate, placing the yield on even risk-free liquidity above our 0.6% estimate for 12-year prospective S&P 500 annual total returns. This isn’t the first time in history that prospective 12-year stock market returns have fallen below the prevailing T-bill yield, but it’s certainly the lowest return that has prevailed at any of those points. We should distinguish those points, in and of themselves, from market peaks. For example, in early-1969, prospective 12-year S&P 500 total returns (based on MarketCap/GVA - chart below) fell below the prevailing T-bill yield of 6.2%. That point wasn’t quite a market top, but it did usher in a long period of equity market underperformance relative to Treasury bills (as it happened, the S&P 500 Index itself would not durably trade above its early-1969 level until late-1982). On a total return basis, the S&P 500 total return averaged 6% over the following 12-year period, while the yield on risk-free Treasury bills averaged 6.8% over the same horizon. Similarly, by mid-1997, prospective 12-year S&P 500 annual total returns fell below the prevailing T-bill yield. Again, that wasn’t a market top, but over the next 12 years, the actual S&P 500 annual total return averaged just 1.6%, while Treasury bill returns averaged 3.3%. By 2000, prospective 12-year annual total returns fell to nearly zero. In real-time, using similar methods, I projected negative S&P 500 total returns over the 10-year period ahead. By 2010, the S&P 500 had indeed posted a negative total return over the intervening decade, and even by 2012, the S&P 500 remained lower than its 2000 peak, with a total return, including dividends, of just 1% annually. Though we know that the extreme valuations of the 2006-2007 period were followed by the deepest market collapse since the Great Depression, we don't yet know the 12-year outcome for total returns. Given that the market has now ascended to valuations that actually eclipse the 2007 bubble, and roughly match the 2000 extreme, market returns in recent years have exceeded those that we projected back then (as is common at valuation extremes - see A Better Lesson than "This Time is Different" for examples of this overshooting behavior, and how it is typically resolved). As we've seen in prior cycles, I have little doubt that the completion of the cycle will similarly resolve the overshooting of valuations in recent years. Presently, based on the most historically-reliable valuation measures we identify, we expect annual total returns for the S&P 500 averaging just 0.6% over the coming 12-year period; a prospective return that we expect will not only underperform bonds over this horizon, but even the lowly yields available on risk-free T-bills. Like the unwindings that followed the 2000 peak and the 2007 peak, there will be points in the interim where the prospective total return on stocks will likely be elevated (as a result of steep market losses and improved valuations), providing patient, flexible investors substantial opportunities for long-term total returns. Before knowing what to do about this situation, you have to know who you are. If you are an investor who cannot tolerate the idea of the market advancing without your participation, it may be best to bind yourself to a passive investment stance, and stick to it, provided that you can also tolerate whatever losses the market endures without abandoning your position. Many people can easily endure losses, provided those losses are experienced in the company of others, yet can’t bear to miss out, or endure losses, when the crowd is making money. If that describes you, then honestly, don’t read my stuff, because it’s not appropriate for your temperament. Frankly, I don’t believe that what passive investors are doing here actually represents “investment” in any valid sense of the word (i.e. purchasing a stream of future expected cash flows at a price that implies a satisfactory risk-adjusted return), but it does address the psychological desire to experience the same fluctuations that others do. Our own approach is decidedly full-cycle, which requires a tolerance for being out-of-step at extreme valuations. That typically makes us lonely at tops, but contrary to the “permabear” moniker, it has also typically made us lonely at bottoms. The fact is that I’ve encouraged a constructive or leveraged investment stance after every bear market decline in over 30 years as a professional investor, though my late-2008 constructive shift, after the market had lost more than 40% of its value, was truncated by my insistence on stress-testing our methods against Depression-era data (see the discussions in Portfolio Strategy and The Iron Laws and the “Box” in The Next Big Short for that narrative). Sometimes being out-of-step is a benefit, as it has typically been during market collapses, and sometimes it feels excruciating, as it did in 2000, 2007, and has for quite some time during the present bubble. I’ve regularly discussed the Achilles Heel that I inadvertently bared in the half-cycle since 2009 as a result of that stress-testing decision, and that we addressed in 2014. It’s incorrect to dismiss our present market concerns, in the face of extreme valuations and divergent market internals, as if they are simply a continuation of that challenging transition. Indeed, our current views are driven by the same considerations that drove our concerns at the 2000 and 2007 peaks. The validity of these concerns may not become obvious until we observe a material completion to the current market cycle. By then, I expect it will be too late for investors to realize that the same historically-informed, full-cycle discipline, and the same valuation concerns, have been repeatedly validated in previous market cycles, both in real time and in a century of historical data. Meanwhile, we should be clear about what patient discipline actually means. It doesn’t mean that the market has to lose value immediately. Rather, investors should remember that the 2000-2002 market collapse wiped out the entire total return of the S&P 500, in excess of risk-free Treasury bill returns, all the way back to May 1996. Likewise, the 2007-2009 market collapse wiped out the entire total return of the S&P 500, in excess of risk-free Treasury bill returns, all the way to June 1995. By the time that a market cycle is completed, a value-conscious, full-cycle investment discipline tends to be enormously forgiving of early exit, particularly when one exits at historically rich valuations. At present, the debt burdens of non-financial companies have never been higher relative to their gross value-added. Meanwhile, the market value of non-financial stocks is also near the 2000 extreme relative to their gross value-added. The sum of equity and debt is known as “enterprise value.” The chart below presents enterprise value as a fraction of corporate gross value-added (h/t @JesseFelder), which illustrates the extreme value of financial claims on corporations, relative to the revenues needed to serve them. Present levels are within a breath of the 2000 extreme.
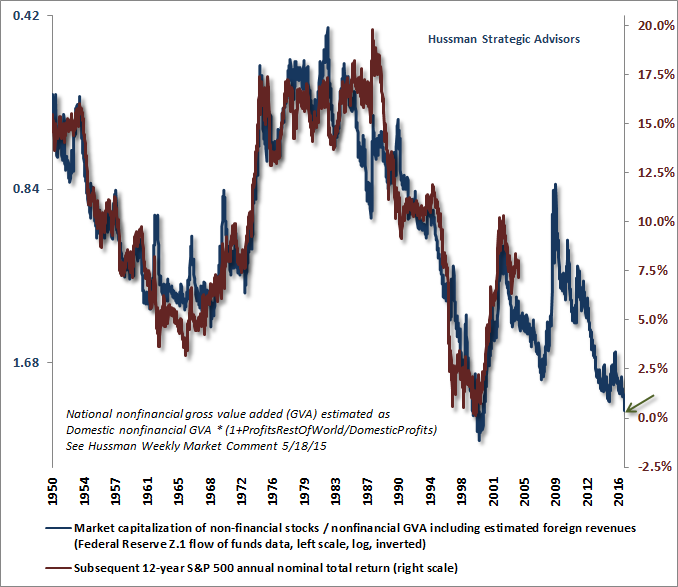
Keep your eyes open, and look forward Remember that the valuation measures we’re discussing here have a correlation of more than 90% with actual subsequent S&P 500 total returns (something that cannot be said for price/forward operating earnings, the Shiller CAPE, or the Fed Model). There are lots of analysts on Wall Street who refer to investments as “product” who will eagerly produce alternative measures to show that valuations are just fine. Be sure to get your hands on decades of historical data and test their relationship with actual subsequent full-cycle and 10-12 year market returns. I would love to have a reliable basis for advocating a significant exposure to market risk here, but having studied and tested hundreds (and perhaps thousands) of investment strategies across more than 30 years in the financial markets, all I can say is hold on tight. During the bubble of recent years, the Federal Reserve’s zero interest rate policy encouraged a relentless extension of yield-seeking speculation, even after the emergence of extreme “overvalued, overbought, overbullish” syndromes that had regularly been followed by market collapses in prior market cycles across history. Overly relying on those syndromes, with rates at the zero bound and market internals still intact prior to late-2014, was admittedly our Achilles Heel in this bubble. But keep your eyes open, and look forward. Don’t equate a market that has been driven astoundingly beyond the historical bounds of prudence with a market that is actually safe. As in 2000, 2007, and every other bubble peak across history, the “safety” investors feel as they look at the glorious ascent in the rear-view mirror is actually nothing but recklessness before consequences. The completion of this cycle is likely to be one heck of a ride. Our preferred valuation measure, nonfinancial market capitalization / corporate gross value-added (including estimated foreign revenues), is shown below on an inverted log scale (blue line, left scale) along with actual subsequent 12-year S&P 500 annual total returns (red line, right scale). Again, current valuations are associated with expected 12-year S&P 500 total returns averaging just 0.6% annually by our estimates.
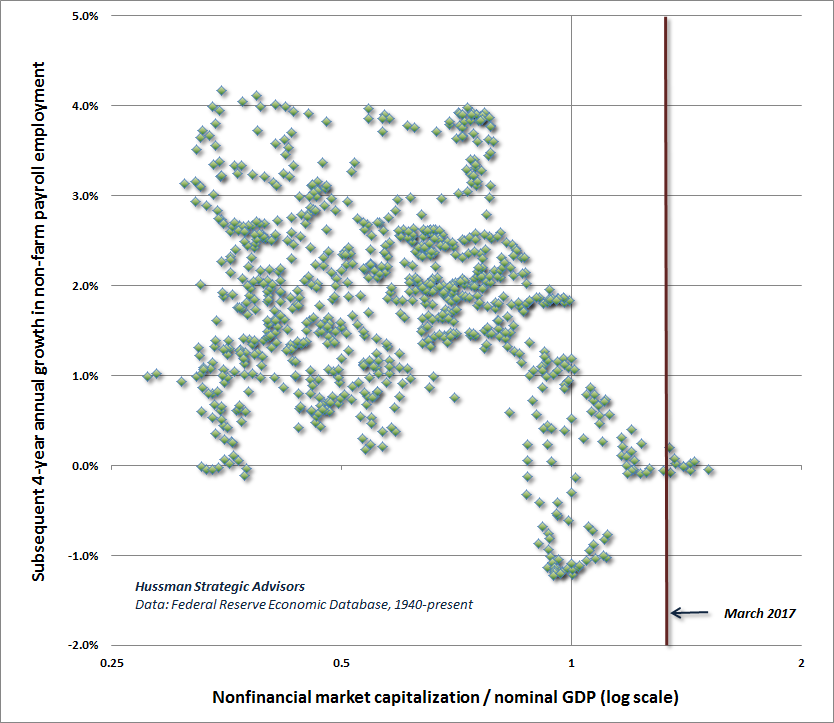
Observe that there’s not a single cycle in historical data (even prior to the 1960’s when bond yields were often quite low), that prospective 10-12 year equity returns did not move to the 8-10% range or higher over the completion of the market cycle. The same thing can be demonstrated back to the early 1900’s using related measures. Presently, the S&P 500 would have to decline by 40-60% to achieve that level of prospective returns over the completion of the current speculative cycle. It’s striking to recognize that even a 60% market decline would not bring the most historically reliable valuation measures materially below their historical norms. Indeed, secular valuation lows like 1949 and 1982 would currently require valuations to fall to about one-quarter of their present levels. At current valuation extremes, that’s a problem for long-term investors, because even if the next secular valuation low doesn’t occur until 30 years from today, and the nominal growth of corporate revenues accelerates from the 2-4% range of recent decades to a sustained 5% rate, the annual increase in the S&P 500 Index between today and 30 years from now would be (1.05)*(0.25)^(1/30)-1 = approximately zero. That's just arithmetic, and it's consistent with history. For example, the 1929 peak in the Dow Industrials wasn't durably exceeded until 1955, and current valuations already exceed that 1929 extreme. Of course, there were outstanding investment opportunities at much lower valuations in the interim. I have little doubt the completion of this market cycle will similarly resolve this problem, producing lower valuations and stronger prospects for long-term investors. As a final note, remember that extreme valuations don’t emerge in a vacuum. They typically emerge after extended economic expansions and ebullient investor sentiment. By the time valuations reach offensive extremes, economic slack has already been taken up, and the latitude for subsequent growth tends to be constrained. As I detailed in Economic Fancies and Basic Arithmetic, the central tendency of real U.S. economic growth is likely to be less than 2% annually in the coming years, because of demographic constraints in the labor market, combined with decades of weak gross domestic investment growth. These factors are largely baked in the cake here. Though a sustained increase in productivity amounting to even a fraction of a percent would produce significant benefits over a 20-year period, we expect that even successful economic policies would place real U.S. GDP growth only about 0.7% above our baseline expectation over the coming 4 years. Put another way, I doubt that average annual real GDP growth will exceed even 2.7% annually between now and 2020. The implication of market valuations for employment growth in the coming years is actually somewhat worse. The chart below plots the ratio of equity market capitalization / GDP versus the average annual growth in non-farm payroll employment over the following 4-year period (equity market cap from 1940-1947 is imputed). Again, extreme valuations tend to emerge after the economy has already enjoyed an extended period of expansion, and after a great deal of economic slack has already been taken up. The present instance is no exception.
The foregoing comments represent the general investment analysis and economic views of the Advisor, and are provided solely for the purpose of information, instruction and discourse. Please see periodic remarks on the Fund Notes and Commentary page for discussion relating specifically to the Hussman Funds and the investment positions of the Funds. --- The foregoing comments represent the general investment analysis and economic views of the Advisor, and are provided solely for the purpose of information, instruction and discourse. Prospectuses for the Hussman Strategic Growth Fund, the Hussman Strategic Total Return Fund, the Hussman Strategic International Fund, and the Hussman Strategic Dividend Value Fund, as well as Fund reports and other information, are available by clicking "The Funds" menu button from any page of this website. |
|||||||||||||||||||||||||
|
For more information about investing in the Hussman Funds, please call us at
1-800-HUSSMAN (1-800-487-7626) 513-326-3551 outside the United States Site and site contents © copyright Hussman Funds. Brief quotations including attribution and a direct link to this site (www.hussmanfunds.com) are authorized. All other rights reserved and actively enforced. Extensive or unattributed reproduction of text or research findings are violations of copyright law. Site design by 1WebsiteDesigners. |