|
|
||||||
|
|

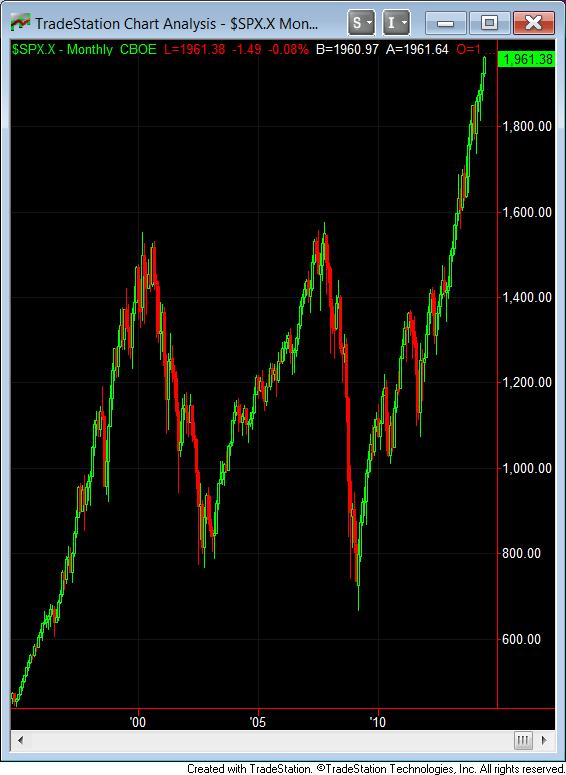
June 30, 2014 The Delusion of Perpetual Motion “I am definitely concerned. When was [the cyclically adjusted P/E ratio or CAPE] higher than it is now? I can tell you: 1929, 2000 and 2007. Very low interest rates help to explain the high CAPE. That doesn’t mean that the high CAPE isn’t a forecast of bad performance. When I look at interest rates in a forecasting regression with the CAPE, I don’t get much additional benefit from looking at interest rates... We don’t know what it’s going to do. There could be a massive crash, like we saw in 2000 and 2007, the last two times it looked like this. But I don’t know. I think, realistically, stocks should be in someone’s portfolio. Maybe lighten up... One thing though, I don’t know how many people look at plots of the market. If you just look at a plot of one of the major averages in the U.S., you’ll see what look like three peaks – 2000, 2007 and now – it just looks to me like a peak. I’m not saying it is. I would think that there are people thinking – way – it’s gone way up since 2009. It’s likely to turn down again, just like it did the last two times.” Professor Robert Shiller, June 25, 2014, The Daily Ticker The chart below shows the S&P 500 Index from 1995 to the present, and provides a visual illustration of what Professor Shiller is describing.
Particularly at points such as this, it's worth repeating that past performance does not ensure future results. The central thesis among investors at present is that they have no other choice but to hold stocks, given the alternative of zero short-term interest rates and long-term interest rates well below the level of recent decades (though yields were regularly at or below current levels prior to the 1960s, which didn’t stop equities from being regularly priced to achieve long-term returns well above 10% annually). In this environment, many analysts have argued that elevated stock market valuations are "justified" by the depressed level of interest rates. As I observed the last time around* (see Explaining isn’t Justifying): “If you examine the full historical record, you'll find that the relationship between S&P 500 earnings yields and 10-year Treasury yields (or other interest rates for that matter) isn't tight at all. The further you look back, the weaker the relationship. To a large extent, the relationship we do observe is linked to the single inflation-disinflation cycle that began in the mid-1960's, hit its peak about 1980, and then gradually reversed course over the next two decades. Still, it's clear that during the past few decades, however one wishes to explain it, earnings yields and interest rates have had a stronger relationship than they have exhibited historically (though not nearly as strong as the Fed Model implies). “So why isn't it correct to say that lower interest rates justify today's elevated P/E ratios? It's in the meaning of the word ‘justify’ where things get interesting. To most investors, a justified valuation is the level of prices that would still be likely to deliver a reasonable return. Unless that's true, being able to explain the price/earnings ratio is not enough to say that it's a justified valuation. While it's true that lower yields have been associated with higher P/E ratios in recent decades, the meaning of that for investors isn't positive or even neutral, it's decidedly negative. Stocks since 1970 have been heavily sensitive, and possibly overly sensitive, to interest rate swings. While lower interest rates have supported higher P/E ratios, those lower rates and higher P/E ratios, in turn, have been associated with poorer subsequent stock market performance. In short, if investors want to argue that low interest rates help to explain today's elevated P/E ratios, that's fine, as long as they also recognize that subsequent returns on stocks are likely to be dismal in the future as a result.” The corollary to the belief that zero interest rates "justify" elevated valuations is that investors seem to believe that as long as interest rates are held near zero, stocks will continue to advance at a positive or even average or above-average rate. It’s certainly true that from a psychological standpoint, the Federal Reserve has induced the same sort of yield-seeking speculation that drove investors into mortgage securities (in hopes of a “pickup” over depressed Treasury-bill yields), fueled the housing bubble, and resulted in the deepest economic and financial collapse since the Great Depression. This yield-seeking has clearly been a factor in encouraging investors to forget everything they ever learned from finance, history, or even two successive 50% market plunges in little more than a decade. But the finance of all of this – the relationship between prices, valuations and subsequent investment returns – hasn’t been altered at all. As the price investors pay for a given stream of future cash flows increases, the long-term rate of return that they will achieve on their investment declines. Zero short-term interest rates may “justify” the purchase of stocks at higher valuations so that stocks promise equally dismal future returns. But once stocks reach that point, investors should understand that those dismal future returns will still arrive. Let me say that again. The Federal Reserve’s promise to hold safe interest rates at zero for a very long period of time has not created a perpetual motion machine for stocks. No – it has simply created an environment where investors have felt forced to speculate, to the point where stocks - despite their dramatically greater risk - are now also priced to deliver zero total returns for a very long period of time. Put simply, we are already here. Based on valuation measures most reliably associated with actual subsequent market returns, we presently estimate negative total returns for the S&P 500 on every horizon of 7 years and less, with 10-year nominal total returns averaging just 1.9% annually. I should note that in real-time, the same valuation approach allowed us to identify the 2000 and 2007 extremes, provided latitude for us to shift to a constructive stance near the start of the intervening bull market in 2003, and indicated the shift to undervaluation in late-2008 and 2009 (see Setting the Record Straight). I should also note that despite challenges since 2009 related to my insistence on stress-testing against Depression-era data, our valuation methods haven’t missed a beat, and we’ve used the same general approach for decades now. Criticize my fiduciary stress-testing inclinations in response to the credit crisis (which we correctly anticipated). Decry the as-yet uncorrected persistence of extreme overvalued, overbought, overbullish syndromes in recent half-cycle, far longer than they have persisted historically. But don’t imagine that these objections will make the total returns of the S&P 500 any better than zero over the coming years. I’m convinced that we’ve addressed the challenges we confronted in the half-cycle since 2009. No doubt, a further diagonal and uncorrected advance would make us no more constructive than we are at present. Still, one might want to review how our approach served us over complete market cycles prior to this speculative episode. We certainly expect that the next 7-10 years will include a separate bull market, or even two. So there will undoubtedly be strong investment opportunities along the way, but not at these prices. My impression from history is that the completion of the present market cycle will begin with a panic, and end with yet another. If we examine data since 1940, the 10-year total return on the S&P 500 has a correlation of about 83% with the CAPE. Including the profit margin embedded in the CAPE as an additional explanatory variable brings this correlation to about 90% (to understand why, see Margins, Multiples, and the Iron Law of Valuation). As Shiller correctly observes, including Treasury bill and 10-year Treasury bond yields as additional variables adds no further explanatory power. Put another way, interest rates do have an impact on the level of valuations, but the resulting valuations are informative – at face value – about the probable level of future market returns. On a historical basis, the CAPE of over 26 is already quite enough to expect more than a decade of negative real total returns for the S&P 500. Aside from the crashes that followed the 1929, 2000 and 2007 peaks, a very long period of negative real returns also followed the other historical peak in the CAPE near 24 in the mid-1960’s. As noted above, one adjustment to the CAPE that significantly improves its relationship with actual subsequent market returns – as it does for numerous other measures – is to correct for the implied profit margin embedded into the multiple. This is true even though the denominator of the CAPE is based on 10-year averaging. At present, the margin embedded in the Shiller CAPE is more than 20% above the historical average. Adjusting for that embedded profit margin – which, again, produces a historically more reliable indication of actual subsequent S&P 500 total returns – the Shiller CAPE would presently be over 32. That level might make even Professor Shiller question whether stocks should be a material component of portfolios (at least for investors with horizons much shorter than the 50-year average duration of S&P 500 stocks). In any event, even the phrase “lighten up” is problematic for the market if more than a few investors heed that advice. The ratio of non-financial equity market capitalization to GDP (which has maintained a tight correlation with subsequent 10-year S&P 500 total returns even in recent times) is now about 134%, compared with a pre-bubble norm of 55%. The median price/revenue ratio S&P 500 components easily exceeds, and the average rivals, the levels observed at the 2000 peak. All of this suggests that investors may not appreciate the extent of present overvaluation, lulled once again by the assumption that cyclically-elevated earnings are permanent. Benjamin Graham warned long ago that this assumption is probably the chief source of losses to investors: “The purchasers view the good current earnings as equivalent to ‘earning power’ and assume that prosperity is equivalent to safety.” Meanwhile, Fed Governor James Bullard observed last week that even the Fed is not inclined to maintain zero interest rate policy indefinitely: “Investors should be listening to the Committee. Of course, you can do what you want.” Interest rates and equity valuations A few comments about how interest rates affect equity valuations may be useful. If one views a historically normal Treasury bill yield to be about 4%, it follows that if the Federal Reserve was to surprise the markets with one additional year of zero interest rates, beyond current expectations, that surprise would actually be worth a one-time boost to stock prices of only about 4%. Likewise, if the Fed was to shorten the horizon by one year, it would be worth only a 4% loss. The Bernanke Fed certainly tried to leverage this modest but legitimate effect of interest rate expectations through “forward guidance” that promised zero interest rates for years, and longer than appeared credible except in an economy without growth. That’s the finance of it, and one can demonstrate it algebraically using any discounted cash flow approach. If one expects short-term interest rates to be held at zero (instead of say, 4%) for another 5 years, it would be sensible for equity valuations to be about 20% above their long-term norms. Assuming a gradual movement toward normal valuations at the end of that 5-year period, the differential would shave about 4% annually from what would otherwise be normal equity returns over that period. At present, however, one would have to expect another 25 years of zero short-term interest rates in order to justify current valuations (and even that assumes that nominal GDP growth proceeds at about 6% annually in the interim). Stock prices have advanced far more than legitimate interest rate effects can explain, so this is certainly not how investors are thinking about the problem. Instead, they are pricing stocks as if zero-interest rate policy creates some sort of perpetual motion for stocks in and of itself. Given the extremes to which valuations have been driven, investors have now priced stocks to deprive them – for a very long period of time – of any expected return at all. Stock valuations now reflect not only the absence of any interest-competitive component of expected returns, but the absence of any expected compensation for the greater risk of stocks, which is not insignificant – as investors might remember from 2000-2002 and 2007-2009 plunges, despite aggressive easing by the Federal Reserve throughout both episodes. We expect the compensation for taking equity risk to be negative over the coming 7-year horizon. Market crashes are always and everywhere a reflection of an abrupt upward shift in the risk premiums demanded by investors, and that piece of investor psychology is less under Fed control than investors seem to believe. We expect many years of poor market returns, but we don’t know the precise path the market will take to arrive at nowhere. We aren’t forecasting or relying on a crash, but we certainly have no basis to rule out that possibility – particularly if we observe any upward pressure at all in risk-premiums on corporate and junk debt, or any material breakdown in market internals from here. Investment decisions driven primarily by the question “What other choice do I have?” are likely to prove regrettable. What we now have is a market that has been driven to one of the four most extreme points of overvaluation in history. We know how three of them ended. *Though the S&P 500 would achieve a 33% total return from 2005 to its 2007 peak, the index then lost all of that gain, and then another 40% of its value from there, by the 2009 low. That’s how compounding works – a 25% loss wipes out a 33% gain, but a 55% loss compounds that initial 25% loss with a further 40% loss. In the half-cycle since 2009, valuations have recovered and swollen to place the present instance among a handful of extreme valuation “outliers” in history. Again, because of the effect of compounding, a 40% loss requires a 67% gain to recover, and a 55% loss requires a 122% gain to recover. Reliable valuation measures such as market capitalization to GDP and the S&P 500 price/revenue ratio - that are unaffected by cyclical swings in profit margins - are now far above their 2007 peaks. The Shiller CAPE of 26 embeds elevated profit margins but averages them over a decade. At normal margins, the CAPE would be above 32. The temporary benefit of this overvaluation is that the resulting the total return of the S&P 500 has been raised to about 7.7% annually since 2005. Unfortunately, we expect that most or all of that gain will be wiped out over completion of the present market cycle. Meanwhile, we remain quite optimistic about investment opportunities that are likely to emerge even in the course of a run-of-the-mill completion to this cycle. The foregoing comments represent the general investment analysis and economic views of the Advisor, and are provided solely for the purpose of information, instruction and discourse. Only comments in the Fund Notes section relate specifically to the Hussman Funds and the investment positions of the Funds. Fund Notes The Hussman Funds continue to take a defensive stance toward equities and Treasury debt, and a constructive stance toward precious metals shares. --- The foregoing comments represent the general investment analysis and economic views of the Advisor, and are provided solely for the purpose of information, instruction and discourse. Prospectuses for the Hussman Strategic Growth Fund, the Hussman Strategic Total Return Fund, the Hussman Strategic International Fund, and the Hussman Strategic Dividend Value Fund, as well as Fund reports and other information, are available by clicking "The Funds" menu button from any page of this website. |
|||||||||||||||||||||||||
|
For more information about investing in the Hussman Funds, please call us at
1-800-HUSSMAN (1-800-487-7626) 513-326-3551 outside the United States Site and site contents © copyright Hussman Funds. Brief quotations including attribution and a direct link to this site (www.hussmanfunds.com) are authorized. All other rights reserved and actively enforced. Extensive or unattributed reproduction of text or research findings are violations of copyright law. Site design by 1WebsiteDesigners. |