|
|
||||||
|
|

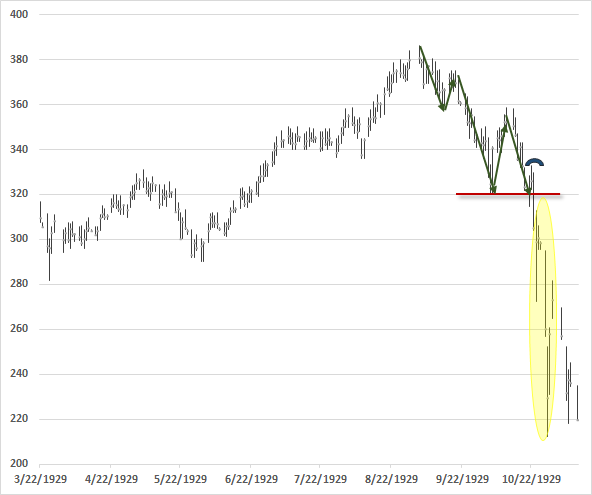
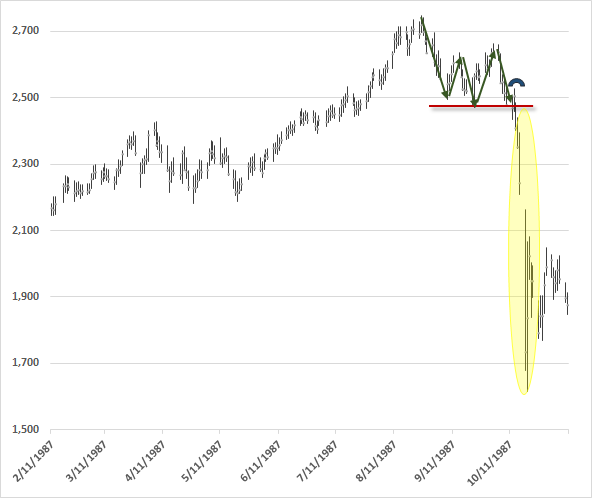
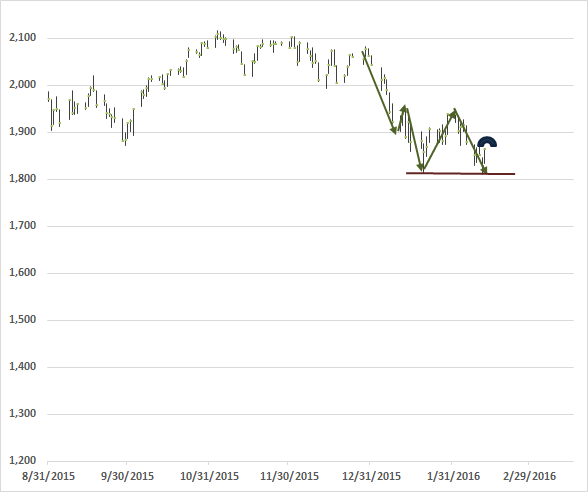
February 15, 2016 Warning with a Capital "W" We continue to classify the prospective equity market return/risk profile within the most negative climate we identify. The basis of this classification is fairly straightforward. Historically, once an extended speculative period of extreme overvalued, overbought, overbullish conditions gives way to increasing risk-aversion, as indicated by deterioration in market internals (and particularly in the presence of hostile yield trends in the form of widening credit spreads), the stock market has become vulnerable to vertical losses. Though not every instance of this syndrome has been followed by a market collapse, every notable panic and market crash across more than a century of data has featured that basic setup. Valuations remain extreme on the basis of measures most tightly correlated with subsequent 10-12 year S&P 500 total returns in market cycles across history (see Rarefied Air: Valuations and Subsequent Market Returns). When investors are inclined toward speculation, as evidenced by indiscriminately uniform market action across risk-assets, even obscene overvaluation can be followed by further risk-seeking (see The Hinge). At present, however, market internals have deteriorated substantially, including spiking credit spreads in the debt markets. Beyond those factors, we also observe evidence of an oncoming global economic downturn, including a U.S. recession (see A Growing Risk of Recession, and An Imminent Likelihood of Recession). In the absence of a clear resumption of risk-seeking across the global economy, further monetary easing is likely to be ineffective in reversing current strains. As investors should recall from the 2000-2002 and 2007-2009 plunges, both which were attended by continuous and aggressive monetary easing, monetary easing in itself is not typically enough to provoke resumed risk-seeking (see When An Easy Fed Doesn’t Help Stocks, and When it Does, and The Gas Pedal is Useless When the Spark Plugs Are Gone). Warning with a capital “W” Given our focus on historically-informed, value-conscious, full-cycle investing, I generally don’t place much attention on short-term technical factors or specific patterns of price action. However, the current setup is one of the few exceptions. In a market return/risk classification that is already the most negative we identify, where a sustained period of speculation has given way increasing risk-aversion, the position of the market relative to very widely identified “support” (about the 1820 level on the S&P 500) is of particular note. Often, well-recognized support levels become places where dip-buyers and swing-traders line up on the buy side, on the assumption that they’ll be rewarded if the market bounces from that support, and that they can quickly cut their losses immediately if the support level is broken. The problem here is that when too many speculators set their stop-loss points at the same level, and valuations are still elevated, there may be neither speculators nor value-conscious investors willing to bid for stock anywhere near those support levels once they break. The resulting gap between eager sellers at a high level and willing buyers at a much lower level is the essential element of market crashes, because every seller requires a buyer. I’ve often observed that market crashes have historically emerged only after a familiar profile of market behavior that features a compressed market retreat of about 14% over 10-12 weeks, a rebound between 1/3 and 2/3 of that decline, a fresh retreat that slightly breaks that initial level of support, a one-day barn-burner advance, and then a collapse as the prior support level is broken. In the 1990’s, I called this pattern the lead-up to “five days of Armageddon” because historically, once rich valuations have been joined with poor market internals (what I used to call “trend uniformity”), the break of a widely-identified support level has often been followed by vertical market losses. The present widely-followed “support” shelf for the S&P 500 is roughly 14% below the 2015 market peak, but most domestic and international indices have already broken corresponding support levels. Given the obscene valuations at the 2015 peak, my impression is that a run-of-the-mill completion of the current market cycle (neither an unusual nor worst-case scenario from a historical perspective) would comprise an additional market decline of roughly 40-50% from present levels. I certainly don’t expect that kind of market loss in one fell swoop. Rather, my immediate concern is that the first leg of this decline could be quite steep. Emphatically, my concern is not simply that the market has retreated by some amount to a widely-identified support level. The issue is the context of rich valuations and poor market internals in which that market weakness has emerged, because when a widely- identified support level gives way at rich valuations, in an environment where poor market internals convey a shift toward risk-aversion among investors, the break can behave as a common trigger for concerted attempts to exit. Though the 1929 and 1987 crashes are the most salient instances, there are numerous less memorable examples across history. As I observed in my June 6, 2002 comment: “I have chosen to call this particular climate a Warning with a capital ‘W’ because every historical market crash of note is found within this one set of conditions. Those conditions are: extremely unfavorable valuations and poor trend uniformity. At present, the market is displaying the same set of characteristics as it did just prior to past market crashes. In both 1929 and 1987, the market crash began about 55 trading sessions after the peak. During those sessions, the market traced out a characteristic pattern of declining peaks and troughs, with a one-day rally just after the third trough (roughly 14% down from the peak), and then ‘five days of Armageddon.’ This is exactly the pattern that the S&P has traced since its late-March peak.” The market followed with a 24% plunge over the following 6 weeks (and an even greater loss on an intra-day basis). It took more than 5 days, but then, the S&P 500 was already down substantially from its 2000 extreme even before that plunge. Prior to the mid-1990’s, the most common “reference” index of investors was the Dow Jones Industrial Average. Presently, the most broadly followed index is the S&P 500 Index. The following charts show the general pattern I’ve described, along with the 1929 and 1987 instances.
Now, perhaps the rally since Friday is instead a “successful retest” of prior support. Given that leading economic data, coupled with poor market internals, continue to indicate an imminent U.S. recession, I tend to doubt that possibility, but we’ll take the evidence as it arrives. Despite elevated valuations and deteriorating economic conditions in the U.S. and elsewhere, our immediate downside concerns would ease considerably in the event market internals were to clearly improve on our measures. Here and now, investors should ensure that their market exposures and investment horizons would allow them to tolerate a potential 40-50% market loss over the completion of this market cycle without abandoning their discipline. Meanwhile, remember that investors, in aggregate, cannot exit the stock market, or any other market for that matter. Every security that is issued, including base money created by the Federal Reserve, must be held by some investor, at every point in time, in precisely the form it was issued, until that security is retired. The only question is how eager buyers are, relative to sellers. Prices don’t advance because money goes “into” stocks. Every dollar that a stock buyer brings into the market goes right back out in the hands of a seller. No, prices advance because buyers are more eager than sellers. Prices decline because sellers are more eager than buyers. My concern is that support for an increasingly risk-averse market now rests on the fragile resolve of dip-buying speculators primed to cut-and-run at exactly the same nearby support level, beyond which stands a rather shallow pool of powder-dry, value-conscious potential buyers who remain unwilling to commit that powder anywhere near current levels, in a risk-averse market where further central bank intervention is likely to be futile. Me and Jack Frost It’s often said that smart people learn from their own mistakes, but the wise learn from the mistakes of others. Eleanor Roosevelt added “you can’t live long enough to make them all yourself.” I’ve openly detailed the challenges that we encountered during the half-cycle advance in recent years, which began with my insistence in 2009, after a financial crisis that we fully anticipated, on stress-testing our methods of classifying market return/risk profiles against Depression-era data. Following a difficult and admittedly awkward transition (where I relied too heavily on historical regularities related to "overvalued, overbought, overbullish syndromes" that were disarmed by QE in the risk-seeking bulk of this half-cycle), we introduced adaptations in mid-2014 that require explicit deterioration in market internals as a requirement before taking a hard-negative market outlook. The complete narrative and the central lessons are freely available to the wise among both our adherents and our critics (see A Better Lesson Than “This Time Is Different” and the Box in The Next Big Short: The Third Crest of a Rolling Tsunami). That said, anyone familiar with my work prior to 2009 should also recognize that my concerns today are identical to those I voiced at the 2000 and 2007 peaks. They might also recall that I shifted to a constructive outlook in 2003, as I’ve taken after every bear market in three decades as a professional investor (though the late-2008 shift was truncated by that 2009 stress-testing decision). Those who aren’t aware of those shifts; who aren’t aware of our experience over complete market cycles prior to 2009; who aren’t aware that I advocated a leveraged stance for years after the 1990 bear market; who confuse my unfortunate stumble over Ben Bernanke’s deranged time-bomb as a permanently bearish strategy – those investors unfortunately don’t know me or my work very well. Worse, those who don’t recognize how easily the 3.2% nominal annual total return of the S&P 500 since 2000 is likely to be completely wiped away over the completion of the current market cycle; who believe that the investment merit of stocks is wholly independent of valuations or the risk-preferences of investors; and who don’t recognize how quickly the standing of risk-managed strategies can shift relative to long-only strategies over the cold winter that completes a market cycle (see in particular Chumps, Champs and Bamboo) – those investors may not know Jack Frost, but will be introduced soon enough. I have no doubt that market conditions will encourage a constructive and most likely even aggressive market outlook as the current market cycle is completed. But the market return/risk profile we associate with present conditions is diametrically opposed to those that have historically rewarded exposure to the equity market. Importantly, the central factor – what I’ve frequently called the “hinge” – that deferred the consequences of obscene valuation in recent years was not monetary easing per se, but monetary easing in an environment where investors were inclined toward risk-seeking, as indicated by the uniformity of market internals across a wide range of individual stocks, industries, sectors, and security types, including debt securities of varying creditworthiness. The carry-trade mentality of “reaching for yield” implicitly rests on the assumption that capital losses will not wipe out the extra yield that one is seeking. That mentality is often rewarded in an environment where investors share similar views. In a risk-seeking environment, zero (or negative) yielding money is a hot-potato to be avoided, so creating more of the stuff adds to the yield-seeking frenzy. But once investors shift toward risk-aversion, the allure of a slightly higher yield is easily offset by concern about potentially severe capital losses. In that environment, zero or negative yielding money may not be a satisfying investment, but the discomfort is not enough to prompt speculation. As I’ve noted before, the worst event for the stock market has historically been a Fed rate cut that occurs in an environment of investor risk-aversion, because those shifts are almost invariably responses to abrupt economic deterioration. Our investment outlook will shift as new evidence emerges. Among those considerations, the joint behavior of valuations and market action remains most important. In particular, an early improvement in our measures of market action, following a material retreat in valuations, is the most likely combination that would encourage a shift to a constructive or aggressive market outlook. Again, I have no doubt that we’ll observe such opportunities over the completion of the current market cycle.The foregoing comments represent the general investment analysis and economic views of the Advisor, and are provided solely for the purpose of information, instruction and discourse. Please see periodic remarks on the Fund Notes and Commentary page for discussion relating specifically to the Hussman Funds and the investment positions of the Funds. --- The foregoing comments represent the general investment analysis and economic views of the Advisor, and are provided solely for the purpose of information, instruction and discourse. Prospectuses for the Hussman Strategic Growth Fund, the Hussman Strategic Total Return Fund, the Hussman Strategic International Fund, and the Hussman Strategic Dividend Value Fund, as well as Fund reports and other information, are available by clicking "The Funds" menu button from any page of this website. |
|||||||||||||||||||||||||
|
For more information about investing in the Hussman Funds, please call us at
1-800-HUSSMAN (1-800-487-7626) 513-326-3551 outside the United States Site and site contents © copyright Hussman Funds. Brief quotations including attribution and a direct link to this site (www.hussmanfunds.com) are authorized. All other rights reserved and actively enforced. Extensive or unattributed reproduction of text or research findings are violations of copyright law. Site design by 1WebsiteDesigners. |