|
|
||||||
|
|

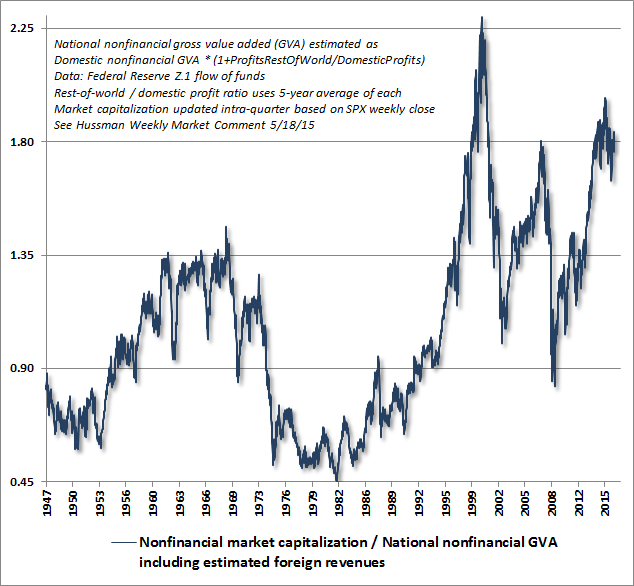
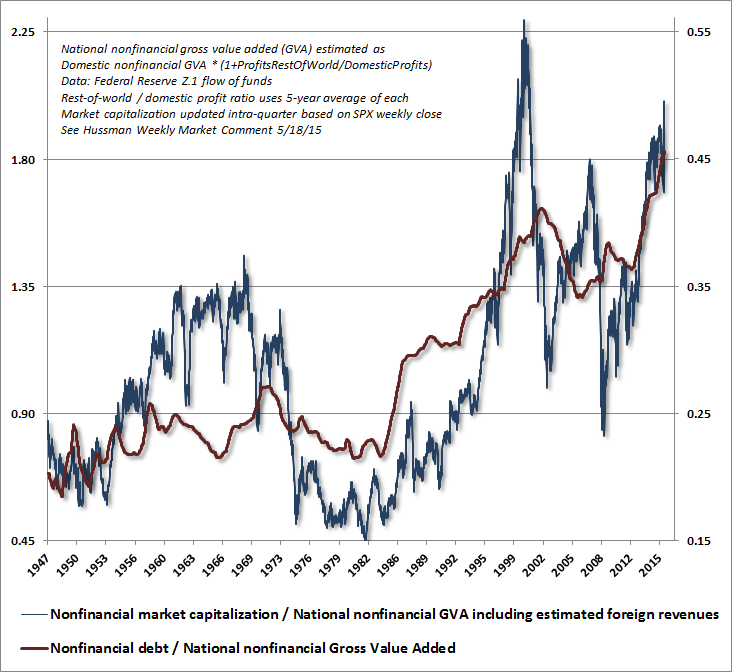
June 20, 2016 Imagine Imagine the collapse of an extended speculative tech bubble, resulting in a broad economic recession. Imagine if the Federal Reserve had persistently slashed short-term interest rates during the downturn, to no avail, leaving rates at just 1% by the time the S&P 500 had lost half of its value and the Nasdaq 100 collapsed by 83%. Imagine that the Fed kept rates suppressed, in the initially well-meaning hope of encouraging lending, growth and employment. Imagine that the depressed level of interest rates made investors feel starved for yield, and drove them to look for safe alternatives to Treasury bills. Imagine that investors found the higher yields they sought in mortgage securities, which had historically always been safe, and that Fed policy inadvertently created voracious demand for more of that debt. Imagine Wall Street had weak enough requirements on capital and underwriting standards that financial institutions had an incentive to create more “product” by lending to borrowers with lower and lower creditworthiness. Imagine that by the magic of “financial engineering” and lax oversight of credit ratings, Wall Street could pass these mortgages off to investors either directly by bundling, slicing and dicing them into mortgage-backed securities or by piggy-backing on the good faith and credit of the government by transferring them to Fannie Mae and Freddie Mac in return for funds obtained from investors in these “agency” securities. Imagine that this Fed-induced yield-seeking speculation changed the dynamics of the housing market, and produced a bubble in home prices, coupled with overbuilding and malinvestment. Imagine that the Federal Reserve, focused exclusively on exploiting the very weak links between monetary policy and its “mandates” of employment and price stability, ignored the phrase “long-run” in those mandates, and wholly disregarded the speculative effects of its actions, which any thoughtful central banker should have viewed as a significant risk to the long-run economic health of the nation. Imagine that the then-head of the San Francisco Federal Reserve, Janet Yellen, answered questions about 1) whether speculative risks existed, 2) whether the Fed had any role in addressing them, and 3) whether there was any doubt that the Fed could halt a resulting economic downturn if it occurred, responding with a dismissive “No, No, and No.” Imagine that this second speculative bubble collapsed anyway, producing the worst economic downturn since the Great Depression, and that persistent easing by the Fed failed to stop any of it, just as it failed to do so during the preceding collapse. Imagine that the Fed violated the existing provisions of section 13.3 of the Federal Reserve Act (later rewritten by Congress to spell it out like a children’s book) and created off-balance sheet shell companies called “Maiden Lane” to take bad assets off of the ledgers of certain financial institutions, in order to protect the bondholders of those companies and facilitate their acquisition by purchasers. Imagine that the crisis continued, and that what actually ended the crisis was a change in FASB accounting rules in the second week of March 2009, which relieved the need for financial institutions to mark their distressed assets to market value, and instead allowed them “significant judgment” in valuing those assets, instantly removing the specter of widespread financial insolvencies with the stroke of a pen. Imagine that legislation following the crisis was heavy on paper regulation, signed assurances, and living-wills, but was light on capital requirements, and contained provisions that essentially tied the hands of the FDIC and instead gave veto power to the Treasury and the best friend of the banking system, the Federal Reserve Board itself, in deciding whether a “too-big-to-fail” bank would actually go into receivership (where bondholders often lose money, but depositors are protected) if it was to become insolvent. Imagine that in response to the collapse of a yield-seeking mortgage bubble, a resulting global financial crisis, and a 55% collapse in the S&P 500, the Federal Reserve insisted on pursuing more of what created the bubble in the first place; refusing to admit the weak cause-and-effect relationship between monetary easing and the real economy, pushing interest rates to zero, and expanding the monetary base to the point where $4 trillion of zero-interest hot potatoes constantly had to be held by someone in the financial markets. Imagine that despite pursuing this experimentation for years, the response of the real economy was no different than could have been predicted using prior values of non-monetary variables alone. Imagine that the main effect of this unprecedented intervention was to drive the most reliable measures of stock market valuation (those best correlated across history with actual subsequent 10-12 year market returns) well beyond double their historical norms, and that it prompted massive issuance of low-grade, “covenant lite” debt, in much the same way yield-seeking speculation encouraged the issuance of low-grade mortgage debt in the preceding bubble. Imagine that the Fed not only refused to take serious account of the distorting impact of yield-seeking speculation on the financial markets, but actually welcomed it, citing it as an example of the “effectiveness” of quantitative easing, in the appallingly misguided belief that “wealth” is inherent in the price you pay for a security, rather than in the long-term stream of cash flows that the security will deliver over time. Imagine that investors adopted the same overconfidence in a Fed “put option” that they held before the 2000-2002 and 2007-2009 market collapses. Imagine the Fed failed to take any steps at all to reduce the size of its balance sheet at historically low interest rates, and painted itself into a corner because despite the weak relationship between short-term interest rates and the real economy, any normalization of policy threatened to burst a bubble that was already at a precipice. Imagine that as a result of a massive combined deficit in the government and household sectors after the housing collapse, corporate profit margins temporarily soared to the highest level in history (an implication of the saving-investment identity under assumptions that typically hold in U.S. data). Imagine that because of this temporary elevation of profit margins, many of the borrowers that issued debt most heavily during this yield-seeking bubble were companies with elevated short-term profitability, but more fragile prospects over the full economic cycle. Imagine that energy and mining companies were among these, but were only the tip of the iceberg, exposed sooner than the rest because of early weakness in commodity prices. Imagine if central banks took the position that when the relationship between their policy instruments and the real economy proves to be weak, the only option is to push those instruments beyond even the most extremist, historically unprecedented, and wholly experimental limits. Imagine that after years of persistent yield-seeking speculation, valuations were driven so high that the prospective 12-year return on a conventional 60% stocks, 30% bonds, 10% Treasury bills investment portfolio was compressed to just 1.6%. Imagine that corporate, state, and municipal pension funds were still assuming a 7% annual return on their investments, and that as a result of this mismatch, pension funds were becoming both massively underfunded, and vulnerable to severe capital losses over the completion of the market cycle. Imagine that despite the delusion that low interest rates made stocks “cheap relative to bonds,” years of speculation had already created a situation where stocks were actually likely to underperform even the depressed yield on 10-year Treasury securities in the decade ahead, making the majority of corporate stock repurchases (which are typically financed by debt issuance), negative contributors to shareholder value. Imagine that the latest stick-save by central banks, in response to initial weakness following the 2015 peak of the bubble in global equity markets, had brought the median price/revenue ratio of the S&P 500 to the highest level in history, far exceeding even the 2000 peak (which was more focused on large-capitalization stocks, particularly in technology). Imagine that all of this could be demonstrated with a century of reliable evidence, but that hardly anyone, particularly in the investment profession, gave it any more attention than the empty lip-service they offered during the tech and housing bubbles. Imagine that central bankers were focused instead on toy models that had weak theoretical and empirical foundations, inadequate transmission mechanisms, and an inability to explain more than a tiny fraction of economic variation over-and-above what could be explained in the absence of their deranged monetary activism. Imagine that they ignored real data in preference for the comfort and bizarre allegiance to a “Phillips Curve” that does not exist (Phillips’ work actually demonstrated a relationship between unemployment and wage inflation - and real wage inflation at that, given that he studied a century of British data when the U.K. was under the gold standard). Imagine that a divided Congress, incapable of agreeing on fiscal policies to encourage productive investment in the public and private sectors, instead allowed a handful of unelected bankers and college professors to become the untethered de-facto overlords of the financial markets, repeatedly promoting destructive speculative bubbles. Imagine that nobody cared to recognize the role of financial speculation and malinvestment as the primary source of repeated economic dislocations and crises, because they were, nearly to a person, too lazy, uninformed, or dogmatic to actually get their hands dirty by questioning their assumptions or carefully examining the historical data. Imagine that years of speculative recklessness had driven the S&P 500 to the second most extreme level of equity market overvaluation in postwar U.S. history (the third highest if one includes the 1929 peak), and to the single most extreme point of overvaluation for the median stock. Imagine that market internals and momentum had already deteriorated, and that the market had traced out an extended top-formation, as it had in late-2000 and again in late-2007. Now imagine what might happen next. A side-note. Though I was one of the few market participants who correctly anticipated the tech and housing collapses (also adopting a constructive or aggressive investment outlook following every bear market decline in three decades as a professional investor, and navigating complete market cycles admirably over that span), I regularly acknowledge that my 2009 insistence on stress-testing our discipline against Depression-era data, coupled with a Fed policy focused on intentionally encouraging financial speculation, inadvertently created an Achilles Heel for us in the advancing portion of this market cycle. We addressed those challenges in mid-2014. See the “Box” in The Next Big Short for the complete narrative. This episode of central bank recklessness will likely end in tears, and while I can certainly be blamed for the challenges that followed my 2009 stress-testing decision, it strikes me as ill-advised to dismiss a century of reliable objective evidence on the basis of subjective challenges that were highly unique to elements of our own discipline (specifically, the impact of QE on the outcomes of “overvalued, overbought, overbullish” syndromes, in the absence of weakness in market internals). A few charts Some of the following charts have appeared in prior market commentaries, but are presented again below to provide a graphic overview of the current situation. The first presents the ratio of nonfinancial market capitalization to national nonfinancial corporate gross value-added. One can think of this essentially as an economy wide price/revenue ratio for equities, including estimated revenues from foreign operations. I introduced this measure in May 2015, largely as an alternative to the next most reliable measure, which is market capitalization/nominal GDP. The objection to using GDP is that it includes non-corporate income, and as a “domestic” measure, it also includes the output of foreign companies operating in the U.S. while excluding the foreign income of U.S. companies operating abroad. As a practical matter, using national corporate gross value-added (including estimated foreign revenues) instead of gross domestic product has only moderate effect on implied market valuations, for empirical reasons I detailed in The New Era is an Old Story. As I've often observed, the reason why price/earnings ratios are relatively poor measures of market valuation is that stocks are not a claim on next year’s earnings. They are a claim to a very long stream of future cash flows that will be delivered into the hands of investors over time. Any valuation ratio is just shorthand for a properly detailed discounted cash flow analysis. While earnings are certainly important in generating those future cash flows, they are very poor “sufficient statistics” for the whole long-term stream, because profit margins vary considerably over the economic cycle. Historically, the best sufficient statistics are those that mute variation in profit margins, which is why the cyclically-adjusted P/E (CAPE), Tobin’s Q, revenue, GDP, and corporate gross value-added are progressively more accurate measures. See Choose Your Weapon for more on this point. That said, MarketCap/GVA, shown below, has a stronger correlation across history with actual subsequent S&P 500 total returns than any of a score of alternative measures we’ve examined, including the Fed Model, price/earnings, price/forward operating earnings, the Shiller CAPE, Siegel’s NIPA CAPE, Tobin’s Q, price/dividend, and numerous other metrics.
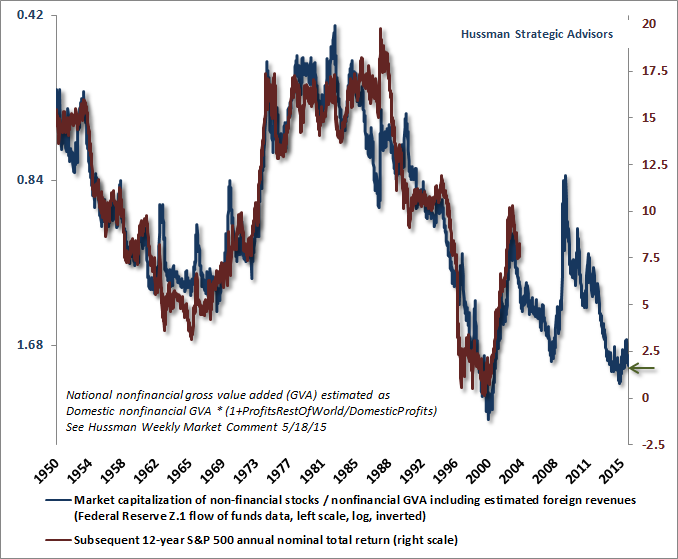
The following chart presents the same data, but on an inverted log scale (left), along with the actual S&P 500 nominal average annual total returns over the following 12-year period. A 12-year horizon is used here because that is the point where the autocorrelation profile (the correlation of current valuations with later valuations) falls to zero, and is therefore the horizon over which valuations most reliably mean-revert. The correlation between this valuation measure and actual subsequent 12-year S&P 500 total returns is approximately 93%.
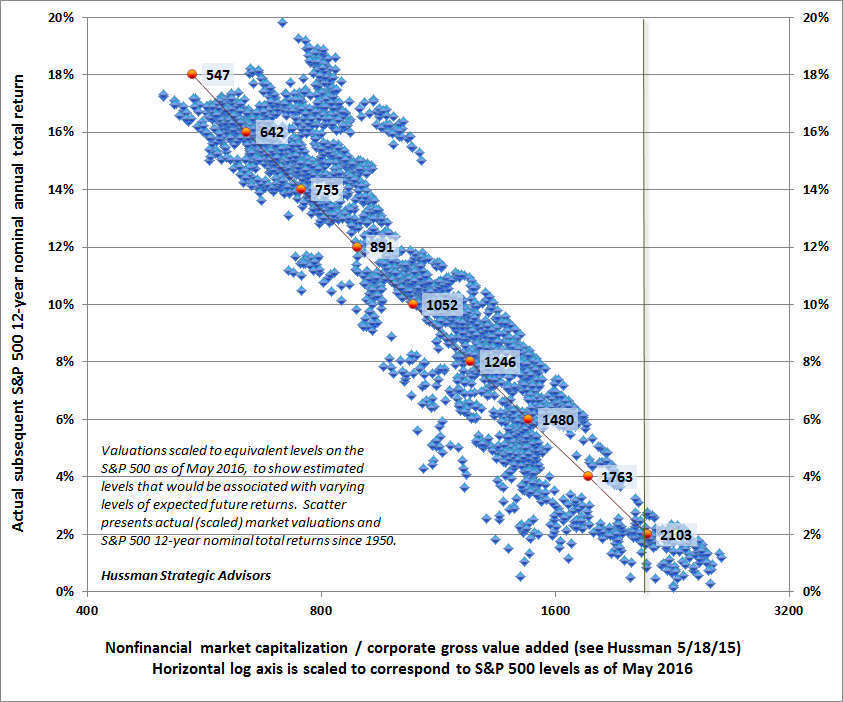
The next chart shows the data in a somewhat unusual way. The horizontal axis of the chart below shows the ratio of market capitalization to corporate gross value added, but is scaled to the current level of the S&P 500 (as of May 2016). As a result, the chart shows the levels of the S&P 500 Index that would currently be associated with various expected 12-year expected returns. For example, we currently estimate that a decline to the 1480 level on the S&P 500 would be required in order to restore expected 12-year nominal total returns to a level of 6% annually. Notably, not a single market cycle across history has completed without prospective 10-12 year returns reverting to the 8-10% range. This includes cycles prior to 1960 when interest rates regularly visited levels similar to the present.
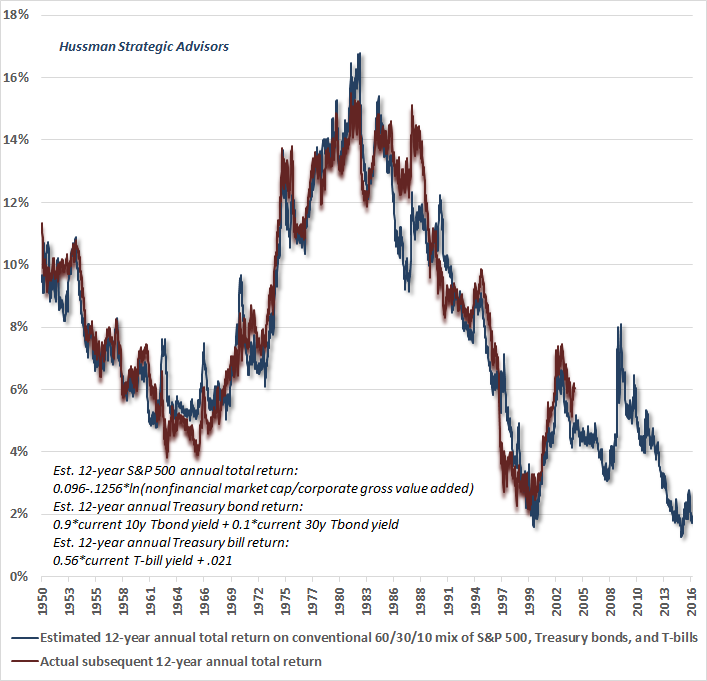
The following chart expands the perspective to include returns from fixed income securities, and shows just how far yield-seeking speculation has gone in the financial markets. At present, investors can expect a conventional portfolio mix of 60% S&P 500, 30% Treasury bonds, and 10% Treasury bills to return only about 1.6% annually over the coming 12-year period. This situation is likely to provoke a broadening pension crisis in the years ahead, due to the combination of underfunding and capital losses over the completion of the market cycle.
Notice that the recent speculative episode has been accompanied by massive issuance of new corporate debt. While this increase in corporate indebtedness appears more acceptable relative to corporate earnings, profit margins have been dramatically elevated in recent years as a result of large deficits in the household and government sectors (in equilibrium, the deficits of one sector emerge as the surplus of another). This imbalance has begun to narrow considerably in recent quarters, which we observe as a contraction in corporate earnings. Relative to gross value added, the most historically reliable “sufficient statistic” for the future stream of corporate cash flows, current debt levels are disturbingly elevated. This is an example of a speculative outcome that appears manageable and benign in the short-run but is likely to have brutal longer-term consequences in the form of corporate defaults, even in the absence of a significant increase in Treasury yields.
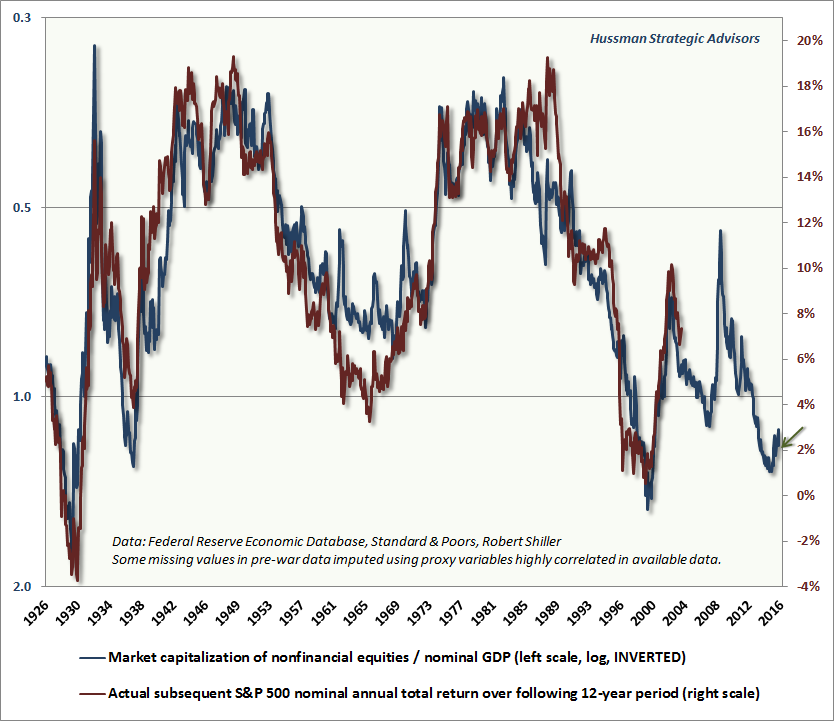
The following chart presents the ratio of market capitalization to nominal GDP, which provides a longer-term perspective due both to a longer data set, and to a more reliable ability to impute pre-war data points using highly correlated proxies. The chart below shows this valuation measure since 1926, on an inverted log scale (left), compared with actual subsequent 12-year stock market returns.
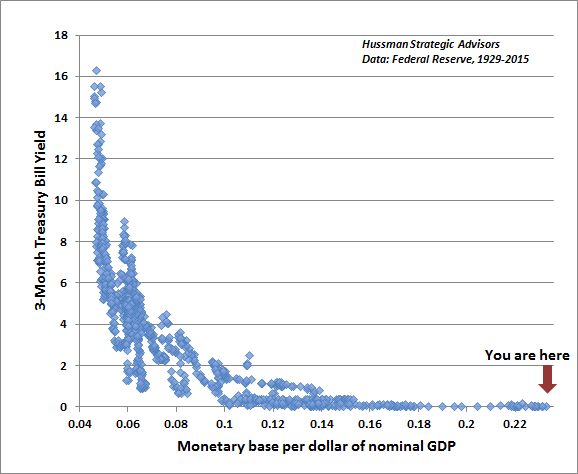
The next chart shows how the Fed influences short-term interest rates, in data since 1929. This is our version of what economists will recognize as the “liquidity preference curve.” There is a highly systematic relationship between the quantity of hot potatoes outstanding (monetary base as a fraction of nominal GDP) and the level of Treasury bill yields across history. The more zero-interest money the Fed forces into the system, the more investors are inclined chase yields on competing assets toward zero as well. This yield-seeking doesn’t end with Treasury bills. As long as investors aren’t too concerned about the risk of capital losses - that is, as long as investors are in a risk-seeking mood, a mountain of zero-interest hot potatoes will also embolden investors to chase yield further out on the risk spectrum, for example, in junk debt, stocks and mortgage securities.
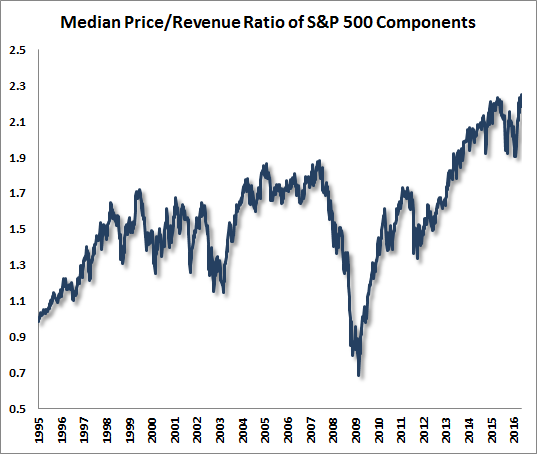
Finally, the chart below shows the median price/revenue ratio of S&P 500 component stocks, which recently pushed to the highest level in history, exceeding both the 2000 and 2007 market peaks. In recent quarters, the broad market has deteriorated, even in the most reasonably valued decile of stocks, but the most richly valued decile has held up for a last hurrah, as it did near the peaks of previous bubbles. This dispersion has created a headwind for hedged-equity strategies in U.S. stocks, particularly value-conscious strategies, but investors should understand that beneath the surface of this short-term outcome is singularly the most extreme point of overvaluation for the median stock in history.
The foregoing comments represent the general investment analysis and economic views of the Advisor, and are provided solely for the purpose of information, instruction and discourse. Please see periodic remarks on the Fund Notes and Commentary page for discussion relating specifically to the Hussman Funds and the investment positions of the Funds. --- The foregoing comments represent the general investment analysis and economic views of the Advisor, and are provided solely for the purpose of information, instruction and discourse. Prospectuses for the Hussman Strategic Growth Fund, the Hussman Strategic Total Return Fund, the Hussman Strategic International Fund, and the Hussman Strategic Dividend Value Fund, as well as Fund reports and other information, are available by clicking "The Funds" menu button from any page of this website. |
|||||||||||||||||||||||||
|
For more information about investing in the Hussman Funds, please call us at
1-800-HUSSMAN (1-800-487-7626) 513-326-3551 outside the United States Site and site contents © copyright Hussman Funds. Brief quotations including attribution and a direct link to this site (www.hussmanfunds.com) are authorized. All other rights reserved and actively enforced. Extensive or unattributed reproduction of text or research findings are violations of copyright law. Site design by 1WebsiteDesigners. |