|
|
||||||
|
|

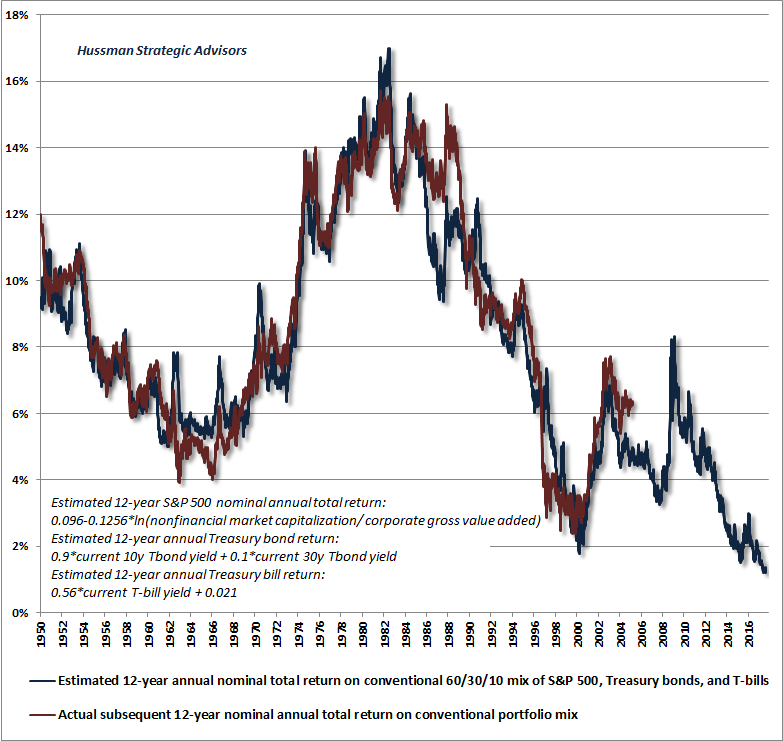
July 17, 2017 Wrecking Ball As of last week, the valuation measures that we find most strongly correlated with actual subsequent 10-12 year S&P 500 total returns in market cycles across history now range between 140-170% above their pre-bubble norms. While valuations at those pre-bubble norms are closely associated with prospective S&P 500 total returns in the range of 10% annually, valuations at current levels are associated with expected returns of about -2.5% annually on a 10-year horizon, and roughly zero on a 12-year horizon. Nearly every market cycle in history has brought these valuation measures back toward their historical norms, and no cycle (even those associated with quite low interest rates) has failed to bring them within about 25% of those norms. Assuming that valuations do not breach historical norms (as they did even in the most recent market cycle), the associated downside expectation for the S&P 500 over the completion of the current market cycle now runs between -48% and -63%. While it’s reasonable to believe that low interest rates justify higher than normal valuations, and lower-than-normal expected returns for stocks, we doubt that investors are comfortable with zero or negative returns being their definition of “justified.” What’s really happening is what always happens late in a speculative cycle, which is that the extrapolation of the recent half-cycle advance encourages investors to believe that the stock market simply “pays” high returns as if they were interest payments. It generally does not enter the speculator’s mind how strongly the ratio of market capitalization to GDP is correlated with actual subsequent market returns (though we prefer to use corporate gross value added including estimated foreign revenues, which creates a proper apples-to-apples measure). Sustained capital gains in the broad stock market, materially in excess of nominal economic growth, are typically borrowed from the future and repaid over the completion of the market cycle. What the “low interest rates justify high valuations” mantra has really done is to ensure that all asset classes are now priced at levels that are likely to generate dismal returns in the coming years. The chart below shows our best estimate of 12-year prospective nominal total returns on a conventional portfolio mix invested 60% in the S&P 500 Index, 30% in Treasury bonds, and 10% in Treasury bills. The red line shows actual subsequent 12-year returns on this mix. The current estimate is only about 1% annually, with the Treasury bond and T-bill components responsible for virtually all of that return, as the expected return on the S&P 500 component is close to zero.
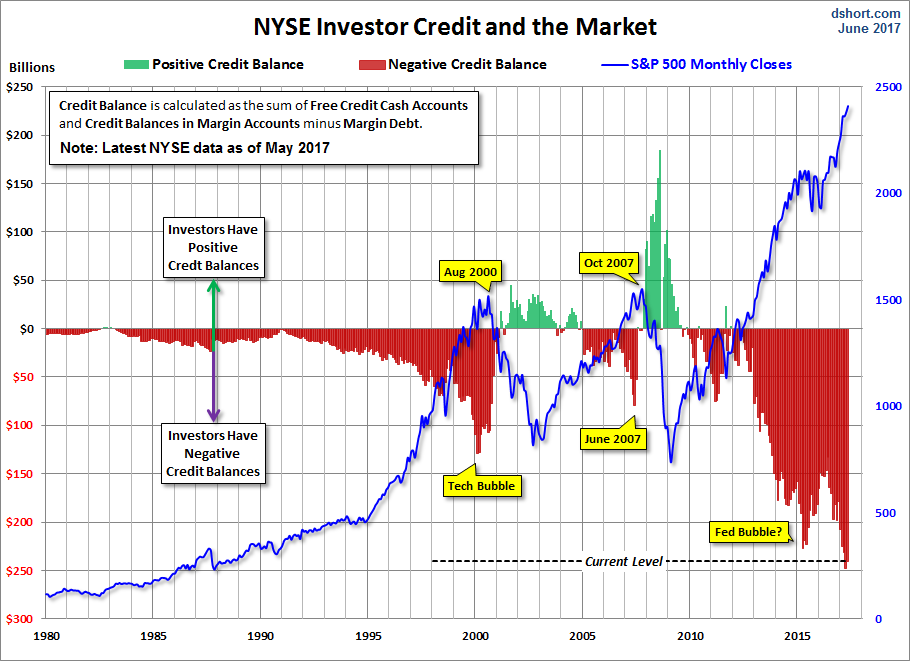
It’s useful to keep in mind that while continued low nominal economic growth may support a continued period of interest rates well-below their historical norms, the return projections above would be largely unaffected in that event. That is, low nominal growth and low interest rates would offset each other almost entirely. This isn’t a random outcome but an implication of both asset pricing arithmetic and historical data. See Rarified Air: Valuations and Subsequent Market Returns for the data and arithmetic on this. What’s often missed in the “low interest rates justify higher valuations” argument is that this proposition assumes that future cash flows and growth rates are held constant. If instead low interest rates emerge as a consequence of low expected nominal growth, valuation multiples should not be affected at all, yet prospective returns will still be lower anyway (you can demonstrate this to yourself by reducing both r and g equally in a basic dividend discount model). To elevate valuation multiples in this situation is to drive prospective returns down twice; a mistaken form of double-counting. Worse, recall that since earnings-based measures are heavily affected by cyclical variations in profit margins, earnings rarely represent useful “sufficient statistics” for the very long-term stream of cash flows that investors are actually buying (see Exhaustion Gaps and the Fear of Missing Out for a comparison of the relative reliability of various market valuation measures). Responding to low interest rates by elevating P/E multiples, without accounting for depressed long-term nominal economic growth prospects, and to base those P/E multiples on earnings that embed elevated profit margins (driven by a shortfall between wage growth and productivity that has already begun to reverse as the unemployment rate pushes 4.4%) is to drive prospective returns down three times; a mistaken form of triple-counting that is precisely why expected 10-12 year market returns are presently so weak The pendulum of speculation has swung far and has grown increasingly grotesque in order to reach this point. It will be a wrecking ball when it returns to earth. It came in like a wrecking ball! Speaking of margin debt, Doug Short recently provided this look at investor credit balances and the equity market. The bars (green when positive, red when negative) show the sum of: cash balances in investor cash accounts, plus cash balances in margin accounts, minus the margin debt of investors. To say that investors are “all in” would be an understatement here. They’re leveraged to the gills.
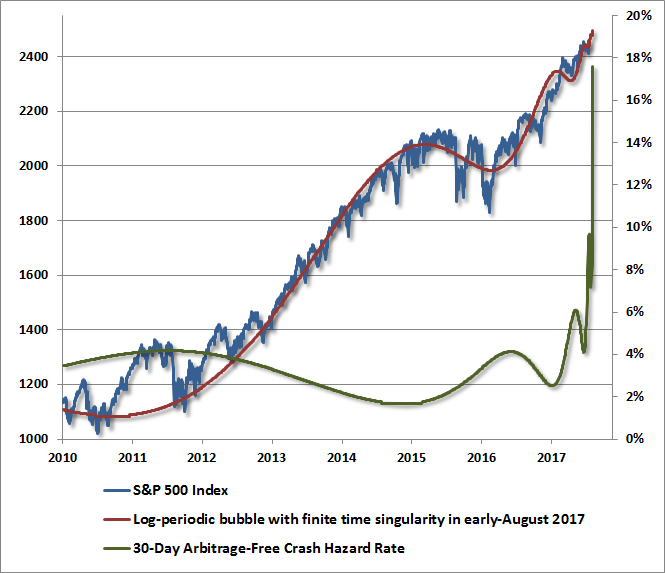
Opportunities will come as the pendulum shifts. There are points in every market cycle, characterized by a material retreat in valuations, coupled with an early improvement in measures of market action (see 2003 and late-2008/2009) where the prospective market return/risk profile becomes very strong for two reasons: first because lower valuations imply higher long-term expected returns, and second because in the absence of extreme valuations, early uniformity across a broad range of market internals acts as a signal that investors are again inclined to embrace market risk (when investors are inclined to speculate, they tend to be indiscriminate about it). I have no doubt we’ll observe that combination over the completion of the current market cycle. At present, we continue to observe the combination of wickedly extreme valuations, divergent market internals, and the most extreme overvalued, overbought, overbullish syndromes we define. Bubble update Our own investment discipline maintains a strong focus on the complete market cycle, and the importance of aligning our outlook with the prospective market return/risk classification that we identify at each point in time, based primarily on valuations, market internals, and measures of overextension such as “overvalued, overbought, overbullish” syndromes. The lesson of the recent cycle is not that these measures can be ignored over the completion of this cycle or future ones. Rather, the key lesson is that in the presence of deranged zero-interest rate policies, the uniformity of market internals has to be prioritized ahead of even the most extreme “overvalued, overbought, overbullish” syndromes. In previous market cycles across history, the emergence of sufficiently extreme overvalued, overbought, overbullish syndromes was alone sufficient to classify an unfavorable market outlook, because a deterioration in market internals (signaling a shift to increasing risk-aversion among investors) was generally either already in place, or quickly followed. In the recent advancing half-cycle, the Federal Reserve’s zero interest rate policy encouraged persistent yield-seeking speculation well after these extreme syndromes emerged. One had to wait for the uniformity of market internals to deteriorate explicitly before adopting a hard-negative outlook. The modifications we’ve imposed to prioritize the uniformity or divergence of market internals, particularly during zero-interest rate conditions, could alone have made the entire half-cycle since 2009 dramatically different for us, without impacting the essential constructive and defensive shifts we’ve made in actual market cycles over the past three decades. These modifications would not alter the outlook we’ve maintained this year, however, because market internals already demonstrate unfavorable divergences on our measures. Given the present combination of obscene valuations, extreme overvalued, overbought, overbullish syndromes, and persistent dispersion in market internals, our current outlook remains quite negative. An improvement in market internals would encourage a more neutral near-term outlook even here. Emphasizing that our own investment approach is driven primarily by the combination of valuations and market action (comprising internals as well as overextended conditions and other factors), the comments below are intended to be informational, rather than representing a forecast or prediction. I’ve periodically framed market action from the perspective of Didier Sornette’s model of log-periodic power-law bubbles (see my recent comments in Fair Value and Bubbles: 2017 Edition). Our current best-fit to this structure is presented below. Based on recent market dynamics, I’ve refined the date of the “finite-time singularity” in this model. That “critical point” is not necessarily the date of a peak or the beginning of a crash, but what Sornette describes as “an inflection point from self-reinforcing speculation to fragile instability.” It’s also worth remembering that the “catalysts” associated with sharp market losses have often been fully recognized only after the fact, if at all. As Sornette observes, “The collapse is fundamentally due to the unstable position; the instantaneous cause of the crash is secondary.” There’s a Wall Street aphorism that one can talk about time, and one can talk about price, but never about both. For that reason, feel free to take the following chart with a grain of salt. From our perspective, we would be inclined to take far more salt if our own measures of valuations, market internals, and overextended conditions were not so hostile as well. As conditions stand, the overall analysis contributes to our general view that the speculative pendulum is dangerously overextended. In any event, the estimate that best fits recent market dynamics would place the critical point in the first week of August, within less than 2% of current levels. Indeed, the 30-day crash probability that we estimate from this particular model is rising vertically, and will continue to do so with every market advance from this point. In practice, based on a much broader set of historically reliable evidence, we already view the market as highly vulnerable to steep, abrupt losses.
There will be no avoiding the completion of this market cycle for investors in aggregate. Every share of stock that is issued has to be held by someone, at every moment in time, until that share is retired. So it is useless to encourage investors to “get out” of stocks here. There is no such thing. The real question is who will hold the bag, so to speak. Those would best be investors who are committed to a passive investment strategy, who understand the relationship between valuations and likely risk and return over the completion of the cycle and the long-term, perhaps those who are comfortable enough with their own evidence to dismiss ours, and in any event, those who could tolerate the outcomes that we anticipate without abandoning their discipline, in the event they actually unfold as they have in prior market cycles. For my own readers, I’ve offered a great deal of historical evidence, a record of effectiveness in prior complete market cycles, and detail about our challenges in the recent speculative half-cycle, as well as how we’ve addressed them. My hope is our value-conscious, historically-informed, full-cycle discipline, along with the adaptations we’ve made, will encourage peace rather than fear, knowing that we’ll respond to the pendulum as it swings, in a way that considers risk and seeks opportunity in what may come next.The foregoing comments represent the general investment analysis and economic views of the Advisor, and are provided solely for the purpose of information, instruction and discourse. Please see periodic remarks on the Fund Notes and Commentary page for discussion relating specifically to the Hussman Funds and the investment positions of the Funds. --- The foregoing comments represent the general investment analysis and economic views of the Advisor, and are provided solely for the purpose of information, instruction and discourse. Prospectuses for the Hussman Strategic Growth Fund, the Hussman Strategic Total Return Fund, the Hussman Strategic International Fund, and the Hussman Strategic Dividend Value Fund, as well as Fund reports and other information, are available by clicking "The Funds" menu button from any page of this website. |
|||||||||||||||||||||||||
|
For more information about investing in the Hussman Funds, please call us at
1-800-HUSSMAN (1-800-487-7626) 513-326-3551 outside the United States Site and site contents © copyright Hussman Funds. Brief quotations including attribution and a direct link to this site (www.hussmanfunds.com) are authorized. All other rights reserved and actively enforced. Extensive or unattributed reproduction of text or research findings are violations of copyright law. Site design by 1WebsiteDesigners. |