|
|
||||||
|
|

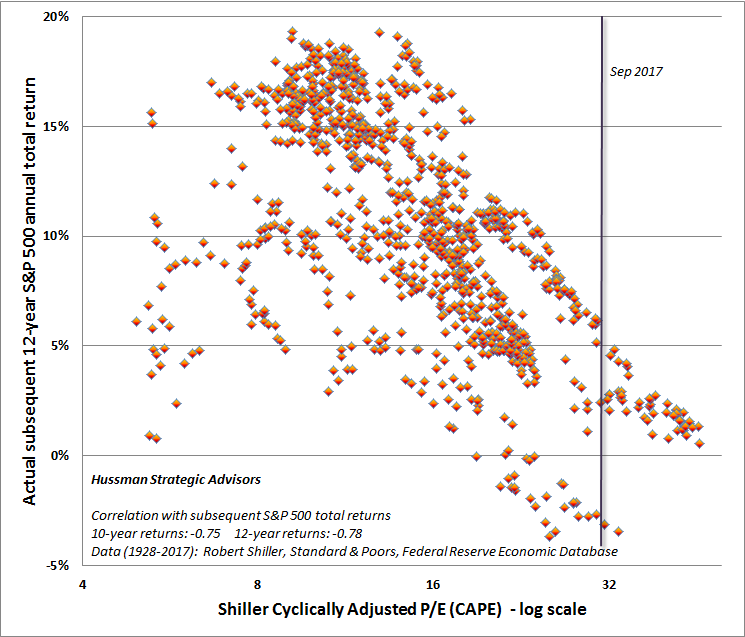
September 4, 2017 Valuations, Sufficient Statistics, and Breathtaking Risks The financial markets create opportunities for both investment and speculation. It helps to have a sense of whether one, both, or neither of these opportunities are present. Our own discipline makes a distinction between “investment merit” and “speculative merit,” reflecting observable market conditions at any point in time. On the “investment” front, valuations are the primary determinant of market outcomes on a 10-12 year horizon, and of potential downside risk over the completion of any given market cycle. Over shorter segments of the cycle, however, market outcomes are much more dependent on psychological factors. The difference between an overvalued market that becomes more overvalued, and an overvalued market that crashes, has little to do with the level of valuation and everything to do with investor preferences toward risk-seeking or risk-aversion. Those preferences can be largely inferred from the uniformity or divergence of observable market internals across a wide range of securities and asset classes (when investors are inclined to speculate, they tend to be indiscriminate about it). For us, those distinctions proved to be extraordinarily valuable over every complete cycle prior to the half-cycle since 2009. But it’s worth briefly discussing our difficulty in the half-cycle since 2009 too, because understanding it may help investors to avoid the mistake of ignoring the breathtaking level of market risk they face here and now (detailed below). Those familiar with this discussion are still encouraged to read the next two paragraphs, because understanding this narrative matters so much here. For more detail, see A Better Lesson than "This Time is Different". The problem in the period since 2009 was two-fold: First, the yield-seeking speculation encouraged by the Federal Reserve during the mortgage bubble led us to correctly anticipate the 2007-2009 collapse, but not the policy errors that ultimately brought the U.S. economy to the brink of another Depression. Policy makers ultimately papered over the problem by changing accounting rule FAS 157 in March 2009, and have since filled the hole in the banking system by depriving savers of interest, while encouraging even greater expansion of leveraged loans and low-grade covenant-lite debt. In hindsight, I made the error of insisting that our methods be robust to Depression-era data (though those efforts may prove valuable in future crises). In the interim, solving that “two data sets” problem led us to miss a recovery that neither our pre-2009 methods nor our current methods would have missed. Second, the intentional encouragement of speculation by the Federal Reserve disrupted the historical tendency for extreme “overvalued, overbought, overbullish” syndromes to be closely followed by air-pockets, panics or crashes. Our reliance on those syndromes was our Achilles Heel. In the face of zero interest rates, one had to wait for market internals to deteriorate explicitly before adopting a hard negative outlook. We imposed that adaptation in 2014, which could have dramatically changed our experience in this period. Keep in mind that from the standpoint of compound returns, less than one-fifth of the S&P 500 total return in the half cycle since 2009 has been accrued since mid-2014. [Geek’s Note: Given a cumulative gain of Y%, the proportion of the gain accounted for by X% is equal to ln(1+X)/ln(1+Y). So, for example, a 50% advance actually contributes half of a 125% cumulative gain, which should be clear from the fact that 1.5 x 1.5 = 2.25.] Valuations, sufficient statistics, and the breathtaking risks ahead As I’ve often observed, the value of any security is based on the long-term stream of cash flows that it can be expected to deliver over decades and decades. While corporate earnings are certainly required to generate future cash flows, current earnings (or even forward earnings) are very poor “sufficient statistics” for that stream of cash flows. That’s true not only because of fluctuations in profit margins over the economic cycle, but also because of very long-term competitive forces that exert themselves over multiple economic cycles. From the standpoint of historical reliability, valuation measures that dampen or mute the impact of fluctuating profit margins clearly outperform measures based on current earnings. Indeed, even the Shiller cyclically-adjusted price/earnings ratio (CAPE), which uses a 10-year average of inflation-adjusted earnings, provides substantially better results when one also adjusts for the embedded profit margin (the denominator of the CAPE / S&P 500 revenues). For a table comparing the reliability of a variety of alternative valuation measures, see Exhaustion Gaps and the Fear of Missing Out. Robert Shiller and John Campbell introduced the CAPE in a July 1988 Journal of Finance article, observing the importance of muting the impact of cyclical fluctuations in earnings on the S&P 500 price/earnings ratio. That article came out independent of, and about the same time, as my own argument to the same effect in June 1988, which Alan Abelson featured in Barron’s. My own approach at the time was to base the multiple on prior peak-earnings, a strategy that has its own benefits and drawbacks. Presently, our preferred valuation measure, and the one we find most tightly correlated with actual subsequent S&P 500 total returns, is the ratio of nonfinancial market capitalization to corporate gross value-added, including estimated foreign revenues (which I call MarketCap/GVA, and introduced in 2015). On the question of whether the CAPE can fall even in the absence of a decline in the S&P 500, the answer is yes, precisely because of the dropout of crisis earnings from the 10-year average. The more important question is whether that “matters” for stocks. That’s a lot like asking whether a dieter should celebrate having lost weight because the scale happens to be faulty. The answer is no. If we care about truth we have to look carefully into the measures we use, and it’s here where things get interesting. In 2014, I introduced what I call the “margin-adjusted CAPE,” observing that adjusting the CAPE based on the embedded profit margin substantially improves its correlation with actual subsequent market returns. For this purpose, I defined the “embedded profit margin” as the earnings denominator of the CAPE, divided by S&P 500 revenues. One drawback is that S&P 500 revenue figures are not freely available and are difficult to impute historically. Fortunately, the ratio of corporate after-tax profits to GDP has historically provided an effective proxy for profit margins. To offer a longer-term view for the margin-adjusted CAPE, I’ve normalized the CAPE by that ratio, for which data is available since the 1920’s (h/t Michael Ritger for this suggestion). Specifically, the CAPE is multiplied at each point in time by a factor equal to the 10-year smoothing of corporate after-tax profits to GDP, divided by the historical norm of 5.4%. This has the effect of raising the multiple when the denominator reflects unusually elevated margins and would otherwise make stocks appear misleadingly cheap, and lowering the multiple when the denominator reflects unusually depressed margins and would otherwise make stocks appear misleadingly expensive. Because exponential smoothing and margin adjustment are used, the measure below is not vulnerable to the “10-year dropoff” of old data that Mark Hulbert describes. Not surprisingly, the resulting metric has a clearly stronger correlation with actual subsequent 10-12 year S&P 500 total returns. For the raw CAPE itself, those correlations are -0.75 and -0.78 in data since 1928. For the margin-adjusted CAPE, the correlations are -0.86 and -0.89 (in available postwar data, using S&P 500 revenues to compute the embedded margin, the correlation is even stronger). Asked whether a CAPE based on 30-year averaging is better correlated with market returns than a CAPE based on 10-year averaging, we don’t find that to be the case, but the difference is not large. The main thing to remember is that a valuation multiple is nothing but shorthand for a proper analysis of long-term discounted cash flows. Whatever the fundamental one uses in a valuation ratio, one should have reasonable confidence that it behaves as a “sufficient statistic” for the very, very long-term cash flows that investors can expect to be delivered into their hands over time. In practice, I prefer MarketCap/GVA, but if one wishes to use the CAPE, one should also adjust it for the embedded margin. The charts below provide evidence on that front. The first chart shows the relationship between the raw, unadjusted CAPE and actual subsequent S&P 500 total returns. While the current level, at just over 30, is quite high, and has historically been associated with negative or low single-digit market returns over the subsequent 12-year period, it’s not the highest level on record. That fact has given more than a few investors a false sense of comfort recently.
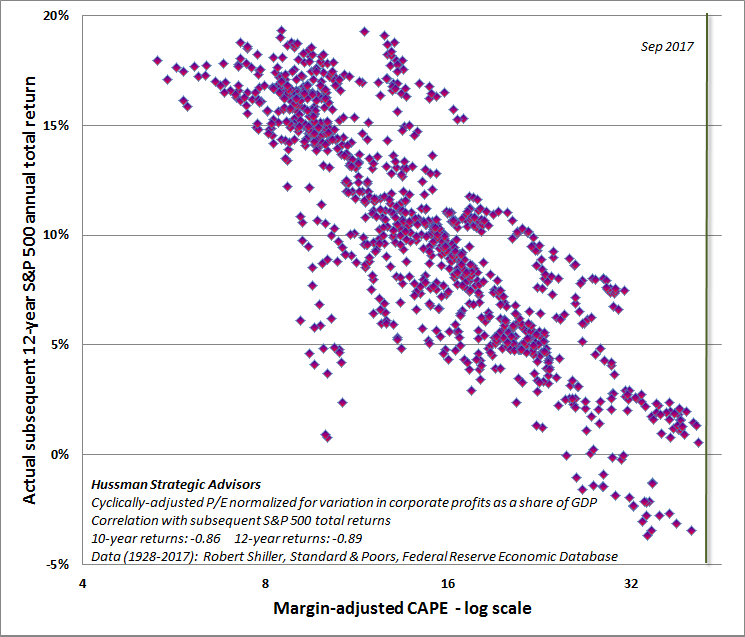
The chart below shows the margin-adjusted CAPE. Note first the tighter scatter of points, reflecting the stronger correlation with actual subsequent market outcomes. Notably, the current point is the highest on record, which is not so surprising given that the S&P 500 price/revenue multiple is at the highest level on record outside of the single week of March 24, 2000 that marked the peak of the technology bubble, and that the median price/revenue ratio of S&P 500 component stocks is also easily at the highest level in history.
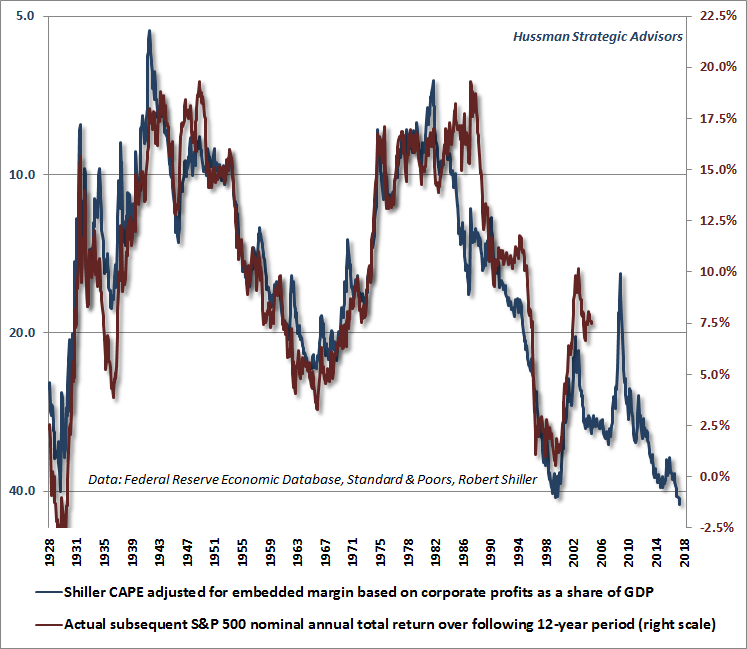
The next chart shows the margin-adjusted CAPE on an inverted log scale (blue), along with actual subsequent S&P 500 average annual nominal total returns (red). See Rarefied Air: Valuations and Subsequent Market Returns to understand why we use log scale here. Note that on the basis of this measure, expected 12-year S&P 500 total returns associated with current valuation levels are negative, and even if one was to shift the blue line up somewhat closer to the red line in recent years, the associated return expectation would still be close to zero (which is what I actually expect based on MarketCap/GVA and other historically reliable measures).
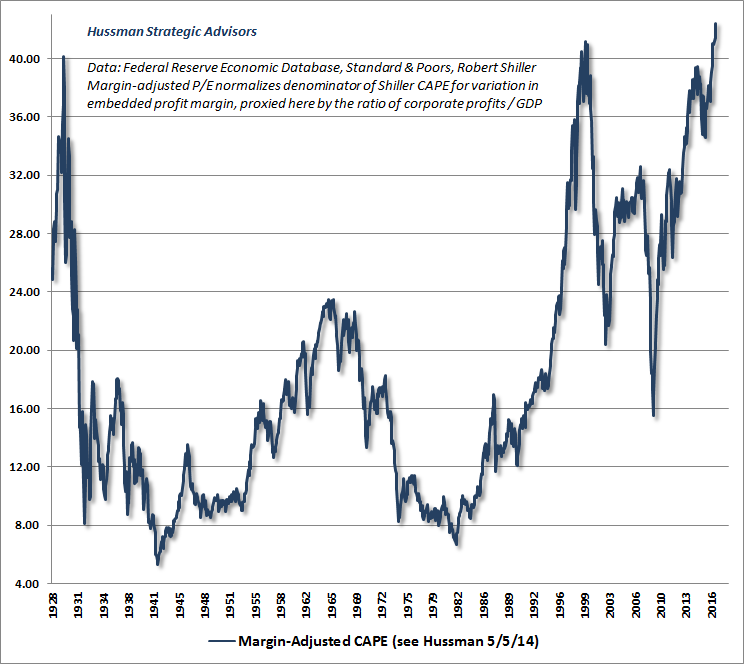
I saved the next chart until you could first see the strong correlation between the margin-adjusted CAPE and actual subsequent S&P 500 total returns across history. Given that relationship, the chart below shows the actual level across nearly a century of history, which may trigger a nosebleed. This measure is now more extreme than at any prior market peak, including 1929 and 2000.
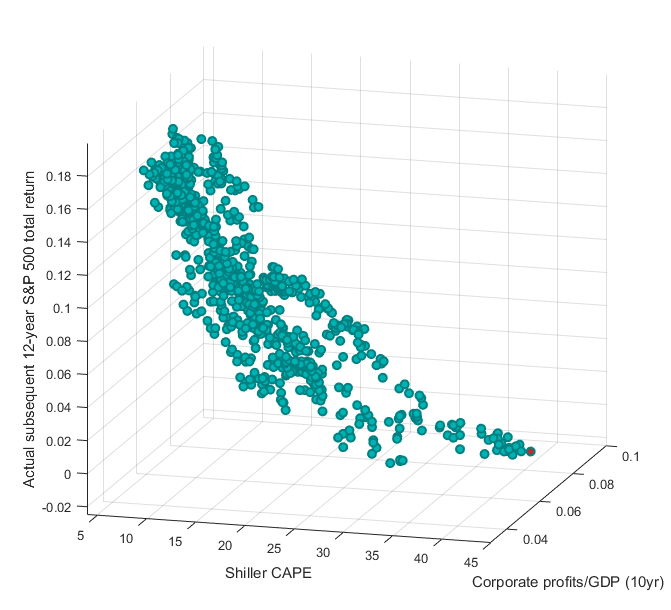
Finally, the chart below shows the interaction between the raw Shiller P/E and the embedded profit margin in determining actual subsequent market returns. As I’ve detailed previously, when earnings-based measures are used to explain subsequent market returns, the embedded profit margin almost always carries as much impact as P/E itself. [Geek’s note: regression analysis relating valuation measures to subsequent returns should always use log values. Intuitively, a valuation multiple of half the historical norm has the opposite impact on subsequent returns as a valuation multiple of twice the historical norm.] Compare the scatter of the raw CAPE above with the 3-dimensional scatter below, that captures the interaction between the CAPE and the embedded margin. The tighter scatter below is an expression of the following principle: the stock market performs best when starting conditions feature the combination of low multiples and depressed margins, and performs worst when starting conditions feature the combination of high multiples and elevated margins. The red dot reflects the current position of the CAPE and the embedded margin, with the prospective 12-year S&P 500 return set at the slightly negative level implied by nearly a century of data.
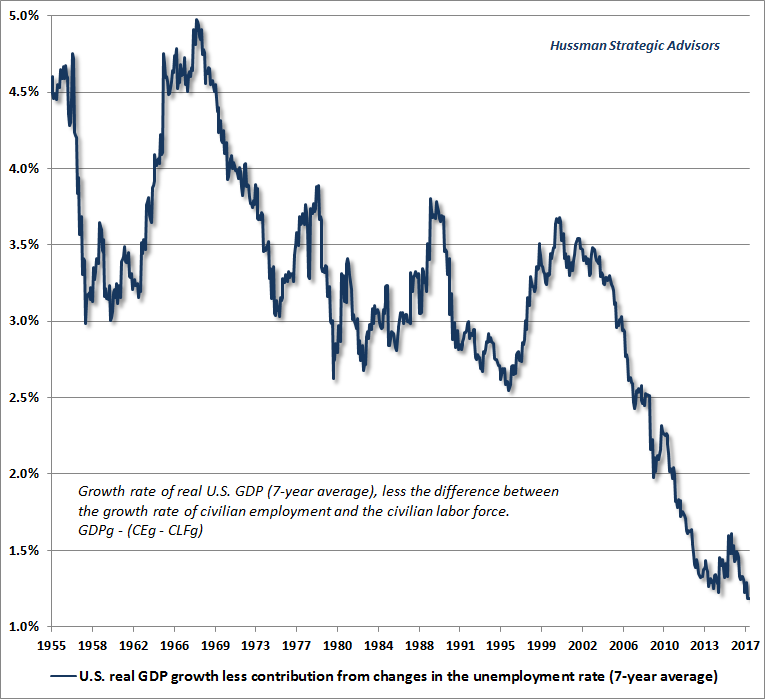
If one recognizes that every share of stock is a claim on a future stream of cash flows that will be delivered into the hands of the investor over a very long period of time, one should be very concerned about the valuations that investors are currently paying for those claims. In their exuberance about low interest rates “justifying” elevated market valuations, investors have neither quantified the “justified” effect of lower rates, nor appropriately considered the long-term dynamics of the cash flows they are purchasing. As I’ve previously observed, if one holds the growth rate of future cash flows constant, the impact of a reduction of interest rates (and prospective returns on competing assets like stocks) is straightforward to calculate. If interest rates are expected to be held, say, 2% below average for a period of say, 10 years, a one-for-one response for other assets would be to raise their valuations by about 20% (2% x 10 years) above their respective historical norms. For example, a $100 cash flow, deliverable in 20 years, would be priced at $21.45 in order to achieve an 8% return over that period ($100/(1.08)^20). If one reduces the prospective return to 6% for the first 10 years, and 8% thereafter, the appropriate price is ($100/(1.06^10)(1.08^10) =) $25.86, which is not surprisingly about 20% higher. So provided that investors actually expect future economic growth to match historical rates of growth, investors expecting interest rates to remain say, 2-3% below historical norms even another decade would still only be “justified” in bidding stock valuations 20-30% above their historical norms. On the most reliable measures we identify, current valuations actually approach 150% to 170% above those norms. Moreover, consider those growth assumptions. Since 1950, real U.S. GDP has expanded at an average rate of 3.1% annually, with employment growth contributing about half that amount, and productivity growth contributing the remainder. Over the past 20 years, real GDP growth has slowed to 2.3% annually, with slowing population growth and demographic factors resulting in an employment contribution of just 0.8% annually to that growth. In the past decade, real GDP growth has averaged just 1.4% annually, with an employment contribution of just 0.6%. Based on demographic projections by the U.S. Department of Labor, even if the unemployment rate does not rise from the present level of 4.4%, the contribution of employment growth to GDP will average less than 0.3% annually in the years ahead. The fact is that since 2010, nearly half of real U.S. GDP growth has been driven by a declining unemployment rate. This has largely prevented investors from recognizing that the two drivers of long-term growth, labor force growth and productivity growth, have slowed to just 0.3% and 0.6% annually, respectively. This puts the baseline for GDP growth in the coming years at less than 1% annually, and even a substantial improvement in productivity growth would leave average annual U.S. real GDP growth below 2%. Put simply, the underlying drivers of real GDP have been progressively weakening in recent decades, reflecting a combination of demographic factors and slowing productivity growth. Indeed, excluding the impact of changes in the unemployment rate (which are unlikely to help future growth, given an unemployment rate that has declined to just 4.4%), the structural drivers of U.S. GDP growth have never been weaker. The chart below shows post-war growth of U.S. real GDP, excluding the impact of cyclical fluctuations in the rate of unemployment. I’ve used a 7-year average to exclude the global financial crisis. Understand that the latest data point reflects the structural drivers of the U.S. economy even during the recent recovery.
The story is much the same for corporate performance, where yield-seeking speculation and extreme valuations have largely prevented investors from recognizing the persistent slowing in fundamentals that’s already underway. Since 1950, S&P 500 earnings have grown at an average annual rate of 5.5% (which notably includes the impact of share buybacks). In the past 20 years, that growth rate has slowed to 4.6% annually, with growth of just 1.7% annually over the past decade. Even including estimated foreign revenues, the growth rate of U.S. corporate revenues has gradually slowed over the past two decades, to a 2-3% annual range; less than half of its historical average. I’ve observed this before, and it’s essential to repeat it again: if interest rates are lower because likely future growth in deliverable cash flows is also lower, then no valuation premium is justified at all. On the measures we find most tightly correlated with actual subsequent market returns across history, the S&P 500 is now between 150% and 170% above valuation norms that have been approached or breached over the completion of every market cycle in history, including the most recent one. Allowing for a lesser retreat ending about 25% above those norms, I fully expect the S&P 500 Index to lose between 50-63% as this speculative episode unwinds. Even at that point, future prospective equity market returns are likely to be lower than investors have historically enjoyed. [Geek's Note: I'm not a great fan of infinite growth models, but the following result is very general. Consider the Gordon model P = D/(r-g). Provided that the long-term trajectory of future cash flows is held constant, reducing r alone will raise the price, and therefore the valuation multiple P/D. Accordingly, the investor's expected future long-term return falls to the lower r that is now embedded in the price. That's the "lower interest rates justify higher valuations" argument. The lower r does still mean that the investment should be expected to have lower future returns as well. In this case, that is accomplished via the higher valuation multiple. Ok. Now, simultaneously reduce both the discount rate r and the growth rate g to the same extent. What happens to the fair value P or the fair valuation multiple P/D? Nothing. Yet even though valuations haven't changed, the lower r does still mean that investors should expect lower future returns as well. In this case, the reduction in future returns is accomplished via the lower growth rate. Paying obscenely higher valuation multiples on the notion that they are "justified" by the lower r actually causes an additional, wholly unjustified collapse in future investment returns, which is exactly what I believe investors are inadvertently doing here.] When timing matters, and when it doesn’t “Well, valuations may matter eventually,” some investors may be thinking, “but timing is everything.” I’ll offer my view about that notion. The only timing that matters is the action one takes during the space between the emergence of an opportunity and the point that it goes away. As one of the few observers to anticipate both the 2000-2002 and 2007-2009 market collapses, with a constructive shift in-between, tell me how the criticism that I was “too early” actually mattered by the time those declines wiped out the entire total return of the S&P 500, in excess of Treasury bills, all the way back to May 1996, and June 1995, respectively. For most investors, “timing” wasn’t their friend at all, because they squandered the opportunity to take action at any point of overvaluation. The Federal Reserve certainly created a nightmare for us in the half-cycle since 2009, and we expect the mirror image of that nightmare to be unleashed on ordinary investors as the cycle completes. We’ve adapted our discipline in a historically-informed way. Equally important, we’ve repeatedly come out ahead in other complete market cycles because, as it happens, timing doesn’t matter nearly as much as investors imagine, as long as they respond to major opportunities before they go away. Look carefully at market valuations here. Current extremes present what I view as one of the three most important opportunities in history to defend capital. My sense is that many investors will squander this opportunity until yet another bubble implodes. To be very clear about my estimate of that risk, I expect the completion of the current cycle to wipe out the entire gain of the S&P 500, in excess of Treasury bills, all the way back to March 2000 (an outcome that would still leave the most reliable valuation measures we identify well-above their historical norms), and more likely back to roughly October 1997. See Durable Returns, Transient Returns for a reminder of how this works. Frankly, I don’t believe that investors should be surprised at all to see the S&P 500 trade at the 1000 level or lower by the completion of this cycle. That outcome would not even take our most reliable valuation measures below historical norms that they’ve approached or breached by the end of every market cycle in history. But it would be enough to take the S&P 500 -60% below the 2017 high, -56% below the 2016 high, -53% below the 2015 high, -52% below the 2014 high, -46% below the 2013 high, and indeed, below the high of every year since 1998. (On a total return basis, the corresponding loss figures would be -60%, -55%, -51%, -49% and -42%, respectively, and would put the total return of the S&P 500 behind Treasury bills as measured from the high of every year since 1998, with the exceptions of 2003 and 2009). In the event that our valuation concerns prove correct over the completion of this cycle, as they were in prior cycles, do investors really imagine that any of the market gains in the intervening years will have made a difference? From a valuation perspective, it should be clear that I view the market as having no “investment merit” at all here. Importantly, our measures of market internals have remained unfavorable despite the fresh attempt at new highs by the S&P 500 and Nasdaq indices. A uniform improvement in the behavior of market internals would indicate a fresh willingness among investors to embrace speculation, and could defer the consequences of obscene valuations even further (though with worse consequences down the road). In the absence of that improvement, it’s important for investors to recognize that the same essential features of prior market collapses are already in place. Over the complete cycle, market conditions always change, providing opportunities to embrace investment merit or speculative merit in U.S. stocks. Those opportunities will come soon enough. At present, we observe neither.The foregoing comments represent the general investment analysis and economic views of the Advisor, and are provided solely for the purpose of information, instruction and discourse. Please see periodic remarks on the Fund Notes and Commentary page for discussion relating specifically to the Hussman Funds and the investment positions of the Funds. --- The foregoing comments represent the general investment analysis and economic views of the Advisor, and are provided solely for the purpose of information, instruction and discourse. Prospectuses for the Hussman Strategic Growth Fund, the Hussman Strategic Total Return Fund, the Hussman Strategic International Fund, and the Hussman Strategic Dividend Value Fund, as well as Fund reports and other information, are available by clicking "The Funds" menu button from any page of this website. |
|||||||||||||||||||||||||
|
For more information about investing in the Hussman Funds, please call us at
1-800-HUSSMAN (1-800-487-7626) 513-326-3551 outside the United States Site and site contents © copyright Hussman Funds. Brief quotations including attribution and a direct link to this site (www.hussmanfunds.com) are authorized. All other rights reserved and actively enforced. Extensive or unattributed reproduction of text or research findings are violations of copyright law. Site design by 1WebsiteDesigners. |