|
|
||||||
|
|

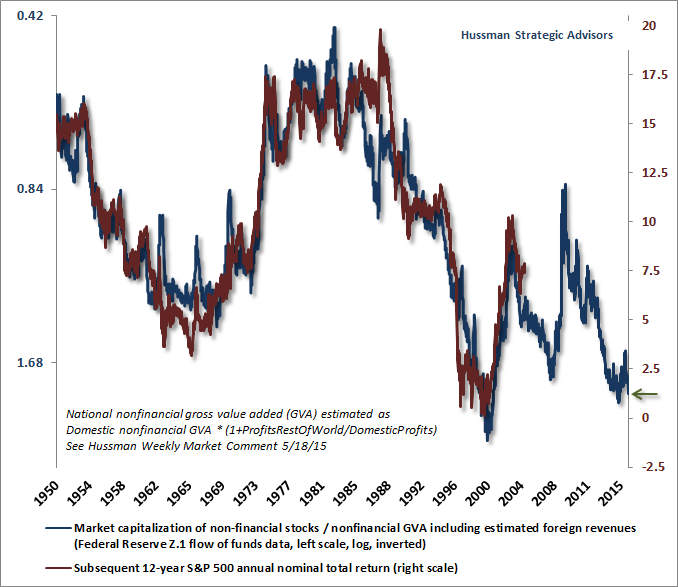
July 18, 2016 Scrounging Through the Dumpster From a long-term and full-cycle perspective, the most reliable valuation measures we follow - those with the strongest correlation with actual subsequent stock market returns across history - are consistent with roughly zero S&P 500 nominal total returns on a 10-12 year horizon, and the likelihood of an interim market loss of about 40-55% over the completion of the current cycle. As I noted last week, however, our near-term outlook is rather neutral, largely because enough trend-following components have improved (though our broadest measures of market internals have not) to keep us from pounding tables about immediate losses. Even as we allow for further near-term speculation, I remain convinced that the S&P 500 is likely to be lower a decade from now than it is today. The only wrinkle in an otherwise spectacularly hostile investment environment is that speculators appear to be so possessed by collapsing global interest rates that the immediacy of a market loss may be deferred until this fresh round of yield-seeking exhausts itself. As one observer told Bloomberg last week, “they’re out there scrounging through the dumpster looking for yield.” Notably, the completion of every market cycle in history, even those associated with very low interest rates, has brought 10-12 year expected equity returns into or beyond the 8-10% range. My impression is that investors are overestimating the capacity for Fed easing to avert every market loss, recession, or credit default cycle. Unfortunately, that assumption doesn’t even hold up to the 2000-2002 and 2007-2009 collapses, both which were accompanied by persistent, aggressive, and ineffective easing by the Federal Reserve. The chart below shows the market capitalization of non-financial equities relative to nonfinancial gross value-added (essentially corporate revenues, excluding double-counting of intermediate inputs, and including estimated revenues derived abroad). The blue line shows this ratio on an inverted left scale. The red line shows the actual S&P 500 nominal annual total return over the subsequent 12-year period. For a discussion of various valuation measures, how they rank in relation to actual subsequent market returns, and why earnings-based measures have such surprisingly weak performance, see Choose Your Weapon.
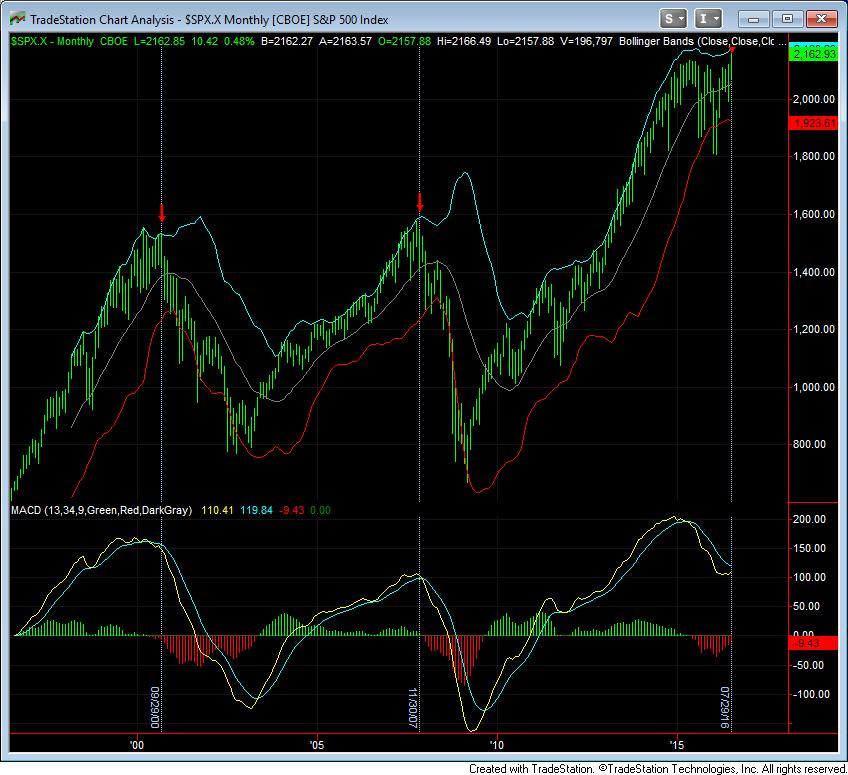
Long-term, full-cycle prospects Neither the likelihood of zero 10-12 year S&P 500 nominal total returns, nor negative real returns over that horizon, nor a 40-55% market loss over the completion of this cycle is dependent on any particular event. As I noted in Latent Risks and Critical Points, once extremely high latent risks have built up in a system, held together by a network of fragile interactions, attempting to predict the specific grain of sand that will trigger the avalanche isn’t particularly useful. The long-term and full-cycle outcomes we expect for the S&P 500 are not worst-case scenarios, but run-of-the-mill expectations that are already baked in the cake. Put simply, stocks will collapse over the completion of the present market cycle, even given a zero-interest rate environment, because the combination of frantic yield-seeking speculation and weak prospects for economic growth has already established the most punitive and unattractive full-cycle return/risk tradeoff for stocks since 1929. Consider this. Over the past century, Treasury bill yields have averaged about 3.5% and 10-year Treasury bond yields have averaged about 5%. Meanwhile, the S&P 500 has typically been priced for expected 10-year returns averaging about 10% annually. So even one expects zero-interest rate policy to prevail for another decade, the corresponding offset to zero Treasury bill yields and 1.5% 10-year Treasury yields would be to value the S&P 500 at a level consistent with 10-year prospective returns of about 6.5% annually. Unfortunately, that alone would require a market retreat of over 35%, based on valuation measures most closely related to actual subsequent market returns. But there’s another problem. A world where short-term interest rates are compressed to zero is also a world where economic growth is likely to run several percent below historical norms. The narrow gap between low expected growth and no growth at all implies an elevated probability of intervening recessions and credit strains. The extreme level of equity valuations also implies an elevated potential for steep cyclical drawdowns. In this high-risk environment, investors should be demanding larger-than-normal risk premiums on equities versus the returns available on Treasury securities. Instead, current stock valuations imply 10-year expected returns that provide no compensation at all for the additional risk. The fact that low interest rate environments have typically been associated with low growth is why the completion of every single market cycle in history, even those associated with very low interest rates, has brought valuations low enough to place prospective 10-year S&P 500 total returns into at least the 8-10% range. Interest rates do not need to rise for stocks to collapse (which, again, investors should recall even from the 2000-2002 and 2007-2009 episodes). Emphatically, the belief in a one-to-one relationship between 10-year Treasury yields and equity valuations is an artifact of the disinflationary period from 1980-1997. Outside of this period, the correlation between interest rates and equity valuations is roughly zero, and that correlation goes wholly the wrong way outside of the inflation-disinflation cycle from 1970-1997. See the charts in Voting Machine, Weighing Machine for a refresher. Even a historically normal return spread between interest rates and expected 10-year equity returns would place the S&P 500 more than 35% below current levels. Given the relatively weak correlation between bond yields and equity valuations across history, coupled with the low economic growth and high economic risk inherent in a zero interest rate world, it’s quite likely that equity valuations will revert in this cycle to the same range they have always established or breached in every market cycle across history. That outcome would take the S&P 500 down to half its present level. Quantitative easing and near-term speculation Reliable valuation measures are highly informative about long-term investment returns and full-cycle risks, but they often have very little relationship with market outcomes over shorter segments of the market cycle. During the Fed-induced yield-seeking bubble of recent years, this has been particularly true, as the novelty, persistence, and breathtaking recklessness of central bank easing outweighed even the usefulness of “overvalued, overbought, overbullish” syndromes that had reliably warned of steep market losses in prior cycles. That turned out to be our own Achilles Heel in the advancing half of the current cycle (see the “Box” in The Next Big Short for that narrative, and how we adapted in mid-2014). The hinge that distinguishes an overvalued market that holds up from an overvalued market that collapses is emphatically not monetary policy per se, but rather, the inclination of investors toward speculation or risk-aversion. That inclination is best inferred from the uniformity of market action across a broad range of individual stocks, industries, sectors and security types, including debt securities of varying creditworthiness (when investors are inclined to speculate, they tend to be indiscriminate about it). In the face of quantitative easing, even obscene valuations and “overvalued, overbought, overbullish” warning signals were not sufficient to adopt a hard-negative market outlook. One had to wait until market internals deteriorated explicitly before doing so. As we know from every extreme risk-seeking episode in history, including those that brought stocks to the 1929, 1937, 1972, 2007 and 2007 pre-collapse peaks, there need be nothing sensible, logically consistent, empirically sound, or even factual about the ideas that lead investors to speculate. Rather, extreme risk-seeking relies on “memes” or shared concepts about the world that may have little factual basis at all. As Warren Buffett correctly noted, “a pack of lemmings looks like a group of rugged individualists compared with Wall Street when it gets a concept in its teeth.” Quantitative easing is exactly that sort of concept. From the standpoint of the real economy, quantitative easing has no measurable economic impact. The global financial crisis ended the moment the Financial Accounting Standards Board abandoned mark-to-market accounting requirements for bank balance sheets in March 2009, and the trajectory of GDP and employment since then has been essentially no different than what could have been predicted from lagged values of wholly non-monetary variables (a fact that can be demonstrated by comparing constrained and unconstrained vector autoregressions). The main effect of QE has been breathtaking distortion in the financial markets, as the Fed has replaced interest-bearing bonds with trillions of dollars in zero-interest currency and bank reserves that must be held by someone at every moment in time. These hot potatoes created such discomfort that investors abandoned any consideration of risk-premiums or potential capital losses, in a desperate speculative reach-for-yield. Remember, however, that QE can only reliably encourage speculation if investors are already inclined to speculate. Yield-seeking only “works” if investors imagine away the risk of capital losses. After our measures market internals deteriorated in the third quarter of 2014, indicating a growing shift toward risk-aversion among investors, the “effectiveness” of zero interest rate policy deteriorated enormously. See, if investors are risk-averse, zero-interest liquidity becomes a desirable asset rather than an inferior one. Over the past two years, the broad market has gone sideways, stocks have become much more vulnerable to retreats, and central banks have resorted to ever more dramatic stick-save interventions in order to compensate. With their egos distended by delusions of grandeur, central bankers have become frantic to sustain the belief of investors that QE “works,” because only then can those beliefs be self-fulfilling. That’s why Haruhiko Kuroda, the head of the Bank of Japan, openly observed in early-June, “I trust that many of you are familiar with the story of Peter Pan, in which it says, ‘the moment you doubt whether you can fly, you cease forever to be able to do it.’” It’s also why the world was subjected last week to the narcissistic spectacle of 14 separate speeches from Federal Reserve members. A con-game doesn’t work without confidence. Where are we now? On a valuation basis, the long-term and full-cycle prospects for the equity market are awful. A 40-55% collapse over the completion of this cycle would be merely run-of-the-mill, as would zero nominal total returns over the coming decade (which would leave the S&P 500 Index itself at a lower level than it is today). There will undoubtedly be long periods of outstanding investment opportunity in coming market cycles, but recognize how extreme valuations are at present. The fact is that a secular low like 1949 or 1982, even twenty-five years from today, would be associated with S&P 500 nominal total returns averaging just 4% annually over that horizon, even on the optimistic assumption of 5% annual nominal economic growth over the same period (this is just arithmetic - see, for example, Ockham’s Razor and the Market Cycle). All of that gain would be from dividends. While the message from valuations is clear, the message from market internals is less well-defined here. Our best measures haven’t shifted to a constructive outlook, but enough trend-following components have improved that we’ve refrained from pounding our fists about near-term market losses. It might be more satisfying for our long-term and near-term outlook to be wholly consistent, but market conditions are much better described as offensively negative long-term, yet rather neutral near-term. As interest rates have collapsed in Europe and Japan (which we view as an indication of worsening global economic prospects), a slight improvement in month-to-month U.S. economic figures has left investors with a “Goldilocks” perspective that the economy is not-too-hot and not-too-cold, which has provoked rather aggressive short-covering. On Friday, the S&P 500 reached its upper monthly Bollinger band (two standard deviations above its 20-period moving average), at a point where the S&P 500 is wickedly overvalued and cyclical momentum has been rolling over. Similar extremes identified the final peaks of the 2000 and 2007 bull markets, but we’ve learned not to rely too heavily on even the most extreme overvalued, overbought, overbullish syndromes if market internals are not explicitly unfavorable. The recent advance amounts to a “technical breakout” from the perspective of many trend-following investors, and it’s not at all clear that the race to jump onto that particular wagon has been exhausted.
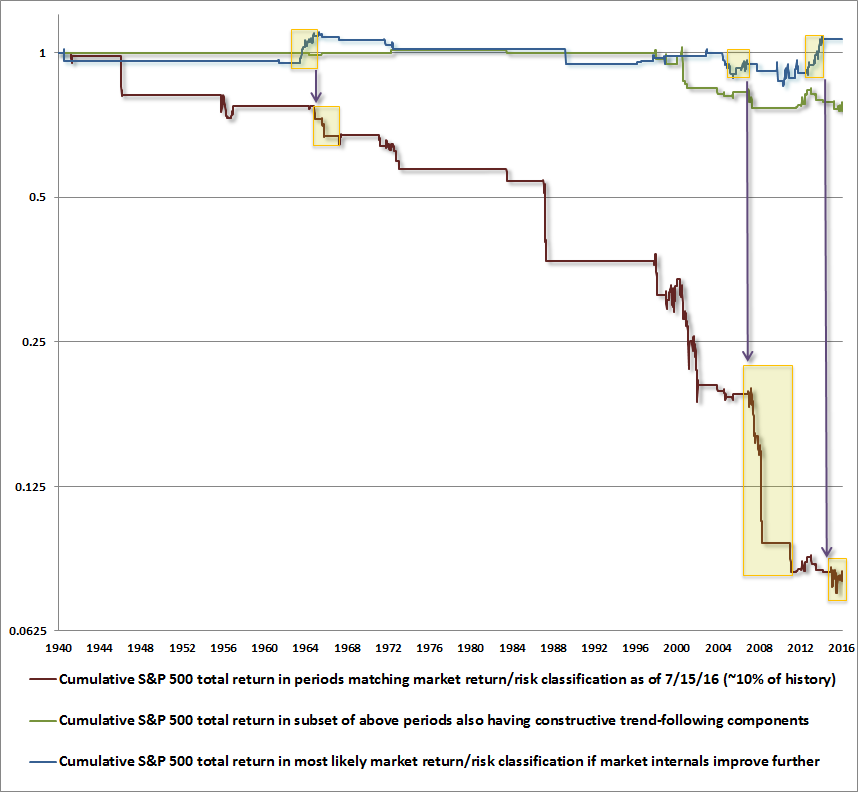
Probably the best way to characterize present conditions is to share what I’m seeing in the methods we use to classify the expected return/risk profile of the market. In the chart below, the red line shows the cumulative S&P 500 total return in periods that match the same market return/risk classification we observed last week. This classification represents about 10% of periods across history, and captures a nearly stair-step cumulative market loss of about 92%. That said, during about one-fifth of these periods (2% of history), various trend-following components within our measures of market internals were at least as positive as they are at present. The cumulative market return during this subset is shown in green, and while the cumulative market return is still negative, it is much more muted.
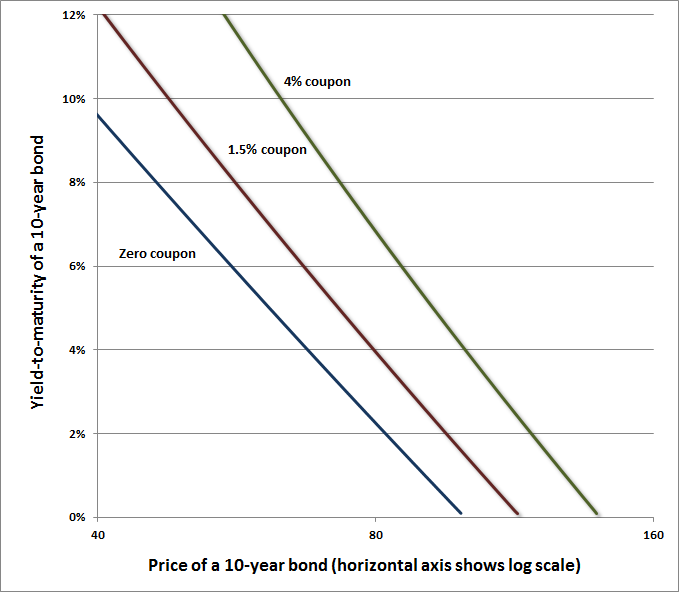
The blue line does not reflect the present return/risk classification, but the one I view as most likely in the event that market internals improve further. Average market returns under this classification were negative prior to the current market cycle, but have been more favorable in the face of quantitative easing. That’s the reason I’ve noted that a further improvement in market internals could shift our outlook to what might be described as “constructive with a safety net.” The chart above also shows a few boxes which illustrate the need for a safety net even if market internals improve further. The boxes along the blue line highlight most favorable periods in that market return/risk classification: one in the mid-1960’s, one approaching the 2007 market peak, and one approaching mid-2014 (there is also a smaller one approaching the 2000 peak). These represent periods when, despite an otherwise offensive market climate, market internals demonstrated enough uniformity to suggest that investors were inclined toward risk-seeking. Notice that the next shift was typically into the return/risk classification shown in red, and that the S&P 500 typically followed with significant losses. For that reason, any improvement in market internals that might warrant a modestly constructive outlook, in the face of otherwise offensive market conditions, should emphatically be paired with a safety net that doesn’t rely on stop loss orders. I remain particularly concerned about a break of the 1980 area on the S&P 500, which could provoke a coordinated attempt by trend-following speculators to exit if it were breached. My impression is that very little buying interest would be available to absorb that supply, except at substantially lower levels. Here and now, the near-term outlook is fairly neutral. Fuzzy thinking A few final notes. I’m sometimes asked why we don’t “adjust” valuation measures such as MarketCap/GVA or other metrics for interest rates. While the comparison between prospective equity returns and bond yields is certainly important, the question itself reflects fuzzy thinking on the subject. See, in order to estimate the price that links a given stream of expected future cash flows with a particular long-term rate of return, one needs two inputs: the expected stream of cash flows, and the desired rate of return. If the security is purchased at the resulting price, it will then deliver the assumed long-term rate of return provided that those expected cash flows are actually realized over time. Once the expected price is calculated (which embeds some desired rate of return), it can then be compared with the actual current price. Similarly, in order to estimate a long-term rate of return that links the actual current price with a given stream of expected future cash flows, one also needs two inputs: the current price, and a reliable “sufficient statistic” for those future cash flows. Once the expected rate of return is calculated, it can then be compared with competing returns on other assets. The chart below may clarify this point. The horizontal axis measures the price of a 10-year bond, on a log scale. The vertical axis shows the corresponding yield-to-maturity. Since the future stream of cash flows is fixed, the bond price itself is essentially a kind of valuation ratio. Three bonds with different coupon payments are shown, to illustrate that while the slopes are a bit different (and there’s actually slight curvature remaining), there is typically a fairly linear relationship between log valuations and subsequent long-term returns. Useful intuition here is that discounting future cash flows to present value involves exponents, so converting prices to the underlying discount rates involves logarithms. There is no need to “adjust” the bond prices by interest rates. Rather, one first estimates the expected return, and then compares that expected return with other alternatives.
At present, we expect nearly zero nominal total returns for the S&P 500 on a 10-12 year horizon. That’s even less than the unprecedented low yields available on Treasury bonds. Given the steeper downside risk of equities, we actually view cash - yes, poor low-yielding cash - as a very competitive alternative to equities here. That will certainly change over the completion of this market cycle, but at present, we strongly encourage investors to focus on low-risk holdings, hedged equity, and alternative investments not highly correlated with equity market fluctuations or credit risk. Another example of fuzzy thinking involves the perennial claim at market extremes that there is a mountain of “cash on the sidelines” still waiting to be invested in stocks. As I noted in early 2008, before the market collapsed: “Over the past week, there has been increasing talk that the current mortgage troubles are ‘closer to the end than the beginning,’ are ‘in the 7th or 8th inning,’ and so on. Along with those comments, some from heads of financial companies such as Morgan Stanley, are assertions that there is ‘a lot of cash on the sidelines’ to support the markets. It would be nice to believe these assurances. But as I noted in my October 15, 2007 market comment (Warning - Examine All Risk Exposures): ‘we're likely to observe a growing amount of what will wrongly be viewed as ‘cash on the sidelines’ and ‘money creation’ in the banking system’. - Hussman Weekly Market Comment, April 14, 2008 Simply put, every security that is issued has to be held by somebody, in exactly the form it was issued, until that security is retired. If the Federal Reserve effectively retires $4 trillion in government bonds from public ownership, and replaces them with $4 trillion of currency and bank reserves, somebody has to hold that cash, in that form, until it is retired. There is no such thing as this money going “into” the stock market. If a buyer comes “into” the market with cash, the cash goes right back out an instant later in the hands of the seller. Likewise, if trillions of dollars of low-interest Treasury bills, low-yielding corporate debt, and other securities have been issued, those securities have to be held by somebody, in exactly that form, until they are retired. One can call all of this low-interest paper “cash on the sidelines” if one wishes, but the essential fact is still that those securities will never come off the “sidelines” until they are explicitly retired. Until then, they must be held by someone, at every moment in time, in exactly the form in which they were issued. Stock prices don’t go up or down because money goes “into” or “out of” the market. For every buyer, there is a seller. Every dollar that comes in goes out. All that matters is who is more eager - the buyer or the seller. Speculative yield-seeking has certainly produced eager buyers, who have driven virtually every asset class to nosebleed valuations and dismal prospective future returns. At present, zero interest cash is quite competitive with risky assets, so be wary of the assumption that just because cash earns virtually nothing, any risk asset offering a yield must be dominant. Again, yield-seeking only “works” as long as investors imagine away the risk of capital losses. Though we should allow for the possibility of further near-term speculation, those full-cycle losses will ultimately arrive nonetheless.The foregoing comments represent the general investment analysis and economic views of the Advisor, and are provided solely for the purpose of information, instruction and discourse. Please see periodic remarks on the Fund Notes and Commentary page for discussion relating specifically to the Hussman Funds and the investment positions of the Funds. --- The foregoing comments represent the general investment analysis and economic views of the Advisor, and are provided solely for the purpose of information, instruction and discourse. Prospectuses for the Hussman Strategic Growth Fund, the Hussman Strategic Total Return Fund, the Hussman Strategic International Fund, and the Hussman Strategic Dividend Value Fund, as well as Fund reports and other information, are available by clicking "The Funds" menu button from any page of this website. |
|||||||||||||||||||||||||
|
For more information about investing in the Hussman Funds, please call us at
1-800-HUSSMAN (1-800-487-7626) 513-326-3551 outside the United States Site and site contents © copyright Hussman Funds. Brief quotations including attribution and a direct link to this site (www.hussmanfunds.com) are authorized. All other rights reserved and actively enforced. Extensive or unattributed reproduction of text or research findings are violations of copyright law. Site design by 1WebsiteDesigners. |