|
|
||||||
|
|

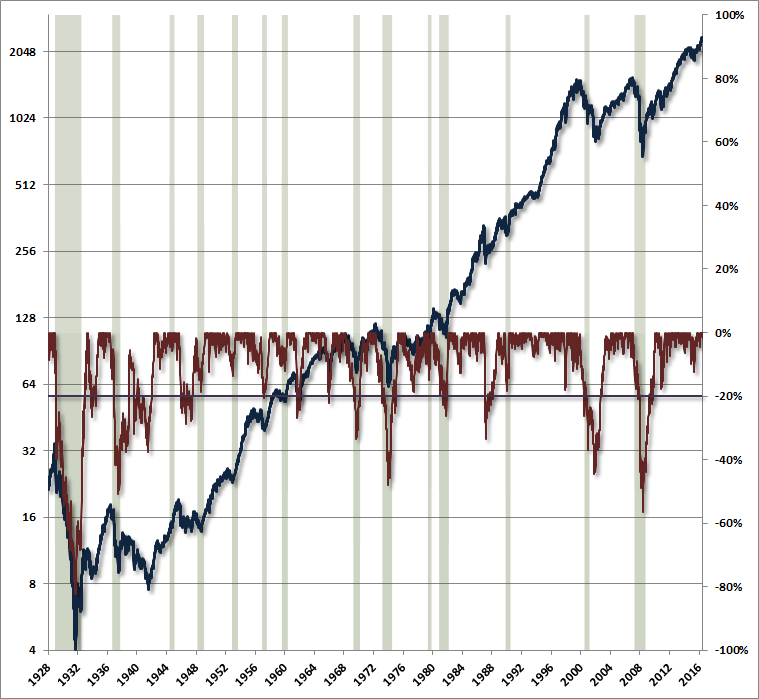
April 17, 2017 The Value of Dry Powder One of the benefits of historically-informed investing is that it allows various investment perspectives to be evaluated from the standpoint of evidence rather than verbal argument. That’s particularly important during periods like today, when much of financial commentary on Wall Street can be filed into a folder labeled “it’s hard to argue with your logic, if only your facts were actually true.” The inconvenience of historically-informed investing, at least during episodes of reckless speculation, is that it’s sometimes rewarding to follow the crowd in its embrace of invalid ideas, at least for a while. That has certainly been the case for a longer period during the recent half-cycle than in most market cycles across history. “In the short run,” as the legendary value investor Ben Graham once wrote, “the market is a voting machine,” and it’s quite clear that the votes aren’t always cast in favor of value or even fact. Still, Graham continued, “in the long run, it is a weighing machine.” Despite our strong focus on value-conscious investing, we do place some of our attention on tracking that “voting machine,” largely through the uniformity or divergence of market internals across a broad range of stocks and security-types (when investors are inclined to speculate, they tend to be indiscriminate about it). The most effective information from market internals comes when steep overvaluation is joined by deteriorating internals (a warning sign), or when a substantial retreat in valuation is joined by early improvement in market internals (a constructive sign). With market valuations obscene, extreme "overvalued, overbought, overbullish" syndromes in place, interest rates off the zero-bound, and market internals still showing evidence of dispersion, we remain convinced that investors face very steep downside risks over the completion of the current market cycle. Good logic and bad facts As is typical at market extremes, the focus of Wall Street’s narrative is on minimizing the consideration of these risks. Among the arguments we hear quite a bit is the notion that large market losses only occur when a recession unfolds, so until a recession unfolds, the risk of large market losses can be dismissed. Again, it’s hard to argue with that logic, if only the facts were actually true. In any given week since 1928, there has been a 21% chance of an S&P 500 loss in excess of -20% within the following 18 months, as measured from the prevailing level of the S&P 500 at the time. Yet for more than 40% of those points, the U.S. economy was not in a recession within the preceding or following 6 months, and 33% saw no recession over the entire subsequent 18-month period. If we look at individual bear markets since 1940, nearly 40% them were associated with no recession at all. Even when market losses have been associated with a recession, much of the damage has been exerted before the recession was widely recognized. By the time the typical U.S. recession starts, the S&P 500 is already down by more than -9%, extending that loss to an average of -12% within 5 weeks of the start of the recession, and -16% within the first 10 weeks. Even those figures rely on the back-dating of recessions by the National Bureau of Economic Research (NBER), as U.S. recessions are almost never recognized until months or quarters after they begin. The chart below shows the S&P 500 Index (blue line, left scale), along with the percentage loss of the S&P 500 at each point in time, relative to its prior 2-year high (red line, right scale). The chart uses weekly closing data, so actual market losses on a daily closing basis were somewhat deeper. Recessions are shaded. Along with the general historical perspective, pay particular note to the steepness of market losses once they get underway. It’s certainly true that market losses tend to be deeper when they are accompanied by a recession, but again, substantial losses can emerge even before a recession is recognized, and even without one occurring at all.
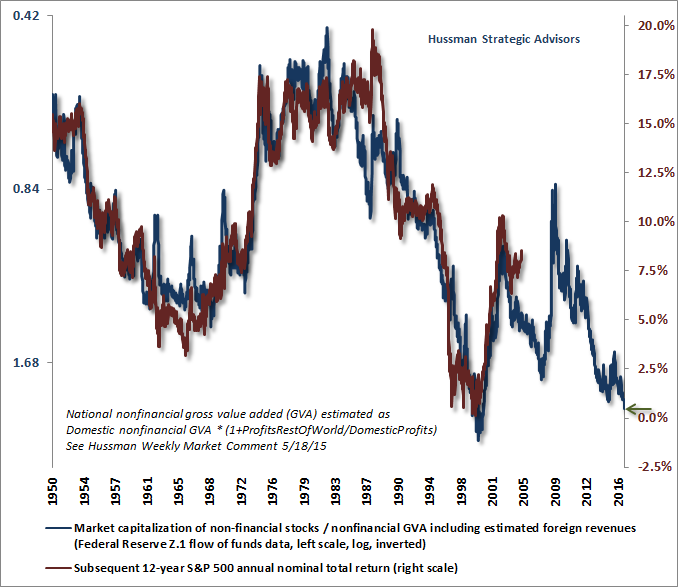
It's true that the deepest bear markets are associated with recessions. Across all bear markets, the median S&P 500 loss is -32%, but the median approaches -40% when joined by a recession. Even in those instances, market losses tend to be underway before the accompanying recessions start, and well before they are actually recognized by investors (or the consensus of economists). Given present labor market demographics and productivity trends, the central tendency for U.S. real GDP growth is currently just 0.8%. I expect productivity to increase enough to bring that central tendency to an average of just under 2% annually over the coming 8-10 years, but even that pickup is likely to follow the next recession, and we shouldn't be surprised if the economy grows hardly at all in the next few years. The current position of employment and the trade balance within the economic cycle is quite extended, which reduces the likelihood of a sustained acceleration at this point in the cycle (see Stalling Engines). Meanwhile, the leverage of non-financial companies has never been higher relative to corporate revenues. That's something to consider, because profit margins predictably retreat in economic downturns. Put simply, to expect the next bear market to be unaccompanied by a recession seems wishful thinking. The value of dry powder Based on current valuation extremes, the outlook for prospective 12-year S&P 500 total returns remains dismal, likely averaging less than 1% annually by our estimates. Our estimate of 12-year total returns for a conventional portfolio mix of 60% stocks, 30% bonds, and 10% T-bills remains near a historic low of about 1.5% annually. This profile of expected returns is likely to improve substantially over the completion of the current market cycle. Indeed, no market cycle in history, including the most recent cycles, and even those accompanied by quite low interest rates, has failed to bring estimated 10-12 year equity market prospects into the 8-10% range, or beyond. The immediate refuge of those inclined to ignore current risks is to appeal to arguments that revolve around low interest rates. Prior commentaries, such as The Most Broadly Overvalued Moment in Market History may disabuse investors of Wall Street's rhetoric on that subject. Probably the quickest and most intuitive way to do so is to recognize that if future nominal cash flows of a given asset are held constant, and interest rates are expected to be held say, 2.5% below historical norms for the next 8 years, a "justified" response would be to bump up the present discounted value of that asset by roughly 8 x 2.5% = 20%; an increment that would reduce future returns on the asset by that same cumulative amount. Yet the most reliable measures of equity valuation are presently about 160% above their pre-bubble historical norms. Moreover, the historical fact is that sustained periods of low interest rates generally emerge when nominal growth rates are correspondingly low (see Rarefied Air: Valuations and Subsequent Market Returns). So it's a rather poor assumption to believe that future nominal cash flows will grow at historically normal rates and yet interest rates will remain depressed. Without that assumption, lower interest rates should be expected to go hand-in-hand with lower growth in future cash flows. In that case, the "justified" valuation premium associated with low interest rates vanishes altogether, and yet the future returns of the asset are depressed anyway. You can use any standard discounted cash flow approach to prove this to yourself. In short, the belief that depressed interest rates "justify" current valuation extremes is based on ignorance of both historical valuation relationships and basic asset pricing arithmetic. Speculative extremes across history have been regularly accompanied by arguments that we've all become smarter now, that risks can be hedged with greater sophistication, that policy makers have learned from the past, that risk premiums deserve to be smaller in the future, and that elevated market valuations can maintain a permanently high plateau. Strange then, how badly those arguments unwound even in the two most recent market cycles. The arguments are nothing new. Even in the 1920's, the rise of investment companies gave investors the impression that because individual stock risk could be diversified, overall market risk had become smaller. Valuation extremes require investors to argue "this time is different" - to dismiss the entire history of the financial markets - because valuation extremes have always ended badly. As Business Week lamented just after the crash of 1929, "During every preceding period of stock speculation and subsequent collapse there has been the same widespread idea that in some miraculous way, endlessly elaborated but never actually defined, the fundamental conditions and requirements of progress and prosperity have been changed, that old economic principles have been abrogated... that business profits are destined to grow faster and without limit, and that the expansion of credit can have no end." The chart below shows the most reliable market valuation measure we identify, nonfinancial market capitalization to corporate gross value added, on an inverted log scale (blue line, left scale), along with the actual 12-year nominal annual total return for the S&P 500 Index (red line, right scale). As we observed during the severe market retreats that followed the tech bubble and the mortgage bubble, substantially higher expected returns are likely to emerge over the completion of this market cycle, as a result of interim losses in the next few years. Dry powder has considerable value here, not because of the return it currently generates, but because of the opportunity it may afford to establish constructive and even aggressive market exposure over the completion of this cycle, at higher prospective returns than are currently available. For that reason, whether investors choose hedged alternatives or cash, I strongly encourage investors to maintain a regular, disciplined saving plan.
Given the objective data regarding the relationship between reliable valuation measures and subsequent market returns, investors should be able to reach conclusions with two eyes and their own intellect. There’s a little cottage industry that dismisses this evidence by deriding me personally, but I suppose those observers will harvest what they sow. On that point, however, it’s worth recalling that I advocated a leveraged investment outlook for years in the early-1990’s, identified stocks as steeply overvalued by the 2000 market peak, shifted to a constructive outlook in early 2003, anticipated the oncoming market losses and credit strains at the 2007 peak, and identified stocks as undervalued in real-time in late-2008 and 2009, after the market collapsed. I became defensive well before both the 2000 and 2007 peaks, yet our discipline came out ahead over those complete market cycles, not least because the 2000-2002 and 2007-2009 declines wiped out the entire total return of the S&P 500, in excess of Treasury bills, back to May 1996 and June 1995, respectively. One can assume this was just luck, or one can recognize that every shift was consistent with the fact that valuations matter over the complete market cycle. I’ve regularly noted that our challenges in the speculative half-cycle since 2009 were a failure of neither our measures of valuation, nor our measures of market internals. Instead, they were the inadvertent result of my 2009 insistence on stress-testing our market return/risk classification methods against Depression-era data. The resulting methods validated much of what we had developed in post-war data, but also boosted our reliance on a particular historical regularity: in market cycles across history, extreme “overvalued, overbought, overbullish” syndromes had regularly been followed by steep market losses. The sheer novelty of quantitative easing and zero interest rate policy turned that regularity into an Achilles Heel, as relentlessly aggressive (I’d even say deranged) monetary easing encouraged investors to speculate even after those extreme syndromes repeatedly emerged. We adapted in 2014, but not soon enough to rescue this half-cycle, and not so nimbly to be of much benefit during the extended top-formation of a still-wickedly hypervalued market. See Portfolio Strategy and the Iron Laws for additional discussion. With regard to near-term conditions, we’ve seen some improvement among interest-sensitive sectors, but deterioration in broad equity market participation, which is something of a wash. Treasury yields have retreated and the yield-curve has narrowed, which is consistent with an increase in concerns about economic growth. At this point, though, we don’t have recession warning signals in place, and the breakdown in the correlation between survey-based measures of economic activity and actual subsequent output and employment leaves investors flying with less visibility than usual at this point in the economic cycle (see Echo Chamber). My sense is that credit spreads deserve close attention here, as widening credit spreads would be the strongest confirmation that the retreat in Treasury yields provides meaningful information about economic prospects. Normally, data from purchasing managers surveys would also be an important focus, but again, these have been weakly correlated with economic outcomes and strongly related to stock market sentiment of late. Instead, confirmation about the trajectory of the economy will likely come from closely coincident measures of actual economic activity, such as industrial production, real sales, and real personal income. In any event, investors should emphatically not rely or wait on evidence of economic risk as a prerequisite for examining their equity market risk. Remember that the average bear market erases more than half of the preceding bull market gain, and the complete market cycle is enormously forgiving to investors who reduce their risk exposure at rich valuations. At the very least, investors should carefully ensure that their investment positions are consistent with their actual investment horizon and risk-tolerance. That said, investors who cannot tolerate the idea of missing out on a potential market advance, even at offensively high valuations, probably should not read my stuff. Again, even for passive investors, take care to ensure that your exposure to stocks is consistent with your actual risk tolerance and investment horizon. In particular, I continue to believe that passive investors should set their exposure so that they would be capable of weathering a 40-60% loss in the S&P 500 over the completion of the present market cycle, and 12-year S&P 500 total returns averaging less than 1% annually, without abandoning their discipline in the interim. The foregoing comments represent the general investment analysis and economic views of the Advisor, and are provided solely for the purpose of information, instruction and discourse. Please see periodic remarks on the Fund Notes and Commentary page for discussion relating specifically to the Hussman Funds and the investment positions of the Funds. --- The foregoing comments represent the general investment analysis and economic views of the Advisor, and are provided solely for the purpose of information, instruction and discourse. Prospectuses for the Hussman Strategic Growth Fund, the Hussman Strategic Total Return Fund, the Hussman Strategic International Fund, and the Hussman Strategic Dividend Value Fund, as well as Fund reports and other information, are available by clicking "The Funds" menu button from any page of this website. |
|||||||||||||||||||||||||
|
For more information about investing in the Hussman Funds, please call us at
1-800-HUSSMAN (1-800-487-7626) 513-326-3551 outside the United States Site and site contents © copyright Hussman Funds. Brief quotations including attribution and a direct link to this site (www.hussmanfunds.com) are authorized. All other rights reserved and actively enforced. Extensive or unattributed reproduction of text or research findings are violations of copyright law. Site design by 1WebsiteDesigners. |