|
|
||||||
|
|

April 6, 2015 Stock-Flow Accounting and the Coming $10 Trillion Loss in Paper Wealth Many of the misconceptions that investors hold about the economy and the financial markets can be clarified by understanding the relationship between the “flow” and “stock” of various quantities in the economy. Before going further, let's take a minute for some background. The total quantity of currency and bank reserves in the economy – what’s known as the “monetary base” – is uniquely determined by the Federal Reserve, and is equal to the stock of Treasury and mortgage securities on the Fed’s balance sheet. Once the Fed creates a dollar of monetary base (which the Fed does by purchasing a government security and paying for it with Fed-created base money), that dollar remains in the form of base money until that dollar is retired by the Fed. Monetary base is retired when the Fed sells a government security, or receives payment at maturity. In both cases, the assets on the Fed’s balance sheet are reduced by the amount of government securities it no longer owns, and the liabilities on the Fed’s balance sheet are reduced by the amount of base money it takes back in. To see that a dollar bill is a liability of the Fed, read the top line of any bill in your pocket. Again, base money, once created, cannot take another form. It must remain in the form of either currency or bank reserves, and must be held by someone in the economy at every point in time. From a “flow” perspective, it can only change hands until it is retired. One can use it to buy something else – stocks, bonds, apple pie, chinchillas – but the base money simply changes hands and becomes the property of the seller. It doesn’t “go into” stocks, bonds, apple pie, or chinchillas – unless the cash is actually baked in the pie or eaten by the chinchilla. The same is true more generally. Every security that someone views as an asset is also a liability to someone else in the economy. Every share of stock that is issued must be held by someone in the economy, in the form of a stock certificate, until that stock is retired. Every bond that is issued must be held by someone in the economy until that bond is retired. In aggregate, stocks can’t “go into” bonds. Cash can’t “go into” stocks. Bonds can’t “go into” cash. They are all pieces of paper that remain in the form in which they have been created until they are retired by the issuer. So how does the total volume of securities in the economy ever change? Simple. Securities are evidence of something very specific: the past saving of one person that is transferred (intermediated) to someone else. Securities are evidence that somebody earned money, had the option of spending it on consumption, and decided instead to save it and transfer it for use by another economic participant. New securities are created in the economy each time some amount of purchasing power is transferred to others, rather than consuming it. Decker, Bessie, Joe and you Consider a simple economy. You use wood from your back yard to produce lumber, which you sell to Decker for $100 of currency (which Decker holds as evidence of past saving he has done). At the same time, Bessie produces milk on her farm, which she sells to Joe. But Joe needs currency to pay Bessie, and instead has a few shares of stock (which embody past saving that Joe has done). At current prices, Joe can get $100 by selling one share of stock to you in exchange for your currency. He then pays Bessie for the milk, and drinks it. Bessie is a cash cow, and adds the $100 to her stack of currency that embodies her past saving. We can assume that there are many others in the economy who have currency, stocks, and bonds that embody their past saving, but we don’t need to name them for this example. On the security side, you now own $100 of stock that used to be held by Joe, and Bessie has $100 of currency that used to be held by Decker. On the real side, the economy has produced $200 of wood and milk, but only $100 of that output has been consumed. So there’s $100 of new saving in the economy. On balance, you and Bessie produced without consuming, and Joe consumed without producing, so you and Bessie are the savers, and Joe is the dissaver in the current period. Given $100 of overall saving, there must be $100 of new real investment. Who’s got it? Decker, in the form of unused wood inventory. Decker has neither produced nor consumed – he’s just traded his prior saving for current investment. Has there been any new security issuance? No, because neither you nor Bessie has intermediated your savings for someone’s use. The stock trade just represented existing securities changing hands. Now suppose that Decker uses the wood to build a small stairway for a government building, for which he sends a bill to Uncle Sam for $150. If the government goes into deficit to pay that bill, it has to sell $150 worth of bonds to someone, in return for $150 of currency. Who has currency? Bessie, and she uses $150 of currency to buy $150 of freshly printed Treasury bonds. The government uses the $150 of currency to pay Decker. If you account carefully, the whole set of transactions has now produced $150 of real investment (the stairs) on balance, so the economy must have produced $150 in net new saving: your $100 and Decker’s unspent $50 profit. Yet in this case, $150 of new securities have been created in the economy, while there were no new securities created in the previous paragraph. That may not make sense until you realize that that’s the amount of savings that Bessie intermediated to the government. The net acquisition of securities is still zero, because the bonds that Bessie counts as an asset are the same bonds that the government counts as a liability. If the Fed now launches QE, it does so by purchasing Treasury securities from Bessie, and paying for them with newly printed currency or crediting Bessie’s bank account with reserves (base money). Does that inject new purchasing power into the economy? No, it does not. It just changes the form of government liabilities held by the public, from bonds to base money. Is Bessie more likely to consume just because her savings take the form of cash instead of bonds? No – not if she didn’t have spending plans already, and not unless the economy was otherwise constrained by a lack of currency. Now, there’s a central issue we have yet to address, which relates to changes in the value of existing securities. Once issued, all of these pieces of paper can vary in price later, so the saving that someone did in a prior period, embodied in the form of some paper security, may be worth more or less consumption in the current period than it was initially. That’s really the main effect QE has – to encourage yield-seeking speculation that drives up the prices of risky securities, but without having any material effect on the real economy or the underlying cash flows that those securities will deliver over time. It's tempting to believe that by introducing a fractional reserve banking system, we can create something for nothing. But that isn't actually the case. In order to assume that banks freely "create" money as some inverse of the reserve ratio, what quietly has to happen is that at every round of lending, someone credit-worthy has to borrow the money, must be able to draw production out of someone else in the economy, must feel confident that their own output will have a market if they create it, and must feel capable of repaying the debt that they took out. All of that doesn't simply happen, but instead imposes the subtle requirement that there are unexploited opportunities for productive activity, and that both supply and demand of goods, and supply and demand for loans, all passively and automatically expand. The magical "money multiplier" we all learned (and some of us taught) might be possible in that case, but stops being very interesting for any practical purpose. I'm actually slightly embarrassed that I used to teach the money multiplier 20 years ago as an economics professor, because the whole concept glosses over everything that's actually important to economics. One could imagine a world where people borrow from one bank solely for the sake of depositing it in the next bank, with no real transactions in-between, which would create a huge banking system with no increase in real activity. But in a real economy, the amount of credit creation by banks is largely a reflection of the underlying supply and demand both for loans and for real goods and services. Fundamentally, it's the act of value-added production that "injects" purchasing power into the economy (as well as the objects available to be purchased), because by that action the economy has goods and services that did not exist previously with the same value. So you make $100 of wood from your backyard and sell it to Decker for $100 of his prior savings. At that point, Decker has neither produced nor consumed. But the economy now has $100 of new savings, and $100 of new investment. The economist Jean Baptiste Say embodied this principle - which is really just an accounting identity - as "Say's Law": when the economy produces something, a full accounting of the income from that production is always precisely equal to the value of the output. Say's Law is sometimes simplified to say "production creates its own demand," but technically that's true only if unintended inventory accumulation is included in the definition of demand (one can always produce something that nobody else wants). Still, it's always true that wealth is embodied in the capacity to produce (productive capital, stored resources, infrastructure, knowledge), and net income is created when that capacity is expressed in productive activity that adds value that didn't exist before. For now, keep in mind that money doesn’t go “into” the stock market – it goes through it from a buyer to a seller. The resulting price changes are purely changes in the relative value that people place on these pieces of paper, and amount to changes in the amount of “paper wealth” in the economy. These changes should emphatically be distinguished from the real wealth of the economy, and the underlying stream of cash flows that will be generated over time. The relationship between those two quantities – between the price of the piece of paper and the underlying stream of deliverable long-term cash flows – tells us about valuation and probable long-term investment returns (even if speculative factors play a role in driving paper wealth over the shorter term). We’ll cover those valuation issues shortly. The wealth of a nation is its accumulated stock of real investment, human capital, and resources So far, we’ve established that every security that is issued must be held by someone in the economy, in the form that it was issued, until that particular security is retired. Now let’s think about the “real” side of the economy – goods and services. When output is produced in the economy, it has one of two fates. Either the output is consumed, or it isn’t. Those goods that are not consumed are called “real investment,” and may represent capital goods, machines, factories, housing, or just unplanned inventory buildup. Though the national income statistics don’t capture it, we can also think of some services that are produced and not fully “consumed” in the same period – the primary example being education. All of this real investment can depreciate as it is consumed over time, which occurs as machines wear out or education is forgotten or goes unused. But used productively, that real investment is also the basis of national wealth. If one carefully accounts for what is spent, what is saved, and what form those savings take (securities that transfer the savings to others, or tangible real investment of output that is not consumed), one obtains a set of “stock-flow consistent” accounting identities that must be true at each point in time: 1) total real saving in the economy must equal total real investment in the economy; 2) for every investor who calls some security an “asset” there is an issuer that calls that same security a “liability”; 3) the net acquisition of all securities in the economy is always precisely zero, even though the gross issuance of securities can be many times the amount of underlying saving; and perhaps most importantly, 4) when one nets out all the assets and liabilities in the economy, the only thing that is left – the true basis of a society’s net worth – is the stock of real investment that it has accumulated as a result of prior saving, and its unused endowment of resources. Everything else cancels out because every security represents an asset of the holder and a liability of the issuer. Conceptualizing “saved or unconsumed resources” as broadly as possible, the wealth of a nation consists of its stock of real private investment (e.g. housing, capital goods, factories), real public investment (e.g. infrastructure), intangible intellectual capital (e.g. education, inventions, organizational knowledge and systems), and its endowment of basic resources such as land, energy, and water. In an open economy, one would include the net claims on foreigners (negative, in the U.S. case). Understand that securities are not net economic wealth. They are a claim of one party in the economy – by virtue of past saving – on the future output produced by others. Because the surplus of one economic sector must be identically equal to the sum of deficits across all other sectors, the net funds available to acquire financial assets across the economy as a whole (including net flows from abroad), will always be precisely zero. However, each sector taken separately will acquire net financial assets, or issue net financial liabilities, equal to that sector’s saving or deficit (the difference between the sector’s income and its spending). The importance of stock-flow consistent economic accounting was well-recognized by many economists sometimes dubbed the “New Cambridge” school (Godley, Cripps, Kaldor, Kalecki, and Tobin among others) but stock-flow consistency is rarely taught in economics courses, largely because the models often include additional arbitrary decision-making rules (like Keynes’ simplistic consumption function) that aren’t based on rational choice or optimization. Instead, mainstream academic models often exclude the financial sector completely, and include money as if it were simply dropped from the sky. The failure to recognize that stock-flow consistency must hold in the economy and the financial markets is the basis for an enormous amount of misunderstanding in both fields. That omission of clear thinking about the link between economics and finance contributes to misguided policies that ignore the impact of financial distortions on the real economy, and invite speculation, malinvestment, and ultimately financial crisis. Valuation: the link between financial prices and real economic flows All securities are essentially a way to trade current saving for a claim on future output. The value of all the securities in the economy derives from the claim on future output that this stock of real and intellectual capital can generate over time. During speculative bubbles and periods of malinvestment, saving is invested in unproductive projects that essentially result in unintended consumption rather than accumulation of productive assets. This means that the stock of outstanding securities is essentially “backed” by a smaller stock of productive capital to service those securities over time. This point is fundamental, because it is part of the reason the U.S. economy has been failing much of its population. The economic policies we’ve pursued have put a premium on current consumption and have encouraged yield-seeking speculation, while discouraging saving and productive investment in both the private and public sectors. For more on why this emphasis on debt-financed consumption is central to our economic challenges, see Eating Our Seed Corn: The causes of U.S. economic stagnation, and the way forward. Yield-seeking speculation promoted by the Fed’s zero interest rate policy has done two things: On the real side of the economy, this policy has discouraged saving, while channeling what saving that does occur into increasingly speculative areas of the economy – witness the enormous issuance of junk debt and leveraged loans to already highly-indebted borrowers in recent years, as investors clamored for a “pickup” in yield over safer investments. On the financial side, this yield-seeking has dramatically elevated the prices of existing securities, but with far less expansion in the stock of real, productive capital underlying those investments. When one compares the value of U.S. equities to corporate net worth, one observes the ratio (Tobin’s Q) beyond the extremes of 1907, 1929, 1937, 1972, and 2007 – with greater overvaluation evident only at the 2000 peak.
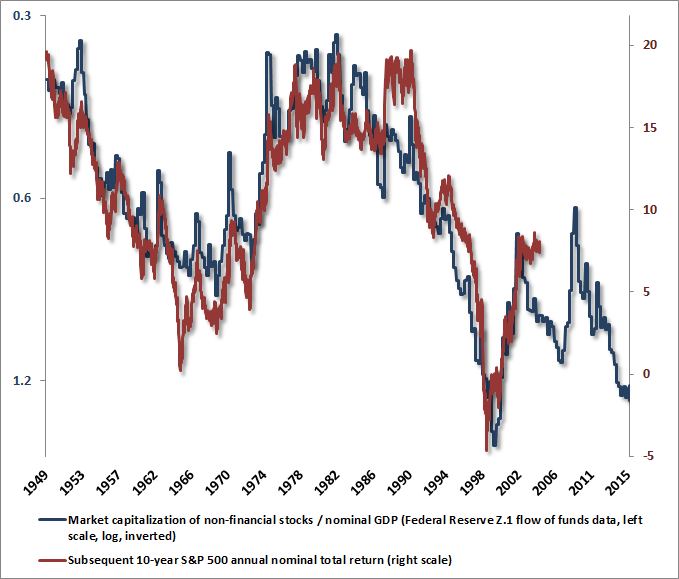
The Fed has been attempting to create a “wealth effect” driven by yield-seeking speculation, despite no empirical evidence that consumption responds significantly to changes in volatile assets like stocks – Friedman and Modigliani were right. Instead, QE does little but to encourage yield-seeking speculation that temporarily enhances the distribution of paper wealth toward the holders of risky securities. Still, turning this paper wealth into a claim on real output requires that existing holders cash out at those elevated valuations and pass the bag to someone else. Fortunately or unfortunately, the holders of risky assets have come to believe that elevated valuations are permanent and reliable, so as in 2000 and 2007, we expect the majority of holders to simply continue holding the bag as valuations retreat over the completion of the market cycle. Technically, most holders will have to, because the ability to exit at current prices requires some new buyer to take the bag. My impression is that the sideways churning we've observed in the broad market since last July (see the NYSE Composite for example) has represented just that sort of "distribution" process. One might like to imagine that valuations are fine because corporate profits and profit margins have been at record levels in recent years. But this ignores that the source of that corporate surplus has been an unusual set of deficits in the government and household sectors, which have persisted for several years, but are already narrowing, and are unlikely to persist for five decades. When one recognizes that stocks are 50-year duration assets, and are a claim on decades of future cash flows (not just next year’s earnings, or even the next 3-5 years), it should be clear why the most historically reliable valuation measures, by far, are those that adjust for variations in profit margins over the economic cycle (see Margins, Multiples, and the Iron Law of Valuation). Valuation measures that mute the year-to-year volatility of profit margins and earnings typically have the strongest correlation with actual subsequent S&P 500 total returns over the following 7-10 year period. The following chart shows the inverted ratio of market capitalization to GDP (left scale, log – lower levels represent richer valuation) compared with the actual subsequent 10-year total return of the S&P 500 (right scale). As I’ve frequently noted, periodic “errors” between actual 10-year returns and those that would have been projected a decade earlier are actually highly informative about current valuations (see Do the Lessons of History No Longer Apply?). Market capitalization to GDP (one of the best stock/flow valuation indicators, in terms of predictive correlation) is quite close to the 2000 extreme, while Tobin’s Q is somewhat less extreme because corporate net worth is increasingly dominated by financial assets that boost the denominator of Q during periods of overvaluation. Regardless of which measure one uses, however, U.S. equity valuations are on the high side of obscene. Everything we observe from reliable valuation measures indicates that the S&P 500 Index is likely to be lower a decade from now than it is today, though based on a broad range of reliable measures, we currently expect the total nominal return, including dividends, to be slightly positive at about 1.6% annually.
Creating a more vulnerable financial system As indicated above, when we examine both the net worth of U.S. corporations and the net worth of U.S. households, both have become gradually dominated by paper assets instead of real ones. This is of significant economic concern. Financial assets now represent over 82% of the net worth of both households and U.S. non-financial corporations (Data: Federal Reserve Z.1 Flow of Funds). Except for periods where total net worth had itself retreated (for example, 2008-2010), the concentration of private net worth on financial assets, rather than real assets or productive capital, has reached the highest extreme in history in recent years. In our view, this is just temporarily overvalued paper masquerading as something durable. The previous extreme – again, outside of periods where net worth itself had retreated – was not surprisingly in Q1 of 2000. We are rather helpless observers to this, as we were prior to the last financial crisis, and as we were prior to the technology collapse – despite the same conviction each time that the imbalances and elevated valuations would end badly. There a strong correlation between private net worth and U.S. market capitalization. Examining the data, we find that the change in private net worth per dollar of change in U.S. market cap is actually about 1.5. That means that stocks have not only a direct impact on total private net worth, but an indirect effect, as many privately held assets such as corporate debt and junk bonds are also correlated with stock price fluctuations. At about $30 trillion in U.S. non-financial and financial equity market capitalization, and over $100 trillion in total U.S. private net worth, a standard, run-of-the mill bear market decline in stocks on the order about 22% would likely be associated with total paper losses in the private sector on the order of $10 trillion. Clearly, a larger loss would result from a deeper market retreat. [The original version of this comment estimated losses based only on non-financial equities. The estimate is corrected above by including financial equities in U.S. market capitalization - JPH]. Meanwhile, much has been made about “cash on the sidelines” held by corporations, where the sum of currency, bank deposits and foreign deposits of U.S. nonfinancial corporations has surged by $700 billion since 2008. What’s typically left out of this observation is that the debt of those same corporations has surged by $1.5 trillion over the same period. As my friend Albert Edwards and his colleagues have demonstrated, much of this debt issuance has been used to finance stock repurchases instead of expanding investments in productive capital. While this process may feel right in an environment of low interest rates and a belief in permanently rising stock prices, it has made corporate balance sheets much more vulnerable to debt refinancing risk down the road, particularly if earnings fall short or credit spreads rise as they have in prior cycles. Of permabears and permabulls People often like the idea of being part of an exclusive club, sometimes the more exclusive the better. As Groucho Marx put it, “I’d never join a club that would have me as a member.” With the percentage of bearish investment advisors recently plunging to just 14%, investment bears are certainly a rather exclusive group, mostly representing advisors who are considered “permabears.” What’s odd is how little affinity I feel with members of that group. Though I seem to be one of the better-identified members, those who actually understand our narrative in recent years should recognize that I stumbled into this clubhouse quite unintentionally. The fact is that I’ve become constructive or aggressively bullish after each bear market retreat in the past quarter century. The main difficulty began with my 2009 insistence on stress-testing our methods against Depression-era data, which cut short our late-2008 turn to the constructive side (see Why Warren Buffett is Right and Why Nobody Cares). I continue to view that decision as a fiduciary necessity (as 2009-like valuations were followed, in the Depression, by another two-thirds loss in the market), but it was unfortunately timed. In hindsight, I wish I could have made that decision in 2007, when we became convinced of an impending collapse in the first place. Our awkward transition in the period from 2009 to mid-2014 had a great deal to do with knock-on effects from that stress-testing decision. The full narrative is readily available. See in particular Hard Won Lessons and the Bird in the Hand, and A Better Lesson than “This Time is Different.” Still, ask the following question: Under what conditions have we been notably out of sync with the market for an extended period of time? The answer is simple: when valuations were elevated on a historical basis, but when both the uniformity of market internals and the behavior of credit spreads were still measurably favorable. Have we addressed that distinction in our present methods? Yes. Ask the following question: Under what conditions have we been most correct in expecting wicked market losses? The answer again is simple: when valuations were rich and market conditions were overbought and overbullish, but when the uniformity of market internals and/or the behavior of credit spreads had also become unfavorable on our measures. Ask the following question: Under what conditions have we been most correct about an aggressive outlook (as I encouraged after the 1990 bear market low, which helped to establish my reputation as a “lonely raging bull” earlier in my career) or constructive outlook (as I encouraged after the 2000-2002 collapse)? The answer is simple: when valuations had materially retreated and the uniformity of market internals and the behavior of credit spreads had become measurably favorable. My hope is that the pattern is clear. For more on that central lesson, which was embedded in our pre-2009 methods, was not sufficiently captured in the methods that resulted from our 2009-2010 stress testing, and – after a challenging transition – are again embedded in our present methods of estimating market return/risk profiles, see A Most Important Distinction. There is a problem with both permabears (among whom I feel decidedly misclassified) and permabulls (who would never call themselves that, preferring instead to extol the virtues of buy-and-hold, but who rarely advise investors to consider their investment horizon and risk tolerance, or to temper their expectations about future returns when valuations are elevated). The problem is that the evidence and analysis presented by each side is typically so darned thin. One would think that credible investment outlooks should be based on a healthy dose of historical evidence and clear explanation of economic and accounting relationships that lead to a particular conclusion. Instead, both permabulls and permabears tend to cite statistics of various sorts without demonstrating that they have any systematic relationship with actual subsequent market returns. My sense is that those who casually dismiss historically reliable evidence by appealing to our awkward transition – despite having admitted, addressed, and explained the challenges and lessons of that period – are likely to experience outcomes similar to those investors experienced following similar conditions in 1929, 1937, 1972, 1987, 2000 and 2007. If market internals and credit spreads improve, our immediate concerns about downside risks will be deferred. As I’ve emphasized in recent months, that won’t make obscene valuations any less extreme, but that sort of shift in market action would be indicative of a shift toward fresh risk-seeking by investors, and would encourage an investment outlook that might best be characterized as “constructive with a safety net.” Meanwhile, the S&P 500 has posted annual nominal total returns of less than 4% annually since 2000, has posted those returns only because of a return to historically extreme valuations and recent record highs, and has lost half of its value on two separate occasions in the interim. To the extent that one was to choose to be a permabear, this would still be one of the best 15-year periods in history to have done so. I expect that by the completion of the present market cycle, most likely over the next couple of years, the period since 2000 will turn out to be uniquely the best span in history since the Great Depression to have been a “permabear” anyway. As always, our investment horizon is focused on the complete market cycle. We have no intent of dissuading disciplined buy-and-hold investors from their discipline, but only encourage that you ensure your overall portfolio allocation is consistent with your investment horizon and actual risk tolerance (which you should test by asking whether a bear market loss on the order of 30-55%, commensurate with current evidence and historical precedent, would disrupt your financial security enough to force you to abandon your discipline after the fact). Provided that you’re well diversified in assets that aren’t actually highly correlated, and you’ve carefully considered your investment horizon and risk tolerance, we fully encourage adhering to patient and historically informed disciplines – even if we might disagree about when the present market cycle may be completed.The foregoing comments represent the general investment analysis and economic views of the Advisor, and are provided solely for the purpose of information, instruction and discourse. Please see periodic remarks on the Fund Notes and Commentary page for discussion relating specifically to the Hussman Funds and the investment positions of the Funds. --- The foregoing comments represent the general investment analysis and economic views of the Advisor, and are provided solely for the purpose of information, instruction and discourse. Prospectuses for the Hussman Strategic Growth Fund, the Hussman Strategic Total Return Fund, the Hussman Strategic International Fund, and the Hussman Strategic Dividend Value Fund, as well as Fund reports and other information, are available by clicking "The Funds" menu button from any page of this website. |
|||||||||||||||||||||||||
|
For more information about investing in the Hussman Funds, please call us at
1-800-HUSSMAN (1-800-487-7626) 513-326-3551 outside the United States Site and site contents © copyright Hussman Funds. Brief quotations including attribution and a direct link to this site (www.hussmanfunds.com) are authorized. All other rights reserved and actively enforced. Extensive or unattributed reproduction of text or research findings are violations of copyright law. Site design by 1WebsiteDesigners. |