|
|
||||||
|
|

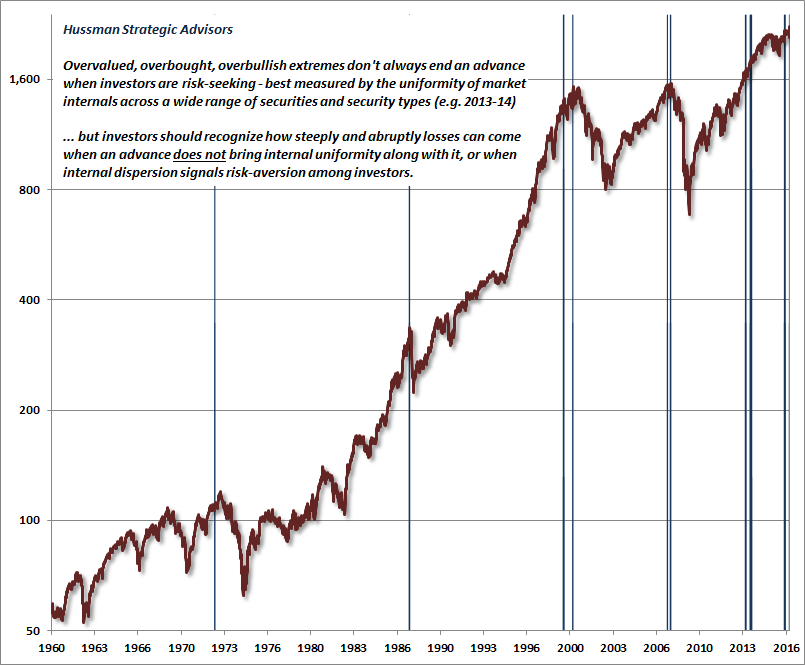
December 12, 2016 Economic Fancies and Basic Arithmetic The single most extreme syndrome of “overvalued, overbought, overbullish” conditions we identify (see Speculative Extremes and Historically Informed Optimism) was restored last week; a secondary signal at a level on the S&P 500 that’s 4% higher than the syndrome we observed in July. Recall that with one exception, that most extreme variant has only emerged at the market peaks preceding the worst collapses in the past century. Prior to the advance of recent years, the list of these instances was: August 1929, the week of the bull market peak; August 1972, after which the S&P 500 would advance about 7% by year-end, and then drop by half; August 1987, the week of the bull market peak; July 1999, just before an abrupt 12% market correction, with a secondary signal in March 2000, the week of the final market peak; and July 2007, within a few points of the final peak in the S&P 500, with a secondary signal in October 2007, the week of that bull final market peak. The single exception was a set of signals between late-2013 and early-2014. While we’ve learned not to fight “overvalued, overbought, overbullish” extremes in zero-interest rate environments where market internals are uniformly favorable, we presently observe a situation much like the final peaks of the 1929, 1972, 1987, 2000 and 2007 bull markets, when those mitigating factors were not in place.
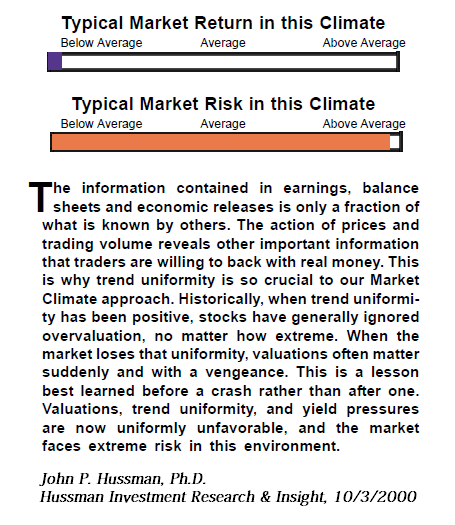
Our long-term and full-cycle views remain solidly negative, but our views regarding shorter segments of the market cycle are more flexible than investors may imagine. Our near-term outlook continues to be dependent on the risk-preferences of investors. The best measure of those preferences is the behavior of market internals across a wide variety of securities, industries, sectors, and security types, because when investors are risk-seeking, they tend to be indiscriminate about it. Presently, market conditions are most consistent with a “blowoff” to complete the extended top-formation of the third financial bubble in 16 years. However, an improvement in market internals would encourage us to give a longer leash to this speculation, and we will align our outlook as conditions change. Drawing the right lesson Prior market peaks across history had a key regularity: the emergence of extreme “overvalued, overbought, overbullish” syndromes was regularly accompanied or immediately followed by deterioration in market internals, so those syndromes alone were enough to warrant a hard-negative market outlook. Our difficult experience in the recent half-cycle resulted from my insistence in 2009 on stress-testing our methods against Depression-era data, because the resulting methods of classifying market return/risk profiles picked up that historical regularity. Our defensive response to persistently overvalued, overbought, overbullish conditions turned out to be our Achilles Heel in the face of QE. The central lesson was not that overvalued, overbought, overbullish extremes are irrelevant, but that in the face of zero-interest rates, one had to wait for market internals to deteriorate explicitly before adopting a hard-negative outlook. We adapted our approach in mid-2014 to address that issue, which is why we’re keenly focused on market internals here (see the “Box” in The Next Big Short for the full narrative). Be careful to draw the correct lesson. It’s not that obscene valuations or syndromes of extremely overextended conditions are irrelevant for long-term and full-cycle market outcomes; it’s that the uniformity or divergence of market internals is critical in evaluating shorter segments of the market cycle. Put simply, what concerns us most here is the fact that we’re observing extreme overvalued, overbought, overbullish conditions in combination with unfavorable market internals on our measures, including yield pressures across interest-sensitive securities. While our short-term outlook may shift with changes in the quality of market action, the long-term and full-cycle market outlook, in our view, is unavoidably disastrous. We’ve long argued, and continue to assert, that the most historically reliable measures of market valuation are far beyond double their historical norms. At current market levels, our estimate for 12-year S&P 500 average nominal total returns has collapsed to just 0.8% annually. Among the valuation measures most tightly correlated across history with actual subsequent S&P 500 total returns, the ratio of market capitalization to corporate gross value added would now have to retreat by nearly 60% simply to reach its pre-bubble average. Again, we’re open to the possibility that internals could improve enough to signal more extended potential for speculative risk-seeking. As conditions stand today, they mirror those I emphasized just prior to the market losing half or more of its value. The following clip is from my October 2000 research comment.
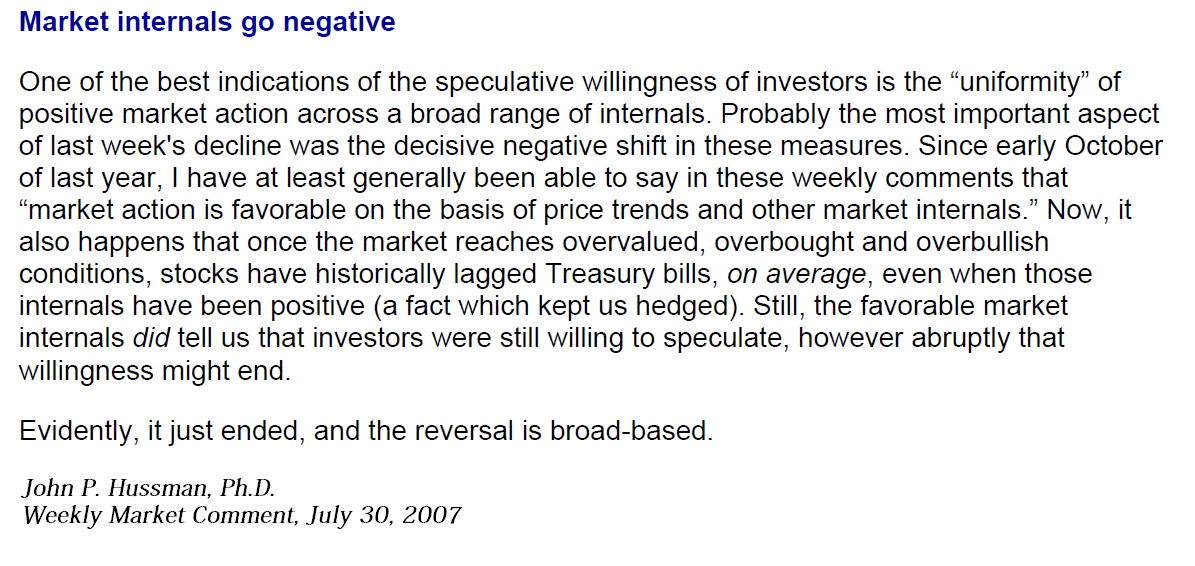
I expressed similar concerns in late-July 2007. While the S&P 500 peaked a few points higher in October of that year, the overall top-formation was followed by a 55% market collapse. Needless to say, we don’t’ take present conditions lightly, but an improvement in market internals (particularly across interest-sensitive sectors) would shift our near-term views to a much more neutral stance.
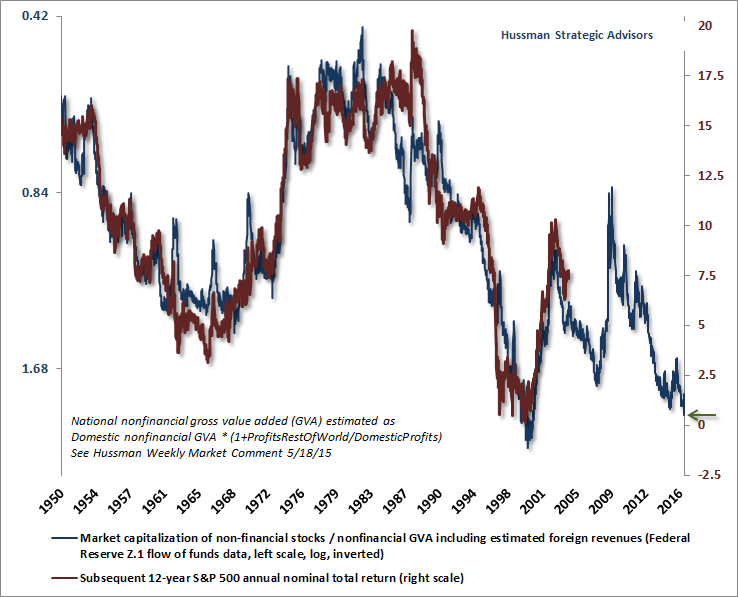
I recognize how excruciating it feels not to participate in what seems like a relentless vertical advance. That’s particularly true for hedged-equity strategies when the environment features dispersion across market internals, as it has during this extended top-formation. That’s because even moderate tracking differences between a broad portfolio of individual stocks and the market indices used to hedge them can create unpredictability over shorter segments of the market cycle. Since July 2014, for example, the broad NYSE Composite Index has gone nowhere, while the S&P 500 Index is up nearly 14% (if only temporarily). As for me, nearly everything I have remains confidently invested across our own disciplines. Confidently, because 1) we know exactly how our present methods, as well as our pre-2009 methods, have navigated complete market cycles across history, and in real-time prior to this half-cycle, and 2) taking both our present and pre-2009 methods to data from recent years, we also know the “counterfactual” - how our discipline could have navigated the markets since 2009, had my stress-testing decision not bared the Achilles Heel that we addressed in 2014. Speculative recklessness is easier to watch, and even live through, when one is able to maintain a historically-informed, full-cycle perspective. While our near-term views are flexible to changes in market action, that full-cycle market perspective is also critical. The late stage of a half market cycle can encourage investors to do foolish things. Even if market internals improve, there should be no operating without a substantial safety net here (ideally using options, rather than one that relies on stop-loss execution). The market may or may not have precisely completed the advancing half of what is now the third most extreme speculative bubble in history. Yet the repeated lesson of history is that once the market cycle is complete, investors will damn themselves for imagining that chasing the last gasp of the bubble was worth the losses that followed. Valuation Update From a long-term and full-cycle perspective, we have strong, historically-informed expectations that the S&P 500 will enjoy total returns of next-to-nothing over the coming 10-12 years, with interim losses over the completion of this cycle that we now estimate in the range of 50-60%. This would not be a worst-case scenario, but only a run-of-the-mill cycle completion from the standpoint of current valuation extremes. We expect that every bit of gain investors may enjoy over the near-term will be surrendered over the completion of this cycle. Indeed, we expect that the completion of the current cycle will wipe out the entire total return of the S&P 500 since 2000. None of that would even require the most historically reliable valuation measures to break below their pre-bubble norms. The chart below shows the ratio of nonfinancial market capitalization to corporate gross value added, including estimated foreign revenues (MarketCap/GVA). The only point in history where valuations were higher and stocks were still in a bull market was between December 1999 and March 2000. To put this into perspective, between the point in December 1999 that valuations reached levels equal to the present, to the subsequent market low in October 2002, the S&P 500 lost 46%. From the actual bull market peak in March 2000 to the subsequent market low in October 2002, the S&P 500 lost 49%. Not much difference. Meanwhile, although the S&P 500 gained nearly 7% between December 1999 and March 2000, the index also experienced an intervening loss of over 9%. Whether or not we’re seeing the final highs here, expect market action to become substantially more volatile.
The following chart shows the same data on an inverted log scale (blue line, left), along with the actual subsequent 12-year nominal average annual total return of the S&P 500 Index (red line, right). Present levels are consistent with 12-year S&P 500 total returns averaging less than 1% annually. There is not a single measure we’ve identified across history that has a stronger correlation with actual subsequent market returns, though several similarly accurate measures have comparable implications. Before investors base their expectations on someone’s assertion that stocks are “cheap” or “reasonable” based on one measure or another, they should demand similar long-term evidence that the measure is actually strongly correlated with subsequent market outcomes.
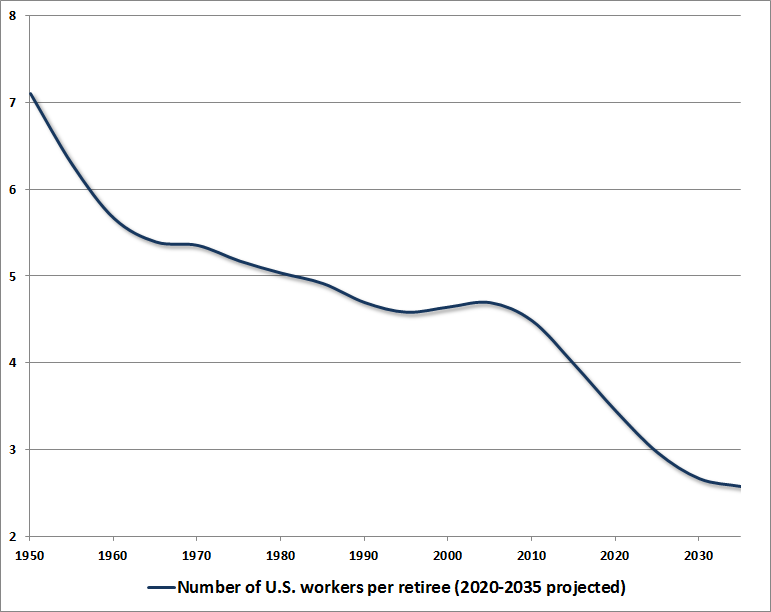
In summary, the key to understanding the current market environment is to explicitly make a distinction between 1) the long-term and full-cycle market outlook, which is primarily driven by valuations, and 2) the near-term outlook for the current “segment” of the market cycle, which is primarily driven by the risk preferences of investors. For now, we’re still very much in the “blowoff” camp, but those market internals remain critical. If the speculative bubbles and crashes across market history have taught us anything (particularly the repeated episodes of recklessness we’ve observed over the past two decades), it’s this: regardless of the level of valuation at any point in time, we have to allow for the potential for investors to adopt a psychological preference toward risk-seeking speculation, and no amount of reason will dissuade them even when that speculation has already made a collapse inevitable over a longer horizon. The best we can do is to continuously align ourselves with the market conditions we observe at each point in time. Despite what we view as obscene valuations, a moderate further improvement in market action (particularly across market internals and interest-sensitive assets) would at least remove our inclination to maintain a hard-negative market outlook, and would move us instead to a neutral view (with material pullbacks then creating the potential for stances that might be described as “constructive with a safety net”). Again, uniformly favorable market internals would signal a potentially extended shift in risk-seeking preferences among investors, and while we need not join such speculation, we also should not fight it if it emerges. There’s no need to make forecasts about near-term outcomes. We only need to align ourselves with prevailing conditions as they emerge. Presently, wicked valuations are coupled with still-unfavorable market internals on our measures, and have now been joined by the most extreme “overvalued, overbought, overbullish” syndrome of conditions we identify. The same combination prevailed at the 1929, 1972, 1987, 2000, and 2007 market peaks. Still, we’re quite aware that investor preferences might shift more durably, and we can accommodate that potential by monitoring those preferences through the market action that they generate. For now, market conditions remain consistent with the speculative “blowoff” of an extreme late-stage bubble peak. Economic fancies and basic arithmetic The past several weeks have brought an enormous amount of loose economic analysis encouraging investors to expect a meaningful surge in economic growth and corporate profits. Most of this hope rests on projections of higher deficit spending and increased domestic investment. It might benefit investors to consider these arguments more closely, and with greater focus on a century of economic evidence than on the verbal arguments of enthusiastic talking heads. While there is a strong correlation between growth in gross domestic investment and growth in real GDP, the slope of that relationship is only about 0.2, meaning that even if the growth rate of real gross domestic investment was driven from the recent growth trend of zero all the way back to the previous post-war growth rate of 3.5%, the overall impact on real GDP growth would only be about 0.7% annually, placing the level of U.S. real GDP about 2.8% higher 4 years from today than it would otherwise be. That’s not an annual growth rate, but a cumulative gain. Granted, if even a 0.7% boost to annual GDP growth was sustained, it would have a major impact on long-term living standards over a 20-30 year period. But investors have a screw loose if they believe that the overall prospects for GDP growth over the coming 4 years have changed significantly. Let’s do some arithmetic here. The primary determinants of GDP growth over time are 1) growth in total employment plus 2) growth in real output per hours worked. There’s a little bit of cyclical variation due to changes in average hours worked, but that difference only shows up meaningfully during recessions. In practice, nearly all of the variation in GDP growth over time is explained by the sum of employment growth plus productivity growth. Let’s look at each. Employment growth As of November 2016, U.S. civilian employment stood at 152.1 million jobs, with a civilian labor force of 159.5 million people, resulting in a 4.6% unemployment rate. By 2024, the Bureau of Labor Statistics projects the U.S. labor force to reach 163.8 million. Given existing U.S. demographics, even if we assume an unemployment rate in 2024 of just 4%, civilian employment would reach 157.2 million jobs in 2024, resulting in an average annual growth rate for civilian employment of just 0.4% annually over the coming 8 years. Conversely, a return to an unemployment rate of even 6% in 2024 would leave the growth rate of employment over the next 8 years at less than 0.2% annually. While the assumptions about the future unemployment rate may be affected by policy, the fact is that slower U.S. population growth, coupled with an aging population, place substantial limits on labor force growth, which will leave U.S. GDP growth almost entirely dependent on changes in productivity. The Bureau of Labor Statistics notes that “as the population ages, more workers will enter older age cohorts, which have lower participation rates. This will cause the projected overall participation rate to decline. This slower population growth, combined with the declining participation rate, will result in slower growth in the labor force through 2024.” From a demographic perspective, the number of U.S. workers per retiree has been progressively declining, from more than 7 workers per retiree in the 1950’s, to 4 workers per retiree today. Over the next 20 years, that figure will decline to an estimated 2.5 U.S. workers per retiree by 2035. The BLS observes “The leading edge of the baby boomers (those born in 1946) became eligible for early Social Security benefits at age 62 in 2008 and reached full retirement age at 66 in 2012. In 2024, the baby-boom cohort will be ages 60 to 78, and a large number will already have exited the labor force. During the 2014-24 period, the growth of the labor force will be due entirely to population growth, as the overall labor force participation rate is expected to decrease even further by 2024.” That means that there will be more claims against the output of U.S. workers than ever before.
Sure, you can devalue those claims through inflation, but only if the debt is in the form of long-maturity bonds (which is why the recent discussion of issuing 50-100 year Treasury bonds seems understandable but also a bit nefarious). At shorter maturities, inflation just raises the interest rate that the government has to pay when the shorter-term debt is rolled over. Though the weighted-average maturity of Treasury debt is currently longer than normal, the average is still only 5.8 years, and half of the debt will have to be rolled over by 2019, at whatever interest rates emerge in the interim. Ultimately, debt implies a future transfer of purchasing power, and provides only a few choices. Either you raise adequate tax revenue, or you denominate the debt in long-term bonds and devalue them through inflation, or you default, or you violate the social contract made with those who don't hold paper claims (e.g. Social Security beneficiaries) in preference for those who do. Had the borrowing resulted in productive investment, future output would be easily available to meet those claims. Instead, what’s going on is a quiet dilution of future living standards. That’s only going to be reversed by thoughtful policies, focused more on long-term productivity than near-term gains. Even massive debt-financed spending will not help unless the projects are intentionally designed to durably enhance the long-term productivity of the U.S. economy, to avoid duplicative capacity, and to relieve constraints that threaten to become binding in the future (personally, I remain convinced that renewable energy should be central to that list). Productivity growth Let’s look at that second piece of the growth puzzle, which is productivity growth. Decades of financial distortion and malinvestment have had cumulative effects that can only be reversed by decades of productive capital accumulation. It’s here where Wall Street’s exuberance is most evident. Even assuming massive and productive new spending initiatives were financed by increasing the existing $930 billion annual deficit that is now being run across federal, state and local government (the federal deficit currently accounts for about $430 billion of that annually), the impact over a small number of years would be quite limited as a percentage of GDP. The differences in growth that actually matter are those that only become significant over decades. Since the 1940’s, the 8-year growth rate of U.S. labor force productivity has rarely exceeded 3%, and the recent trend has been progressively lower. Over the past decade, productivity growth has declined from a post-war average of 2% to a growth rate of just 1% annually, with growth of just 0.5% annually over the past 5 years. The gap between dismal productivity and the most productive economic environment in U.S. history is only about 2.5% annually. If one studies the productivity figures, there have actually been two peaks in U.S. productivity growth during the post-war period. One was in the decade leading up to the late-1960’s, which was driven by a legitimate expansion in the productivity of U.S. workers, as measured the capacity of labor to produce output. This was something of a “golden age” for the U.S. in terms of improved living standards. There was a second, lesser peak in the decade leading up to 2003. But the reason for that surge in “productivity” was much different. As I detailed in my November 2003 comment, titled The U.S. Productivity Miracle (Made in China), part of U.S. productivity growth actually represents the import of foreign labor by U.S. multinational companies. A significant portion of what we "import" from foreign countries actually represents intermediate goods produced by foreign affiliates of U.S. companies, which we incorporate into our final output. But we don't count those foreign jobs when we calculate productivity (and the deduction to GDP on account of imports is generally smaller than the corresponding loss of U.S. employment), so foreign outsourcing has the effect of boosting measured productivity. As a result, I observed at the time that most of the productivity "miracle" in the decade leading up to 2003 could be explained by import growth in excess of consumption growth: “Import growth captures both the 'true' part of productivity growth (since increased capital investment typically requires an expanding current account deficit) as well as the illusory part of productivity growth (resulting from the failure to account for foreign labor input in the productivity numbers). In both cases, it is misplaced optimism to expect rapid and sustained growth in U.S. productivity when the U.S. current account is already at a record deficit.” Measured U.S. productivity, not surprisingly, has collapsed since then, and while the current account (essentially the U.S. trade balance) has narrowed as a fraction of GDP, it remains substantially negative. The plausible range of potential GDP growth Rapid economic growth, then, typically involves two conditions. On the employment side, it generally begins from an elevated unemployment rate, because a great deal of labor slack enables sustained growth in employment. On the productivity side, strong economic growth typically begins from points where the U.S. current account is balanced or in surplus. That's partially because growth in real domestic investment is almost always associated with an expanding trade deficit (a regularity of the savings-investment identity - see Eating Our Seed Corn for more on this), and also because import growth drives other aspects of measured productivity growth, as explained above. Given present conditions, the range of potential GDP growth rates over the coming 4-8 year period is much more constrained than investors may recognize.
Combining the plausible ranges of employment and productivity growth in the coming years (but ignoring the possibility of outright recession), the bounds of average U.S. economic growth over the coming 8 years range between 0.7% annually to an extremely optimistic 3.2% annually, with a likely midpoint of less than 2% annually for real GDP. That figure aligns with the central tendency of long-run real GDP growth expectations from the Federal Reserve, which recently fell to 1.85% annually. Look, one of my strongest economic views is that the U.S. absolutely requires a greater focus on encouraging productive investment at every level of the economy (see in particular Eating our Seed Corn and Judging Economic Policy). If our economy could grow even 1% faster over a 20-year period, the resulting 20% boost to future living standards would be an extraordinary long-term achievement. But this idea that the new administration will produce some near-term economic renaissance amounting to more than a few percent in cumulative output gains in the coming years reflects a breathtaking lack of historically-informed perspective, not to mention the inability to add two numbers together. The problem is that even the most wildly optimistic prospects for incremental economic growth are likely to leave the level of real GDP no more than 10% higher, 4 years from now, than it otherwise would be. I strongly doubt we’ll see even that much incremental growth. On the impact of policy If anything, my expectation is that the policies of the incoming administration are more likely to result in constrained economic growth rather than expansion. On the labor front, there’s not a great deal that can be done about the demographics of an aging population, but with regard to incremental changes, it would appear better to ease the projected constraints through immigration, particularly favoring workers inclined to address the needs of that aging population (e.g. personal services and low-intensity health care). As for other industries, I’ve observed before that infrastructure projects on the scale of those being discussed would actually have to be implemented with foreign labor (as many of the largest U.S. construction projects have been in recent years), since heavy construction workers represent a rather small segment of the U.S. labor force. Heightened barriers to immigration will tend to tighten existing demographic constraints on the employment component of U.S. GDP growth. Meanwhile, on the productivity front, U.S. parent companies with foreign affiliates currently employ more than one foreign worker for every two U.S. workers. The main function of those foreign workers is to expand foreign sales rather than to cut costs by replacing U.S. jobs, but some of the output produced abroad is in the form of intermediate goods that are imported into the U.S. and show up as part of our “final output.” The result is a boost to our measured productivity. Free trade has clear gains for U.S. consumers, and also benefits companies that shift jobs overseas, but there does seem to be a tendency for workers in both countries to receive an inequitable share of these gains. That said, to the extent that the incoming administration takes a punitive approach to foreign outsourcing and free trade more generally, my expectation is that it will also restrain the productivity component of U.S. GDP growth. Let's be clear. The economic gains and market returns that emerged during the Reagan Administration began from a starting point of 10.8% unemployment, a current account surplus, and market valuations that - on the most historically reliable measures - were less than one-quarter of present levels. However one views Reagan's overall legacy, he also led by setting an example of personal dignity and an abiding optimism that encouraged the good in others. The present situation shares none of those features. Instead, the arithmetic of economic expansion - employment growth plus productivity growth - is already constrained by a 4.6% unemployment rate and a deficit on current account, and seems unlikely to be helped by the current policy direction, aside from rather short-lived effects. Meanwhile, the proposed Cabinet more resembles a self-advocacy group for billionaires, corporations and war-advocates than a team of informed and civic-minded policy-makers. My increasing concern is that we won’t see much from the incoming administration that doesn’t involve intimidation, misuse of power, self-dealing, and attempts to use discretionary edict - as a substitute for equal protection and legislative process. We already observe glimpses of that, which deserve attention regardless of one's political views. There are certainly areas of desperation, including unemployment among minority youth and individuals with disabilities, but at the current unemployment rate of 4.6%, my impression is that the "jobs crisis" in this country is actually better described as an income crisis, because wages and salaries as a share of total income remain near record lows. An administration comprised of corporate billionaires isn't likely to change that. Higher productivity growth, sustained over a few decades, would have a profound impact on future living standards, but to expect an economic boom of anything but the short-lived variety is to rely on arithmetic that doesn't add up. In any event, the problem for investors is that whatever increment we could possibly observe in GDP growth pales in comparison to the fact that the most historically reliable market valuation measures are far more than double their historical norms. Even if investors expect economic growth and inflation to normalize, they’d better expect valuation measures to normalize as well. The tradeoff there is that extremely strong assumptions of higher growth, inflation approaching 4% annually, sustained record profit margins, and lower taxes might, at best, combine to push nominal earnings a cumulative 30% beyond their recent record highs over the next 4 years (which would be far beyond our actual expectations). But normalizing growth and inflation would also put pressure on valuation multiples to normalize, because current multiples rely almost entirely on a zero-interest rate world. Historical norms for the most reliable measures are less than half of present levels. The basic arithmetic is then: 1.3 x 0.5 = 0.65, which would still leave the S&P 500 35% lower by 2020. Put simply, the fanciful hopes for a near-term economic renaissance are vastly overstated, and are inconsistent with the basic arithmetic of economic growth. Moreover, even the most optimistic hopes for future growth, if realized, would only boost the trajectory of real U.S. GDP by a few percent over the course of the next four years. Any significant acceleration in nominal growth would have to come from inflation. For investors, the fact remains that the most historically reliable valuation measures remain far beyond double their historical norms, and a retreat in valuations over the completion of the present market cycle is likely to overwhelm any incremental economic growth that investors might expect.The foregoing comments represent the general investment analysis and economic views of the Advisor, and are provided solely for the purpose of information, instruction and discourse. Please see periodic remarks on the Fund Notes and Commentary page for discussion relating specifically to the Hussman Funds and the investment positions of the Funds. --- The foregoing comments represent the general investment analysis and economic views of the Advisor, and are provided solely for the purpose of information, instruction and discourse. Prospectuses for the Hussman Strategic Growth Fund, the Hussman Strategic Total Return Fund, the Hussman Strategic International Fund, and the Hussman Strategic Dividend Value Fund, as well as Fund reports and other information, are available by clicking "The Funds" menu button from any page of this website. |
|||||||||||||||||||||||||
|
For more information about investing in the Hussman Funds, please call us at
1-800-HUSSMAN (1-800-487-7626) 513-326-3551 outside the United States Site and site contents © copyright Hussman Funds. Brief quotations including attribution and a direct link to this site (www.hussmanfunds.com) are authorized. All other rights reserved and actively enforced. Extensive or unattributed reproduction of text or research findings are violations of copyright law. Site design by 1WebsiteDesigners. |