|
|
||||||
|
|

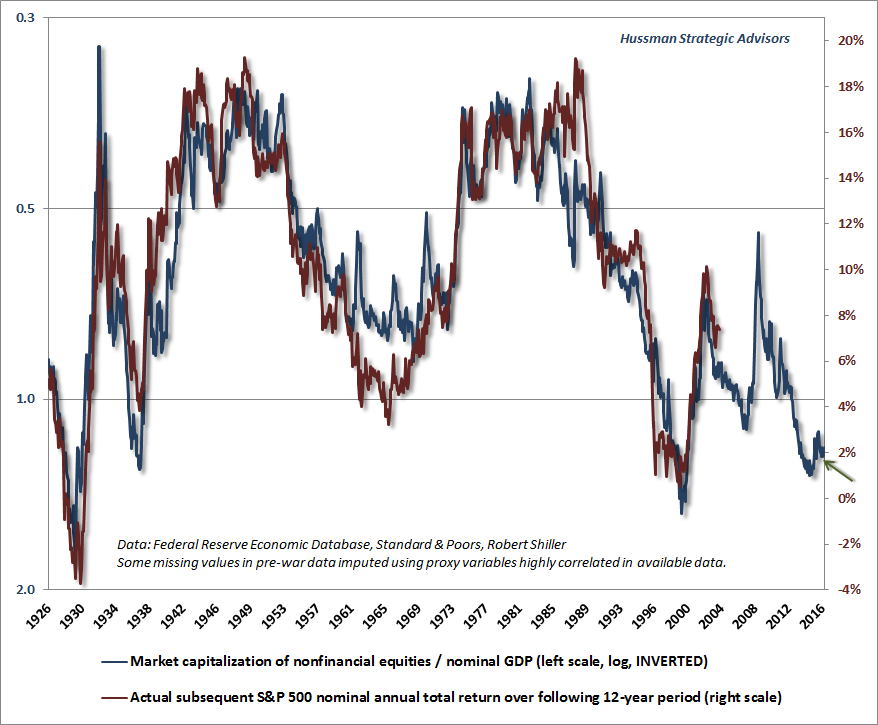
October 24, 2016 The Illusion that "Old Measures No Longer Apply" “The recent collapse is the climax, but not the end, of an exceptionally long, extensive and violent period of inflation in security prices and national, even world-wide, speculative fever. This is the longest period of practically uninterrupted rise in security prices in our history... The psychological illusion upon which it is based, though not essentially new, has been stronger and more widespread than has ever been the case in this country in the past. This illusion is summed up in the phrase ‘the new era.’ The phrase itself is not new. Every period of speculation rediscovers it... During every preceding period of stock speculation and subsequent collapse business conditions have been discussed in the same unrealistic fashion as in recent years. There has been the same widespread idea that in some miraculous way, endlessly elaborated but never actually defined, the fundamental conditions and requirements of progress and prosperity have changed, that old economic principles have been abrogated... and that the expansion of credit can have no end.” The Business Week, November 2, 1929 “The market will not go on a speculative rampage without some rationalization. But during any future boom some newly rediscovered virtuosity of the free enterprise system will be cited. It will be pointed out that people are justified in paying the present prices - indeed, almost any price - to have an equity position in the system. The newspapers, some of them, will speak harshly of those who think action might be in order. They will be called men of little faith.” John Kenneth Galbraith, The Great Crash, 1955 “The failure of the general market to decline during the past year despite its obvious vulnerability, as well as the emergence of new investment characteristics, has caused investors to believe that the U.S. has entered a new investment era to which the old guidelines no longer apply. Many have now come to believe that market risk is no longer a realistic consideration, while the risk of being underinvested or in cash and missing opportunities exceeds any other.” Barron’s Magazine, February 3, 1969. The S&P 500 had already started a bear market a few weeks earlier, which would take stocks down by more than one-third over the next 18 months. The S&P 500 Index would stand below its 1968 peak even 14 years later (with a real average annual total return of -3.4%, after inflation, over that period). “Old ways of valuing stocks are outdated. A technological revolution has created opportunities for continued low inflation, expanding profits and rising productivity. Thanks to these factors, the United States may be able to enjoy an extended period of expanding stock prices. Jumping out now would leave you poorer than you might become if you have some faith.” Los Angeles Times, May 11, 1999 In early 2000, the most reliable valuation measures we identify had reached extremes previously seen only at the 1929 peak, and were well beyond lesser extremes such as 1937, 1969, and 1972. At the time, I observed “the issue is no longer whether the current market resembles those preceding the 1929, 1969-70, 1973-74 and 1987 crashes. The issue is only - are conditions like October of 1929, or more like April? If the latter, then over the short-term, arrogant imprudence will continue to be mistaken for enlightened genius, while studied restraint will be mistaken for stubborn foolishness. The difficult part of all this is the short term. I have no answer for that, except that in each prior instance, every scrap of short term gain was wiped out in the eventual downturn. Let’s not be shy: regardless of short-term action, we ultimately expect the S&P 500 to fall by more than half, and the Nasdaq by two-thirds. Don’t scoff without reviewing history first.” As it happened, from March 2000 to October 2002, the S&P lost half of its value and the Nasdaq 100 lost 83%. In the 7 years from the 2000 peak to the 2007 market peak, the S&P 500 achieved an average annual total return of just 2.1%. In the 9 years following the 2000 peak, the S&P 500 not only lost all of its interim gains, but also fell -48% below that 2000 peak on a total return basis. It was not until August 2012 that the S&P 500 recovered to a zero total return as measured from the March 2000 peak, taking until April 2013 for the S&P 500 to manage a positive real total return after inflation. It has required the third speculative episode in 16 years for the S&P 500 to claw out even a 4% average annual total return from the 2000 peak. Unfortunately, given current valuation extremes, we fully expect the entire total return of the S&P 500 since 2000 to be wiped out over the completion of the present market cycle. That loss is likely to be an interim low on another journey to nowhere, ultimately leading the S&P 500 to an estimated total return averaging less than 1.5% annually over the coming 12-year period. There are certainly extended segments of history - even during the period since 2000 - when stocks have been rewarding investments; particularly measured from points where valuations were depressed to points where they became elevated. But to believe that stocks are a rewarding investment, regardless of valuation, is to ignore a century of history. I’ll pause here for an essential reminder. The central lesson of the QE-induced “everything bubble” was that, in the face of zero interest rates, even extreme syndromes of overvalued, overbought, overbullish conditions were not enough to reward a hard-negative market outlook (as they had been in prior cycles across history). Instead, the key adaptation was this: in the face of zero interest rates, one had to wait until market internals deteriorated explicitly, indicating a shift toward increasing risk-aversion among investors, before taking a hard-negative view (see the “Box” in The Next Big Short for a more detailed discussion). As I noted in Support Drops Away, our concerns about that "market action" component have substantially increased in recent weeks. Conversely, in the event that market internals improve meaningfully, our view would become more neutral, despite what we see as obscene valuations here. As I’ve regularly observed over time, the strongest market return/risk profiles typically emerge when a material retreat in valuations is joined by an early improvement in measures of market action. That combination would provide the best opportunity to expand market exposure. Despite our expectation that the present market cycle will be completed by a 40-55% loss, we have no requirement for that to occur as a prerequisite to taking a more constructive outlook. Instead, our classification of the market return/risk profile will shift as the observable evidence does. If we have any preference at all, it’s for a sufficiently larger range of market fluctuation to produce variations in the market return/risk classifications we identify, which would allow for greater variation in our market outlook. Looking for excuses In recent weeks, we’ve seen a flurry of articles along the lines that “old valuation measures don’t apply” and “old tried and true measures of risk no longer function.” As I’ve regularly noted, the only feature of the advancing half-cycle since 2009 that has been legitimately “different” from history is that QE encouraged speculation even after the emergence of “overvalued, overbought, overbullish” extremes that had reliably warned of losses in prior market cycles across history, so one had to wait until market internals deteriorated explicitly, indicating a shift toward increasing risk-aversion among investors. Beyond that, as should be evident from the chart below, there’s simply no evidence that the mapping between reliable valuation measures and long-term, full-cycle market outcomes has been altered one iota. The illusion that old measures no longer apply is identical to what we observed during the 2000 and 2007 top formations, and is identical to what we’ve observed at valuation extremes across history. What we’re seeing at present isn’t evidence that historically reliable measures don’t apply. Rather, we’re seeing investors looking for reassurance that the market would have collapsed by now if the risks were real, and impatiently second-guessing those measures so they will have an excuse to chase the bubble. The predictable outcome has been a flurry of new-era arguments that purport to show that historically reliable measures can be safely ignored. I’ve detailed our valuation concerns in prior comments during what is now a nearly two-year sideways top formation. See in particular Sizing Up the Bubble, Structural Growth and Dope Dealers on Speed-Dial (which discusses various adjustments to the Shiller P/E, though it’s not our favorite metric), and Blowing Bubbles: QE and the Iron Laws. While the ratio of non-financial market capitalization to corporate gross value-added is most strongly correlated with actual subsequent market returns in post-war data, the ratio of market cap to nominal GDP offers a longer perspective, and is presented below. The only points in history featuring similar valuation extremes were 1929, 1937, and 2000, all which were followed by market losses of 50% or greater. Of particular note lately is a “new era” argument that the level of MarketCap/GDP has shifted permanently higher, suggesting that elevated levels aren’t of concern, and that the standard-of-value has simply been raised. Be careful. The essential test of a hypothesis like this is to compare the valuation measure with actual subsequent market returns. In the case of MarketCap/GDP, what we find is that yes, the recent range of valuations has been higher, but as we observed after the 2000 and 2007 extremes, points of elevated valuation have been as predictably and reliably followed by poor subsequent returns as they have in market cycles across history. Put simply, it’s not valuation norms that have increased, but instead the willingness of investors to repeatedly chase stocks to valuation levels that remain associated with predictably dismal subsequent outcomes. In the chart below, MarketCap/GDP is shown in blue, on an inverted log scale (left), with actual subsequent 12-year S&P 500 annual total returns shown in red (right scale).
Notice that while the depressed valuation levels we observed in 2002 and 2009 (spikes in the blue line, since the scale is inverted) were accompanied by commensurately high subsequent returns, we should equally expect current valuation extremes to be accompanied by awful returns in the coming years. Based on a variety of reliable measures, we presently estimate S&P 500 nominal total returns averaging about 1.5% annually over the coming 12-year horizon, with severe interim losses along the way. Given that the S&P 500 dividend yield is slightly over 2% here, this also means that investors should expect the S&P 500 Index itself to be lower 10-12 years from now, compared with current levels. This only seems like an extreme statement to those who are unfamiliar with market history. The same outcome has repeatedly followed other periods of extreme valuation. Measured from the March 2009 low to the August 2016 peak in the S&P 500, the recent bull market has extended 7 years and 5 months, making the recent half-cycle not only the third longest advance, but the third most overvalued extreme in U.S. history. The recent peak also represents the single most extreme point of overvaluation in history on the basis of the median stock. The advance to the 2000 peak, at over 9 years in length, qualified as the longest bull market since the previous record of 8 years and 2 months established (ominously) in the 1921-1929 advance. Approaching that 2000 peak, I encouraged investors to look back on the lessons learned after the record 1921-1929 bull market, once the complete market cycle was over. One book stands out as a classic: Security Analysis - Principles and Techniques by Benjamin Graham & David L. Dodd, still considered the ‘bible” of fundamental investment analysis. The book was published in 1934, after the DJIA had lost 89.2% of its value. With the median stock more overvalued than at any point in history, with the most reliable capitalization-weighted measures at the highest extremes other than the 1929 and 2000 peaks, it’s useful for investors to recognize that the lesson of how this episode will end is already freely available. From Graham & Dodd: “One of the striking features of the past five years has been the domination of the financial scene by purely psychological elements. In previous bull markets the rise in stock prices remained in fairly close relationship with the improvement in business during the greater part of the cycle; it was only in its invariably short-lived culminating phase that quotations were forced to disproportionate heights by the unbridled optimism of the speculative contingent. But in the 1921-1929 cycle this ‘culminating phase’ lasted for years instead of for months, and it drew its support not from a group of speculators but from the entire financial community. “The ‘new-era’ doctrine - that ‘good’ stocks (or ‘blue chips’) were sound investments regardless of how high the price paid for them - was at bottom only a means for rationalizing under the title of ‘investment’ the well-nigh universal capitulation to the gambling fever... there emerged a companion theory that common stocks represented the most profitable and therefore the most desirable media for long-term investment. This gospel was based on a certain amount of research, showing that diversified lists of common stocks had regularly increased in value over stated intervals of time for many years past... An alluring corollary of this principle was that making money in the stock market was now the easiest thing in the world. It was only necessary to buy ‘good’ stocks, regardless of price, and then to let nature take her upward course. The results of such a doctrine could not fail to be tragic. “The notion that the desirability of a common stock was entirely independent of its prices seems incredibly absurd. Yet the new-era theory led directly to this thesis. If a stock was selling at 35 times the maximum recorded earnings, instead of 10 times its average earnings, which was the pre-boom standard, the conclusion to be drawn was not that the stock was now too high but merely that the standard of value had been raised. Instead of judging the market price by established standards of value, the new-era based its standards of value on the market price. Hence all upper limits disappeared, not only upon the price at which a stock could sell, but even upon the price at which it would deserve to sell. “But a rigid observance of old-time canons of commons-stock investment would have dictated the sale of one’s holdings at a substantial profit very early in the upswing and a historic abstinence from further participation in the market until at some point after the 1929 collapse when prices were again attractive in relation to earnings and other analytical factors.” For our part, we’re convinced that in the advances approaching the 1929, 2000 and recent market peak, an emphasis on market internals would have allowed for more extended participation despite rich valuations. Yes, in the advancing half-cycle since 2009, the historical tendency for stocks to lose value once extreme “overvalued, overbought, overbullish” syndromes emerged was deferred by the Federal Reserve’s zero-interest rate policy, which encouraged continued speculation even after those extremes were established. Yes, that extension of speculative conditions turned out to be our Achilles Heel in the recent half-cycle. Instead, one had to wait for market internals to deteriorate explicitly before taking a hard-negative market view. The problem for the equity market here is that a) even short-term rates of 10 basis points were enough to allow a near-20% market loss in 2011, and also that b) those measures of internals have now deteriorated clearly on our measures. Investors currently face the most hostile set of market conditions we identify across history: extended overvalued, overbought, overbullish extremes that are then joined by early deterioration in market action. These conditions are diametrically opposed to those that we associate with the most favorable market return/risk profiles. Ironically, the response of investors and pension funds to this long-toothed, overvalued, uncorrected bubble has increasingly been to abandon risk-managed approaches in favor of rear-view-mirror investment approaches that remain fully-invested in passive indices all the time. Look. Passive, value-insensitive strategies look glorious in hindsight precisely because the markets are in the extended top-formation of a speculative bubble. The subsequent future returns of such strategies, at least on a full-cycle and long-term horizon, always map directly to the level of valuation that investors accept, and are likely to be distressing in the coming 10-12 years. This expectation can be demonstrated in data across a century of history. In March 2000, I wrote “It can really seem like defensiveness is an enemy, and speculation is a friend. The same was true in the late 1960’s, when McGeorge Bundy of the Ford Foundation directed the managers of university endowments to become more aggressive: ‘We have the preliminary impression that over the long run, caution has cost our colleges and universities much more than imprudence or excessive risk-taking.’ In the plunge that followed, that preliminary impression turned out to be horribly incorrect.” Like in 2000, I can’t speak to short-term outcomes. The “unpleasant skew” that accompanies current conditions implies that the single most likely outcome in any given week is actually a small advance, but unfortunately, those advances are overwhelmed by less frequent but nearly vertical market collapses that can wipe out months of progress in a handful of sessions. As a result, the “mode” of the probability distribution is positive, but the average market return is strikingly negative. Investors experience this climate as seeming calm, punctuated by abrupt air-pockets, free-falls and crashes. In over 30 years as a professional investor, I’ve found nothing to tighten our “timing” of these events once an overvalued, overbought, overbullish extreme is joined by deteriorating market action. Part of an effective investment discipline is the ongoing research effort to look under every stone, and to insist on evidence rather than verbal arguments and data-free claims. We’ve openly and fully adapted to the features of the recent half-cycle that we’ve found to be legitimately “different” than other cycles. We continue to patiently adhere to that value-conscious, historically-informed, risk-managed discipline; open to new evidence, but not gullible in the face of old illusions that reappear at the peak of every speculative episode. Our views will change as the evidence shifts.The foregoing comments represent the general investment analysis and economic views of the Advisor, and are provided solely for the purpose of information, instruction and discourse. Please see periodic remarks on the Fund Notes and Commentary page for discussion relating specifically to the Hussman Funds and the investment positions of the Funds. --- The foregoing comments represent the general investment analysis and economic views of the Advisor, and are provided solely for the purpose of information, instruction and discourse. Prospectuses for the Hussman Strategic Growth Fund, the Hussman Strategic Total Return Fund, the Hussman Strategic International Fund, and the Hussman Strategic Dividend Value Fund, as well as Fund reports and other information, are available by clicking "The Funds" menu button from any page of this website. |
|||||||||||||||||||||||||
|
For more information about investing in the Hussman Funds, please call us at
1-800-HUSSMAN (1-800-487-7626) 513-326-3551 outside the United States Site and site contents © copyright Hussman Funds. Brief quotations including attribution and a direct link to this site (www.hussmanfunds.com) are authorized. All other rights reserved and actively enforced. Extensive or unattributed reproduction of text or research findings are violations of copyright law. Site design by 1WebsiteDesigners. |