|
|
||||||
|
|

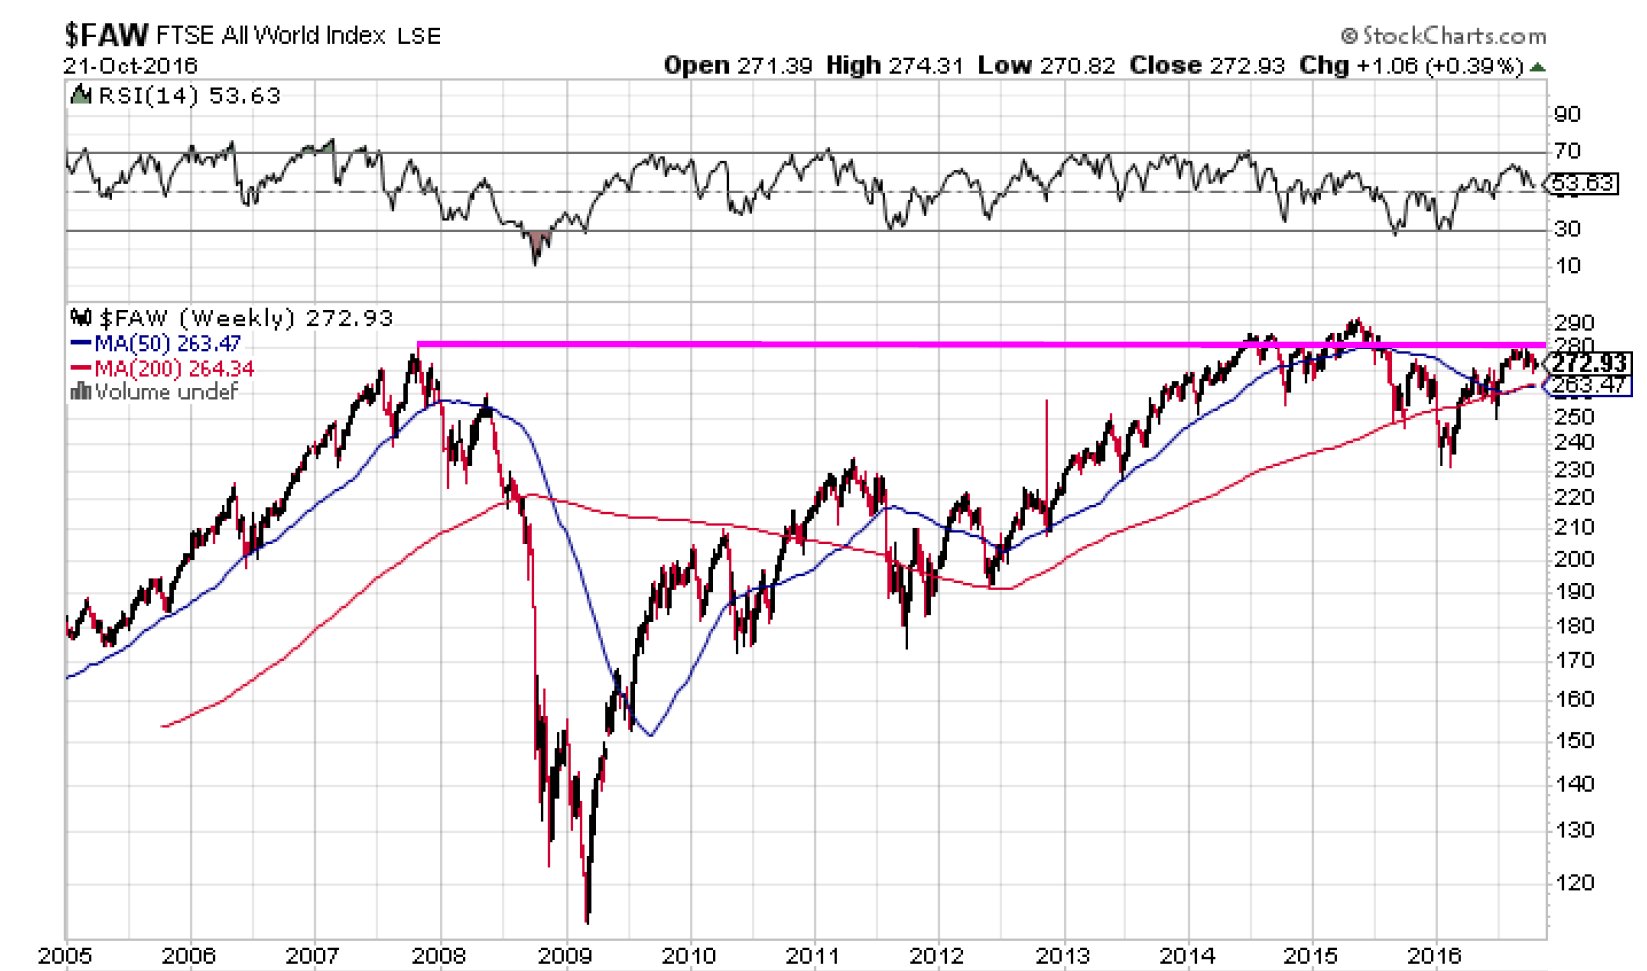
October 31, 2016 Far Beyond Double My continued impression is that the global equity markets broadly peaked in the second-quarter of 2015, and that the more recent marginal U.S. highs in August were a “throwover” in response to the post-Brexit plunge in global interest rates. High-yield credit is also rolling over, suggesting that the peak of yield-seeking speculation induced by central banks is probably behind us. That’s not to say that central banks will refrain from further attempts to compress yields in response to economic shortfalls. The problem is that even in a world where short-term rates remain compressed, the valuations and prospective long-term returns of risk-sensitive assets are already far outside the bounds that have historically delivered adequate risk-premiums. The chart below (h/t Jeff Sandene, Lance Roberts) shows the FTSE All-World Index, a capitalization-weighted index of large and mid-cap stocks in developed and developing countries, covering about 95% of global investable equity value. From a cyclical perspective, the action of the global markets this year may prove to be less a continuation of an ongoing bull market than a corrective rally in what is already an ongoing bear market.
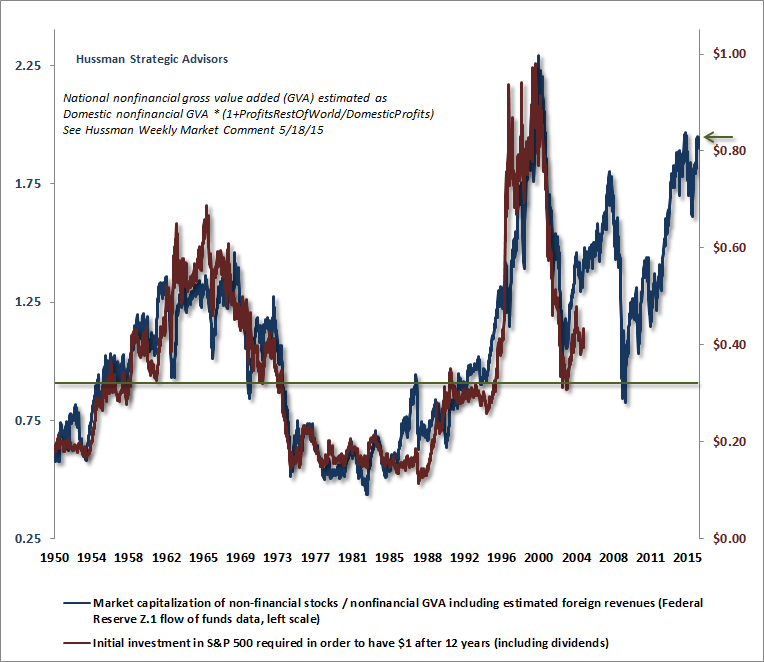
From our standpoint, we’re less concerned with the label of “bull” or “bear” market than we are with the classification of the market return/risk profile that we infer at any point in time, based on valuations, market action, and other factors. Presently, the expected market return/risk classification we identify is not only in the lowest quintile, but is among the most severely negative members of that quintile in history. These return/risk profiles are associated with “unpleasant skew” - a tendency toward modest market gains punctuated by near-vertical losses, producing a distribution with a positive “mode” but awfully negative average returns. See Impermanence and Full-Cycle Thinking for a chart of what this distribution looks like. I recognize it may seem like the current “permanently high plateau” in the market will never end, and that our market outlook will remain permanently unfavorable. On that note, it’s important to know that our current approach to classifying market return/risk profiles would encourage a constructive or leveraged investment stance across more than 70% of periods in market history, and reflecting the adaptations we introduced in mid-2014 (see the “Box” in The Next Big Short for details), more than half of periods since 2009 and even since 2000. In contrast, our current hard-negative outlook is associated with fewer than 20% of periods across history (see the chart in Calm Before the Storm to see how the S&P 500 has fared during this subset of market environments). Due to repeated episodes of extreme valuation in recent cycles, the hard-negative market return/risk profile we presently identify has prevailed more often than usual, comprising about 30% of periods since 2000, based on our current classification methods. Those periods since 2000 capture a cumulative -73% loss in the S&P 500, despite the absence of net losses over the past year. Put simply, market conditions will change, the estimated return/risk profile will shift, and we will align our market outlook accordingly. Current extremes seem like they will last forever. They will not. Far beyond double Current valuations cannot be "justified" simply by appealing to low interest rates. To see this, we can think about the response of risky securities to Fed-suppressed interest rates as having a “justified” component and a “speculative yield-seeking” component. Stick with me - this is important. Consider a bond paying $100 in 10 years with no coupon payments, and suppose that given its risks, it would normally be priced for a 6% annual return when Treasury bill yields are 4%, producing a 2% "risk premium" over and above the yield on T-bills. Under those assumptions, the price of the bond would be 100/(1.06)^10 = $55.84. Now suppose Treasury bill yields are instead expected to be held down at 1% for the first 5 years, with normal rates thereafter. In that case, it would be justified to price the bond to return just 3% over the first 5 years, and a normal 6% thereafter. This would put the price of the bond at 100/{(1.03)^5 x (1.06)^5} = $64.46, which is about 15% higher than the original price of $55.84. Why 15%? Because in order to take 3% out of returns for 5 years (ignoring a slight bit of compounding), one has to raise the price by 3% x 5 = 15%. That’s your “justified” response to depressed interest rates. The same holds true for more complex profiles of interest-rate suppression, and for asset classes having larger or smaller risk premiums. Suppose we expect Treasury bill yields, currently near 0.25%, to take a full decade to normalize to 4%. In that case, the “justified” price response for a risky security is just the area of the triangle: 10 years x (4% - 0.25%)/2 = 18.75%. An increase in the current price effectively takes away the same cumulative amount from future returns. And that’s the problem. Historically reliable valuation measures aren’t just 15% or 20% above their historical norms (which could at least be justified on the basis of low interest rates). They’re far beyond double those norms. To illustrate this, let’s ask a question that mirrors the discussion above. How much would you have to invest in the S&P 500 today in order for the investment to grow to $1 after 12 years, including dividends? The chart below shows the historical answer (red line, right scale), along with one of our preferred valuation measures, the ratio of nonfinancial market capitalization to corporate gross value-added (blue line, left scale). See The Illusion That "Old Measures No Longer Apply" for an even longer-term perspective relating valuations and subsequent market returns.
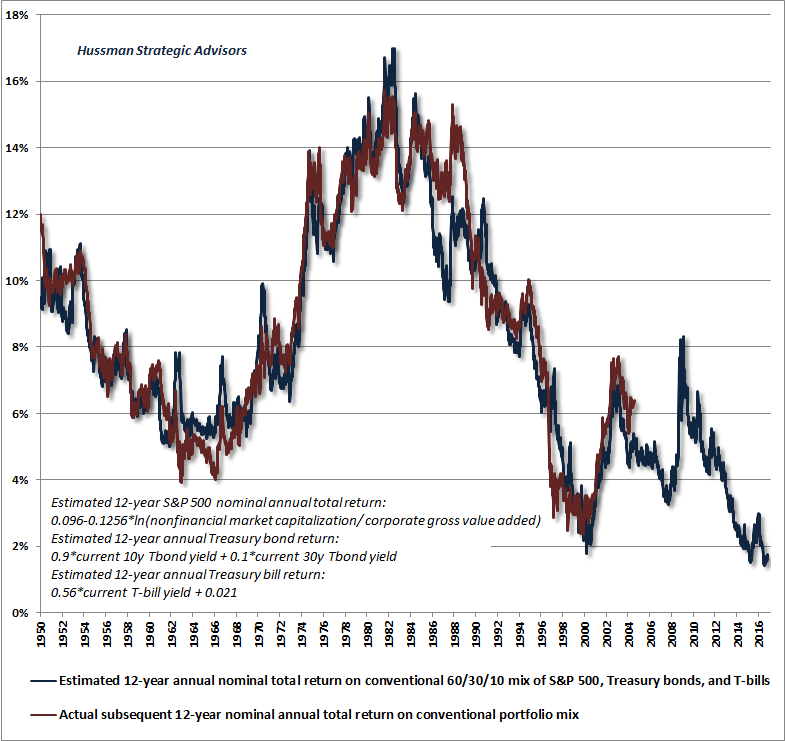
Notice that valuations are highly informative about future investment prospects. When valuations are quite depressed, one can obtain $1 of future value by investing relatively little today. When valuations are quite elevated, one needs to make a larger investment today to obtain $1 of future value. Of course, there are a few outliers. For example, investors in 1986-1988 enjoyed a free-ride over the following 12 years thanks to bubble valuations 12 years later in 1998-2000, so they didn’t have to invest nearly as much as valuations suggested in order end the period with $1. Conversely, investors with a 12-year horizon did worse than valuations would have suggested in 1996-1997, as a result of the global financial crisis 12 years later in 2008-2009, so they would have had to invest more than expected in order to end the period with $1. The horizontal green line shows the level consistent with a 10% annual total return over a 12-year horizon, which works out to an initial investment of about $0.32 in order to end with $1.00. Again, reliable valuation measures aren’t just 15-20% above this level; they’re far beyond double historical norms. At present, we estimate that investors need to invest about $0.83 in the S&P 500 in order to reach $1.00 of value, including dividends, 12 years from now. That works out to an expected annual total return of (1.00/0.83)^(1/12)-1 = 1.6%, which is quite close to the estimates we obtain from a variety of other reliable approaches. The chart below offers a similar picture from a return perspective. It is a reminder that the recent “everything bubble” has produced the third most extreme equity market valuations, on reliable measures, in U.S. history (2000 and 1929 being the others), and the single worst 12-year expected return for a conventional stock-bond-cash portfolio mix in history. We presently see investors eagerly abandoning discretionary and risk-managed investment approaches in preference for passive approaches that remain fully-invested all the time. This is rear-view mirror investing, and the evidence suggests that now is the worst possible moment in history to make that shift.
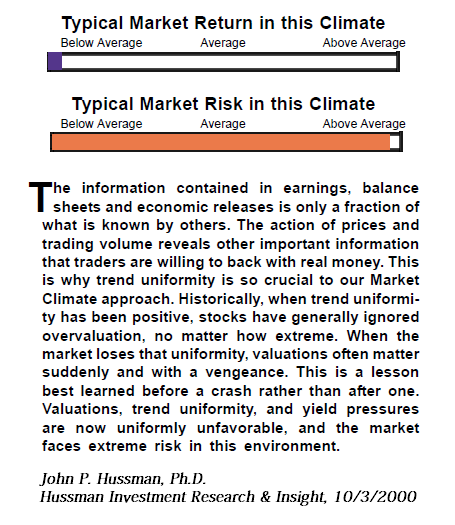
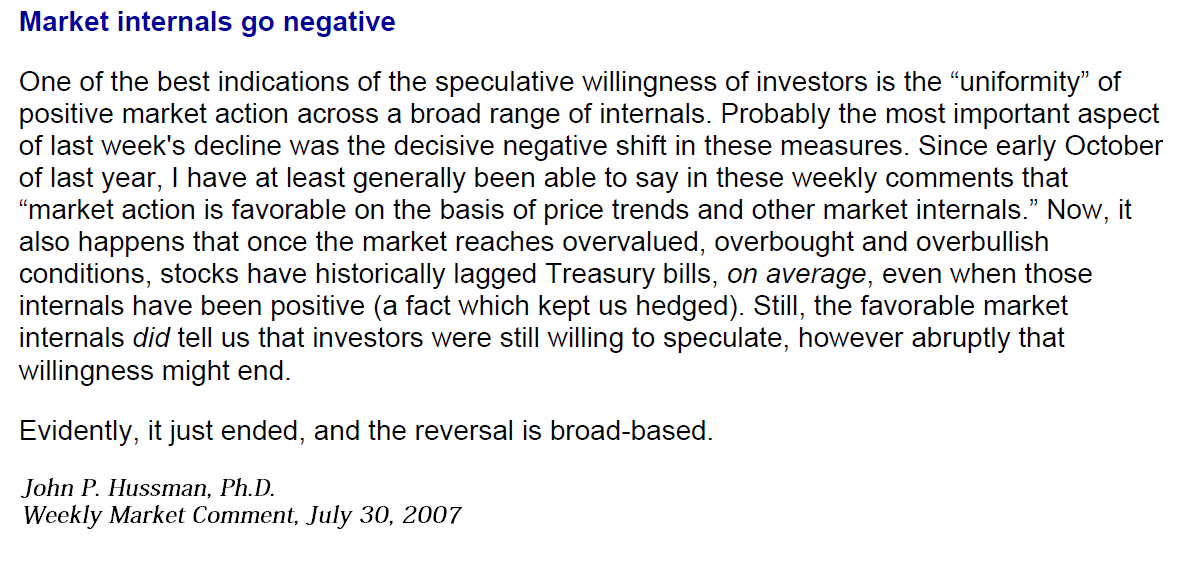
As for monetary policy, I’ve demonstrated in U.S. and Japanese data that central-bank easing actually supports the financial markets only when investors are already inclined to speculate. That inclination is best inferred from the uniformity of market action across a broad range of securities, because when investors are inclined to speculate, they tend to be indiscriminate about it. In contrast, when investors are risk-averse, safe, low-interest liquidity is viewed as a desirable asset rather than an inferior one, so creating more of the stuff doesn’t provoke risk-taking or prevent market collapses (recall, for example, the aggressive and persistent Fed easing throughout the 2000-2002 and 2007-2009 collapses). Low short-term interest rates reliably encourage investors to “reach for yield” in more speculative investments only when investors quietly rule out the potential for capital losses, or at least assume that any loss will be quickly recovered. The moment that investors begin to seriously consider the potential for material capital losses (and at current valuation extremes, a historically run-of-the-mill completion to the present market cycle would be a loss in the S&P 500 on the order of 40-55%), it’s really irrelevant whether short-term interest rates are 0.25%, 1%, or even 3%, because any safe, positive return at all is preferable to outright losses. That’s why investor risk-preferences are a critical determinant of whether, and when, monetary easing appears to “work.” A few quick notes - we’re hearing the perennial arguments about “cash on the sidelines” waiting to gush into stocks. As always, one should remember that every security that is issued in the financial markets has to be held by someone, in precisely the form it was issued as (currency, Treasury bills, commercial paper, stocks, bonds) until that security is retired. What people observe as “cash on the sidelines” is nothing other than a mountain securities that have been issued in the form of short-term money market instruments, and those instruments will remain “on the sidelines” until they are retired. In the meantime, every single one of them will have to be held by someone. They do not “flow” anywhere. They simply change hands, and changing hands doesn’t affect their quantity. All securities are priced, and their returns are determined, to ensure that every security that has been issued is held by someone at every moment in time. Prices and expected returns can change in an instant, without any material volume of transactions. All that needs to happen is a change in the relative eagerness of investors to hold one security versus another. In that context, we saw a spike in September in the interest rate on U.S. dollar loans between foreign banks (“Eurodollars”), relative to Treasury bill yields. After a brief retreat, that spread is widening again. While many observers dismiss this as the result of changes in U.S. money market fund regulations, we observe the same widening of interbank spreads in other currencies (relative to the yields on government bills of the same maturity). A key difference between the two claims is bank default risk, because those interbank loans are essentially funded by uninsured deposits (for example, “Euroyen” are created when investors deposit Japanese yen at non-Japanese banks, and those deposits are uninsured). So we’re seeing some combination of increased demand for interbank funding at foreign banks, and increased reluctance to investors to make uninsured deposits at those banks. This is a concern worth monitoring. A warning on the current market return/risk profile Presently, deteriorating market internals across a broad range of individual securities, industries, sectors, and security types continue to signal a shift toward increasing risk-aversion among investors. The shift from uniformity to divergence across market internals matters. Since March, I’ve deferred pounding the tables about market risk based on a few trend-sensitive components among those measures that were still constructive. That changed in September (see Support Drops Away) which is why my recent comments reflect an increasing level of concern. As I’ve also emphasized at other market extremes, the single worst environment for stocks is one where offensively rich valuations meet deteriorating market internals; where thin risk premiums meet increasing risk aversion among investors. The excerpt below is from October 3, 2000.
The same set of considerations - extreme valuations coupled with early deterioration in market action - was central to anticipating the 2007-2009 collapse. The clip below is from my July 30, 2007 comment.
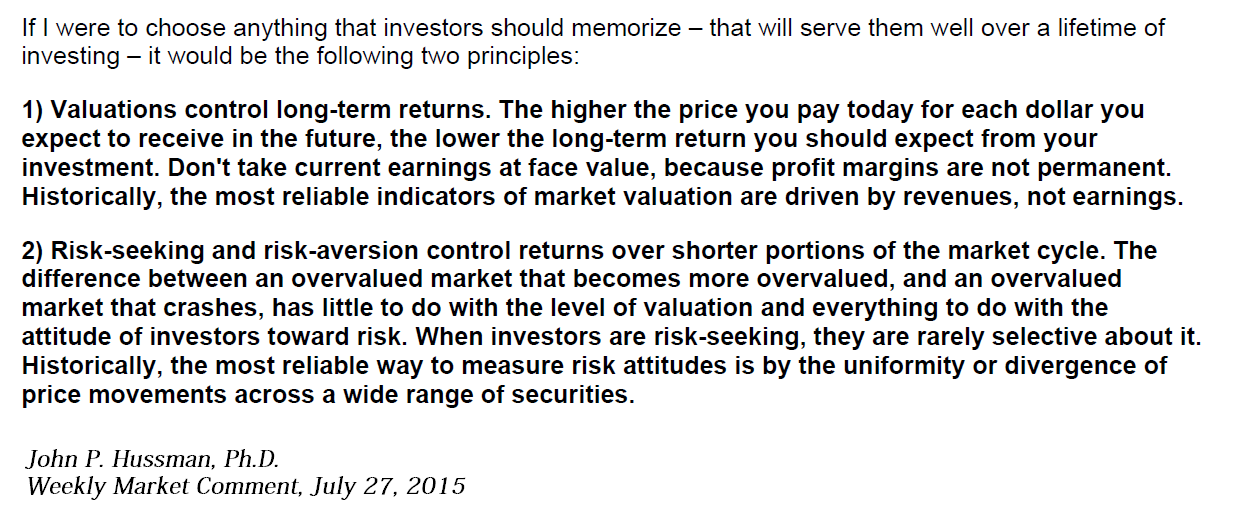
The clip below is from my July 27, 2015 comment, and comprises what I view as the single most important set of considerations investors should be focused on here.
I can’t emphasize enough that the most favorable market return/risk profiles across history emerge at points where a material retreat in valuations is joined by early improvement in market action. Conversely, the worst possible outcomes for investors have repeatedly emerged when an extended period of extreme overvalued, overbought, overbullish conditions has been joined by a deterioration in market action. In prior market cycles across history, rich valuations were rarely enough to crater the market all on their own, but sufficiently extreme “overvalued, overbought, overbullish” syndromes did reliably signal periods of oncoming trouble, even if a bull market ultimately had longer to run. That regularity was captured by our post-crisis stress-tests against Depression-era data, but turned out to be our Achilles Heel in the speculative half-cycle since 2009. In recent years, deranged central bank policy encouraged continued speculation despite these syndromes, particularly after 2011. One had to wait for market internals to deteriorate explicitly before adopting a hard-negative outlook. That consideration is the only thing that was truly “different” about this half-cycle. Investors will draw dangerously wrong lessons from the half-cycle advance since 2009 if they conclude that a) valuations don’t matter, or b) central bank easing is capable of preventing a market collapse once investor preferences shift toward risk-aversion. The key lesson of the recent half-cycle advance was only that deranged central bank policies are capable of extending speculation, even in the face of “overvalued, overbought, overbullish” extremes, provided that investors remain inclined toward risk-seeking. Investors are begging for trouble if they ignore the deterioration in market internals here, because we are observing a shift toward risk-aversion among investors at a point where the most reliable valuation measures we identify have been driven to some of the most obscene levels in history.The foregoing comments represent the general investment analysis and economic views of the Advisor, and are provided solely for the purpose of information, instruction and discourse. Please see periodic remarks on the Fund Notes and Commentary page for discussion relating specifically to the Hussman Funds and the investment positions of the Funds. --- The foregoing comments represent the general investment analysis and economic views of the Advisor, and are provided solely for the purpose of information, instruction and discourse. Prospectuses for the Hussman Strategic Growth Fund, the Hussman Strategic Total Return Fund, the Hussman Strategic International Fund, and the Hussman Strategic Dividend Value Fund, as well as Fund reports and other information, are available by clicking "The Funds" menu button from any page of this website. |
|||||||||||||||||||||||||
|
For more information about investing in the Hussman Funds, please call us at
1-800-HUSSMAN (1-800-487-7626) 513-326-3551 outside the United States Site and site contents © copyright Hussman Funds. Brief quotations including attribution and a direct link to this site (www.hussmanfunds.com) are authorized. All other rights reserved and actively enforced. Extensive or unattributed reproduction of text or research findings are violations of copyright law. Site design by 1WebsiteDesigners. |