

Risk-Aversion Meets a Hypervalued Market


John P. Hussman, Ph.D.
President, Hussman Investment Trust
April 2018
Sooner or later a crash is coming, and it may be terrific.
– Roger Babson, September 5, 1929
Roger Babson’s first rule of investing was “keep speculation and investments separate.” He is remembered not only for founding Babson College in Massachusetts, but also for his speech at the National Business Conference, warning of an impending crash just two days after the 1929 peak, at the very beginning of a decline that would wipe out 89% of the value of the Dow Jones Industrial Average.
As I’ve observed before, the back-story is that Babson’s presentation began as follows: “I’m about to repeat what I said at this time last year, and the year before…” The fact is that Babson had been “proven wrong” by an advance that had taken stocks relentlessly higher, doubling during those two preceding years. Over the next 10 weeks, all of those market gains would be erased. If Babson was “too early,” it certainly didn’t matter. From the low of the 1929 plunge, the stock market would then lose an additional 79% of its value by its eventual bottom in 1932 because of add-on policy errors that resulted in the Great Depression.
To slightly paraphrase Ben Hunt, how does something go down 90%? First it goes down 50%, then it goes down 80% more.
This lesson has been repeated, to varying degrees, at every market extreme across history. For example, the 1973-1974 decline wiped out the entire excess total return of the S&P 500 Index (market returns over and above T-bill returns) all the way back to October 1958. The 2000-2002 market decline wiped out the entire excess total return of the S&P 500 Index all the way back to May 1996. The 2007-2009 market decline wiped out the entire excess total return of the S&P 500 Index all the way back to June 1995. I expect that the completion of the current market cycle will wipe out the entire excess total return of the S&P 500 Index all the way back to about October 1997. That outcome wouldn’t even require the most reliable valuation measures we identify to breach their pre-bubble norms.
The chart below presents several valuation measures we find most strongly correlated with actual subsequent S&P 500 total returns in market cycles across history. They are presented as percentage deviations from their historical norms. At the January peak, these measures extended about 200% above (three times) historical norms that we associate with average, run-of-the-mill prospects for long-term market returns. No market cycle in history – not even those of recent decades, nor those associated with low interest rates – has ended without taking our most reliable measures of valuation to less than half of their late-January levels.
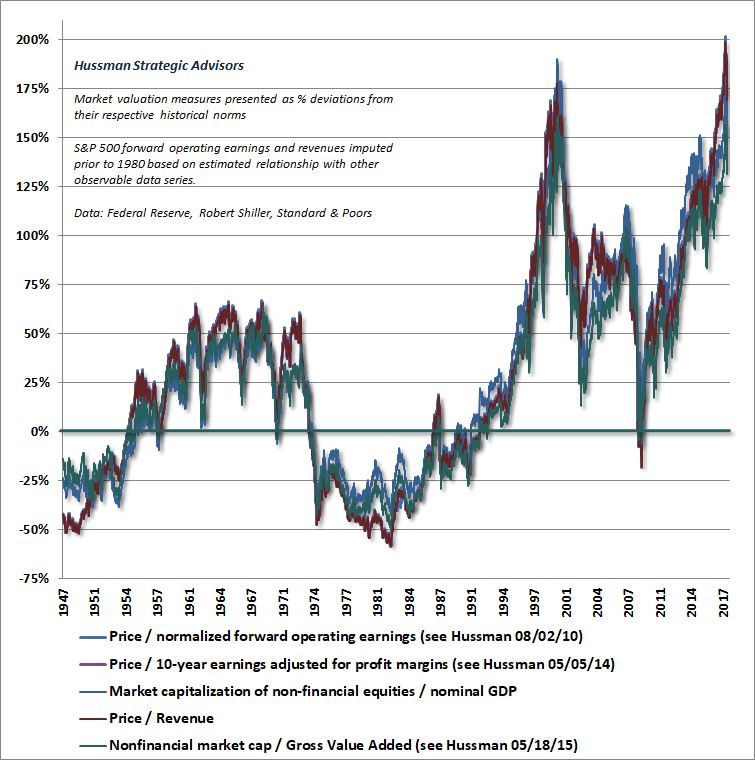
Don’t imagine that a market advance “disproves” concerns about overvaluation. In a steeply overvalued market, further advances typically magnify the losses that follow, ultimately wiping out years, and sometimes more than a decade, of what the market has gained relative to risk-free cash.
Daily news versus latent risks
I’ve been increasingly asked my opinion of the recent market volatility. The proper answer, I think, is that we’re observing the very early effects of risk-aversion in a hypervalued market. To some extent, the actual news events are irrelevant. I certainly wouldn’t gauge market risk by monitoring the day-to-day news on potential tariffs or even prospects for rate changes by the Fed.
Indeed, when our measures of market internals have been unfavorable (signaling risk-averse investor psychology), the S&P 500 has historically lost value, on average, even during periods of Fed easing, falling interest rates, or interest rates pinned near zero. The reason is that when investors are inclined toward risk-aversion, safe liquidity is a desirable asset rather than an inferior one, so creating more of the stuff doesn’t provoke speculation.
This distinction – that Fed easing can strongly amplify existing speculative pressures but is often wholly ineffective when investors are inclined to risk-aversion – is likely to smack believers in a “Fed put” like a ton of bricks over the completion of this cycle. It wouldn’t be a surprise if the financial memory of investors wasn’t so selective. Recall that the Fed eased aggressively and persistently throughout the 2000-2002 and 2007-2009 collapses.
In a speculative market, bad news is good news and good news is good news. In a risk-averse market, the opposite is true. When investors have to argue among themselves about which news event is causing them to worry, the news is probably just providing day-to-day occasions for investors to act on more general concerns, like extreme valuation.
Does anyone really think the market crashed in October 1987 because of a larger-than-expected trade deficit with Germany? That’s the only news event people could find that day, and investors would fearfully monitor every blip in trade reports months afterward. Attributing the market change of the day to the particular news of the day is an exercise in spurious correlation. Unless there’s an event that will materially alter the long-term stream of cash flows that will be delivered by companies to investors for decades to come, what you’re actually seeing is a daily dance of surface-level investor psychology that gradually reveals or obscures the latent fundamentals below.
As I’ve previously observed:
“Imagine the error of skating on thin ice and plunging through. While we might examine the hole in the ice in hindsight, and find some particular fracture that contributed to the collapse, this is much like looking for the particular pebble of sand that triggers an avalanche, or the specific vibration that triggers an earthquake. In each case, the collapse actually reflects the expression of sub-surface conditions that were already in place long before the collapse – the realization of previously latent risks.
“Finding the specific trigger that causes the skaters to plunge through the ice isn’t particularly informative. The fact is that catastrophe is inevitable the moment the skaters ignore the latent risk, or rely on faulty evidence to conclude that the ice is stable. The fracture in some particular span of ice is just one of numerous other spots that might have otherwise given way if the skaters had chosen a different course. Hitting that spot creates the specific occasion for the underlying risk to be expressed, but an unfortunate outcome was already inevitable much earlier.”
In a speculative market, bad news is good news and good news is good news. In a risk-averse market, the opposite is true.
So while one can point to numerous factors that have contributed to a shift in investor preferences from speculation toward risk-aversion, it’s a fact of human nature that crowd psychology periodically fluctuates between exuberance and despair. Knowing this, it’s essential to be vigilant about downside risk at the point where extreme valuations are met by a shift in investor attitudes toward risk (which we infer from the uniformity of market internals). Our most reliable measures of those risk preferences shifted to a negative condition in the week ended February 2nd, and they remain unfavorable here.
There’s no getting out, in aggregate
After more than three decades as a professional investor, few things are quite as familiar as the tendency of speculators to declare victory at half-time. In my view, the exodus into passive investing is little more than performance-chasing; the reflection of speculators looking in the rear-view mirror, terrifically impressed at the past outcomes of their own speculation.
There’s no sense in encouraging investors to “get out.” The fact is that it’s impossible, in aggregate, for investors to get out, because every share of stock that’s been issued has to be held by someone until that share is retired. The only question is who holds the bag on the way down. Still, it’s best for those holders to be investors whose investment horizons and risk-tolerances could tolerate a market loss on the order of 60% over the next few years (our run-of-the-mill expectation, not a worst-case scenario) and roughly zero returns over the next 10-12 years, without great distress, and without abandoning their discipline. If you’re already experiencing distress at the rather minimal level of volatility and market loss we’ve seen in recent weeks, you’re probably taking more risk than is appropriate.
If you know you’re taking too much risk, rebalance your portfolio so that the risk is tolerable. But do so knowing one thing in advance: you will experience regret. If the market advances after you rebalance, you’ll regret having sold anything. If the market declines after you rebalance, you’ll regret not having sold more. Accepting this at the start can help enormously. If you’re feeling uncomfortable with your position X, and you would feel more comfortable with a position Y, I’ve always thought that a reasonable compromise is to make 40% of the adjustment immediately. Complete the rest of the necessary adjustment over a fairly short period of time, but ideally in response to opportunities.
Investment and speculation
Both Benjamin Graham and Roger Babson were careful to distinguish investment from speculation. This remains a critical distinction today. Understanding it will make an enormous difference to investors in the coming years.
When we examine market collapses across history, the common feature is that both investment merit and speculative merit are absent.
At its core, investment is about valuation. It’s about purchasing a stream of expected future cash flows at a price that’s low enough to result in desirable total returns, at an acceptable level of risk, as those cash flows are delivered over time. The central tools of investment analysis include an understanding of market history, cash flow projection, the extent to which various measures of financial performance can be used as “sufficient statistics” for that very long-term stream of cash flows (which is crucial whenever valuation ratios are used as a shorthand for discounted cash flow analysis), and a command of the basic arithmetic that connects the current price, the future cash flows, and the long-term rate of return.
At its core, speculation is about psychology. It’s about waves of optimism and pessimism that drive fluctuations in price, regardless of valuation. Value investors tend to look down on speculation, particularly extended periods of it. Unfortunately, if a material portion of one’s life must be lived amid episodes of reckless speculation that repeatedly collapse into heaps of ash, one is forced to make a choice. One choice is to imagine that speculation is actually investment, which is what most investors inadvertently do. The other choice is to continue to distinguish speculation from investment, and develop ways to measure and navigate both.
The central tools of speculative analysis focus on the observable prices, trading volume, sentiment, and other objects that emerge as the expression of investor psychology. For our part, two sorts of measures are useful; one dealing with the uniformity or divergence of price behavior, and the other dealing with overextended extremes.
We gauge investor preferences toward speculation or risk-aversion by extracting a signal from what we call “market internals” – the behavior of thousands of securities; individual stocks, industries, sectors, and security-types, including debt securities of varying creditworthiness. While we do keep our methods proprietary on that front, we’re very open about the underlying concepts: 1) when investors are inclined to speculate, they tend to be indiscriminate about it, and 2) when two securities diverge, the dispersion provides information about factors that they do not share in common. As a simple example, consider junk bonds versus high-grade bonds. Uniform market action conveys information or investor perceptions about interest rate pressures. Divergence conveys information or investor perceptions about oncoming credit risk and default.
With regard to overextended extremes, prior episodes of speculation in market cycles across history usually ended, or encountered sharp air-pockets, at the point where valuations, price extremes, and investor sentiment simultaneously reflected overvalued, overbought, overbullish conditions. Unfortunately, we learned the very hard way in recent years that, faced with zero interest rate policies, these syndromes were virtually useless in signaling even a pause in the relentless yield-seeking speculation and “there is no alternative” mindset that the Federal Reserve deliberately encouraged. So we had to adapt, ultimately restricting our discipline from taking a negative outlook unless we also observed explicit deterioration in our measures of market internals.
At present, stock market investors are faced with offensively extreme valuations, particularly among the measures best-correlated with actual subsequent market returns across history. Investment merit is absent. Investors largely ignored extreme “overvalued, overbought, overbullish” syndromes through much of the recent half-cycle advance, yet even since 2009, the S&P 500 has lost value, on average, when these syndromes were joined by unfavorable market internals.
We observed a clear deterioration in our measures of market internals in the week of February 2nd. While we have to be open to changes in market internals that might signal a resumption of speculative investor psychology, we don’t see that here. So speculative merit is also absent (apart than the rather weak potential that emerges from short-term “oversold” conditions). When we examine market collapses across history, the common feature is that both investment merit and speculative merit are absent.
Investment is about valuation. Speculation is about psychology. Both factors are unfavorable here.
Look, I’m aware of how tempting it is to dismiss my concerns here, given my stumble in the half-cycle since 2009. Sure, I became a leveraged, raging bull after the 1990 bear market. Sure, I anticipated the 2000-2002 and 2007-2009 plunges, with a constructive shift in-between. Sure, despite being defensive “too early” approaching bubble peaks, we’ve come out admirably by the completion of previous full market cycles, with the exception of this speculative half-cycle. The problem is that I stumbled in one heck of a speculative advance, and speculators like to declare victory at half-time.
Still, considering how our discipline has navigated previous complete market cycles, it’s useful to understand our central error in the recent advancing half-cycle, and how we’ve addressed it. The problem was not our measures of valuation (which were as clear about undervaluation at the 2008-2009 lows as they are about extreme valuations today). Valuations tell us about the “investment” prospects of the financial markets, and they speak volumes about expected long-term returns, but we know they aren’t very informative about outcomes over shorter segments of the market cycle.
The problem was not our measures of market internals either. The S&P 500 has lost ground, on average, at points in recent years where rich valuations were paired with unfavorable internals. Be mindful that a shift in market internals doesn’t necessarily mean that the entire cycle has changed from bull to bear or vice versa, so we always have to allow for shifts. But again, those measures weren’t an issue in the half-cycle since 2009.
Rather, the problem was our over-reliance and negative response to extreme “overvalued, overbought, overbullish” syndromes of market action. Those syndromes provided valuable warnings in prior market cycles across history, but were wholly ineffective in putting brakes on speculation in an environment where the Fed intentionally starved investors of safe alternatives. Last year, we finally threw up our hands and adapted our approach to require explicit deterioration in market internals before adopting a negative market outlook, regardless of the level of valuations, regardless of the severity of overextended extremes, and with no exceptions.
Our hardest lesson is behind us, but ordinary investors are only about to (re)learn their own. Here we are, with valuations still perched nearly three times their historical norms; indeed, nearly three times the level that is “justified” by interest rates (because if interest rates are low because growth rates are also low, no valuation premium is actually “justified” at all). Meanwhile, the current deterioration in market action suggests that risk-aversion is creeping back into investor psychology.
Recognizing that valuations matter profoundly over the long run, yet are nearly useless over the short run, is central to navigating complete market cycles.
– John P. Hussman, Ph.D.
So if we are careful to distinguish investment from speculation, our answer to “what now?” is fairly straightforward. While valuations remain extreme and market internals convey a signal about growing risk-aversion among investors, we have to allow for the potential for a market collapse just as severe as we observed in 2000-2002 and 2007-2009. Remember, the “catalysts” associated with a market collapse are typically only identified as important after the plunge, not before.
If the uniformity of market internals was to improve, suggesting that investors had again taken the speculative bit in their teeth, our expectations for severe losses would be deferred, and our immediate outlook would shift toward a neutral/constructive tone (though undoubtedly with a safety-net in any event), despite what we view as obscene valuations.
The most desirable outcome, from an expected return/risk standpoint, would of course be a material retreat in valuations first, followed by an early improvement in market internals. That combination could justify a much more positive or aggressive investment outlook.
From the standpoint of our value-conscious, historically-informed, full-cycle investment discipline, no forecasts are actually required. What is required instead is that we align ourselves with the set of evidence we observe at any point in time.
Some basic expected return arithmetic
One of the things we frequently hear is “well, valuations may be high, but even if stocks decline, they always come back.” On this point, it’s important to recognize that the two long-term drivers of S&P 500 total returns have historically been growth in nominal fundamentals averaging about 6% annually in post-war data (though gradually slowing in recent decades), coupled with a dividend yield averaging about 4% annually.
Cyclical fluctuations in market valuation also affect total returns, as rising valuations mean that prices are growing faster than fundamentals, and falling valuations imply that prices are growing slower (or falling). Rich valuations also generally mean lower dividend yields, while depressed valuations generally mean higher dividend yields.
Accordingly, low starting valuations benefit investors by creating the likelihood of future price increases in excess of growth in fundamentals, and also by boosting the yield component of total return. In contrast, rich starting valuations add insult to injury, by creating the likelihood of future price gains (or losses) below the growth in fundamentals, and also by diminishing the yield component of total return. In recent decades, the growth rates of GDP, S&P 500 revenues, and even S&P 500 earnings have been lower than historical norms, but the cyclical move to extreme valuations has encouraged investors to assume that stocks somehow inherently deliver attractive annual returns.
Nothing could be further from the truth when one starts the clock with extreme valuations and weak structural growth. Examine the past 18 years, for example. The total return of the S&P 500 has averaged 5.1%, which would be tolerable if that outcome wasn’t the result of the market clawing its way back to the most extreme valuations in U.S. history just to (temporarily) achieve that return. Instead, we estimate that this gain will be largely or completely wiped out over the completion of this cycle.
The fact is that the 5.1% total return since 2000 is comprised of three pieces: average annual S&P 500 revenue growth of just 3.1% over the past 18 years, an S&P 500 price/revenue ratio that – after the recent market decline – is now unchanged from its level at the 2000 market extreme (so overall valuation changes have neither contributed nor subtracted from total returns over this period), and an average dividend yield of about 2.0%.
Consider the situation today. We know from population demographics and productivity trends (see prior market comments for details) that the structural growth rate of U.S. real GDP has gradually declined toward what is now about 1%, and even a substantial pickup in productivity growth would leave structural real GDP growth at about 2%. Add about 2% in inflation, and you’ve got 4% growth in nominal fundamentals. For S&P 500 revenues, a 4% growth rate would be clearly faster than the 3.1% annual growth we’ve seen since 2000, and the 2.2% growth we’ve seen over the past 5 years. Finally, suppose that the price/revenue ratio of the S&P 500 (currently at 2.2, down from 2.4 at the January high) retreats only modestly to say, 1.6 over the coming decade. That would still leave the price/revenue ratio at nearly twice its pre-bubble historical norm, which is closer to 0.8.
What’s the expected total return in the S&P 500 given those assumptions? Well, revenue growth would contribute 4% annually if the price/revenue ratio was to remain at record extremes, but otherwise, we’ve also got to consider the effect of the change in valuations. Amortize the retreat in the price/revenue ratio over 10 years, and you get [(1.6/2.2)^(1/10)-1=] -3.1%. Add an average dividend yield of about 2%, and we conclude that even if the S&P 500 price revenue is still nearly double its historical norm a decade from now, investors could expect to net a total expected return of only about: 4.0% (growth) – 3.1% (valuation change) + 2.0% (income) = 2.9% annually.
In my view, that’s a rather optimistic set of assumptions. Our actual expectations imply annual losses of about -2% annually over the coming decade. Pursuing those return prospects also demands an extreme tolerance for potential market losses in the interim.
If you’re already experiencing distress at the rather minimal level of volatility and market loss we’ve seen in recent weeks, you’re probably taking more risk than is appropriate.
Having correctly anticipated both the 2000-2002 and 2007-2009 declines, and their extent (including my March 2000 projection of an 83% loss in technology stocks), one thing I’ve learned is this. By the end of a market cycle, nobody complains about having been defensive “too early.” I expect that the completion of this market cycle will take the S&P 500 to the 1000 level or below; an outcome that would essentially bring the most reliable valuation measures we identify to their run-of-the-mill historical norms. That outcome would be sufficient to wipe out the entire total return of the S&P 500 since 2000, and the entire total return of the S&P 500, in excess of Treasury bill returns, all the way back to October 1997.
We presently estimate negative expected total returns for the S&P 500 over the coming 10-12 year horizon. The arithmetic of total returns simply doesn’t support substantially stronger return expectations. That arithmetic would certainly improve in the event of a steep retreat in valuations. Of course, that’s exactly what we generally observe over the completion of every market cycle, and those declines ultimately bring better opportunities.
Remember that markets rarely decline in one fell-swoop. Examine prior declines like 1973-74, 2000-02, and 2007-09. You’ll see steep plunges punctuated by advances of even 20% or so that keep investors hoping all the way down.
I expect the path to the 1000 level on the S&P 500 to be quite volatile. Envision a series of steep individual plunges, each punctuated by furious advances, some which may persist for weeks or months and extend substantially higher before collapsing into a fresh cascade of losses. If you’ve never studied a chart of actual day-by-day market fluctuations over the full course of a bear market, covering up the right side of the chart, slowly revealing each bar day-by-day, and imagining your emotions, I’d strongly encourage that exercise as one of the most valuable investments you could make here.
Valuation review
I’ll begin our discussion of valuations by emphasizing once again that overvaluation typically has little effect on near-term outcomes when investors are inclined to speculate (which we infer from the uniformity of market internals across a broad range of stocks, industries, sectors, and security-types, including debt securities of varying creditworthiness). Based on the deterioration we’ve observed in our most reliable measures, investor preferences have subtly shifted toward risk-aversion, which opens up something of a trap-door.
If our measures of internals improve, our immediate outlook will shift to a more neutral or constructive view, regardless of valuation extremes. We don’t try to predict these shifts in investor psychology, but simply align ourselves with the evidence as it changes. Here and now, extreme valuations matter enormously.
I’ve demonstrated previously that while earnings are certainly necessary to generate the very, very long-term stream of cash flows delivered by stocks over time, earnings are actually very poor “sufficient statistics” for those cash flows. The implied “duration” of the S&P 500 here exceeds 50 years, meaning that investors should be cautious about taking cyclical fluctuations in profit margins or tax policy at face value unless they expect both to persist, unaltered, for about 5 decades. Presently, we see the opposite tendency – where the effects of these factors are being wildly overestimated.
For example, even before the recent corporate tax cuts, the effective tax rate (taxes actually paid as percentage of profits) for U.S. nonfinancial corporations was just 20%. Even if those taxes were reduced by fully 40%, the effect on after-tax profits would be just [(1-0.6*0.20)/(1-0.20)-1]= 10%. Moreover, that 10% increment would deserve to be embedded into stock price gains only if it was expected to survive every future administration in the next 5 decades.
More generally, we see a lot of analysts gurgling that stocks don’t look expensive on the basis of “forward operating earnings” – Wall Street’s estimates of earnings-without-the-bad-stuff, looking a year ahead. Easy now. What’s really happening is the same thing we saw in 2000 and 2007: extrapolation gone wild.
Despite operating margins that are already at record levels, despite the fact that S&P 500 revenues are growing at less than 3% annually, and despite the fact that lower effective tax rates are only likely to boost after-tax earnings by about 10%, Wall Street’s 2019 forward earnings estimates for the S&P 500 are presently 46% higher than the most recent 12-month operating earnings for the index. Allowing for revenue growth, this implies projected operating margins more than one-third higher than current record levels, and over 50% higher than the already elevated median operating margins we’ve observed since 2000. The combination of extreme valuations and extreme earnings expectations creates a situation that’s ripe for disappointment.
We know from a century of evidence on complete market cycles that the most reliable valuation measures (based on their correlation with actual subsequent market returns) are actually those that mute cyclical variations in profit margins. Put another way, when we examine the market as a whole, revenues are much more reliable “sufficient statistics” of long-term, deliverable cash flows than current or forward operating earnings are. Let’s take a look at where valuations stand on these measures.
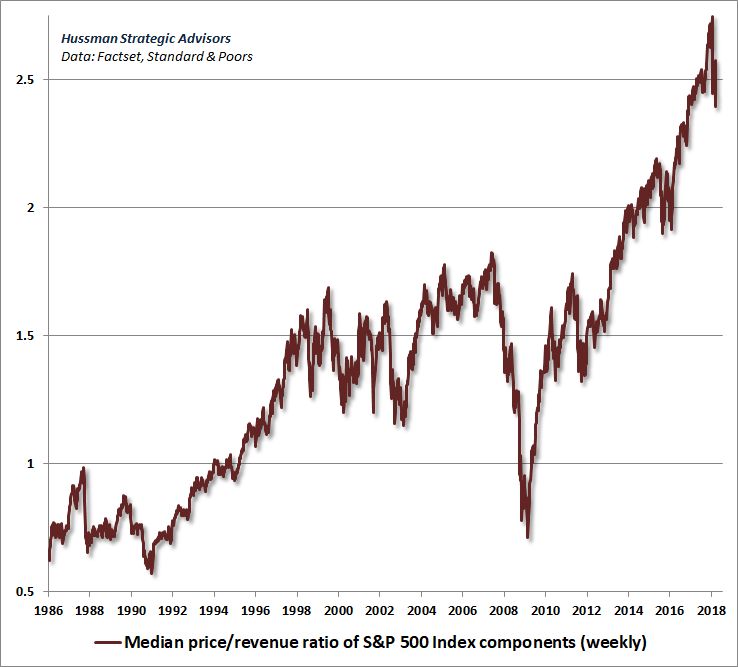
The first chart below shows the median price/revenue ratio of S&P 500 index components. Following the most extreme level of broad overvaluation in history, we’ve observed a rather minor retreat in valuations. This places recent volatility in perspective. We’re hardly seeing “bargain valuations” here.
To place current valuations within a century of context, the next chart overlays the median price/revenue ratio for the S&P 500 (right scale) onto our margin-adjusted CAPE (left scale). You’ll notice that recent valuation extremes actually moved beyond the 1929 and 2000 peaks. But you’ll also notice something interesting: the current episode of overvaluation has been much, much broader than we observed during the 2000 tech bubble.
No market cycle in history – not even those of recent decades, nor those associated with low interest rates – has ended without taking our most reliable measures of valuation to less than half of their late-January levels.
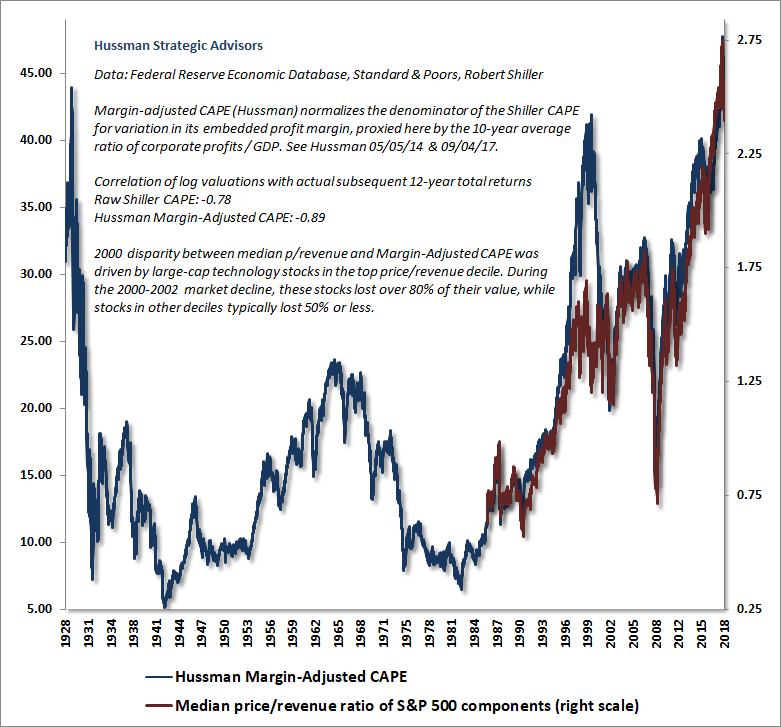
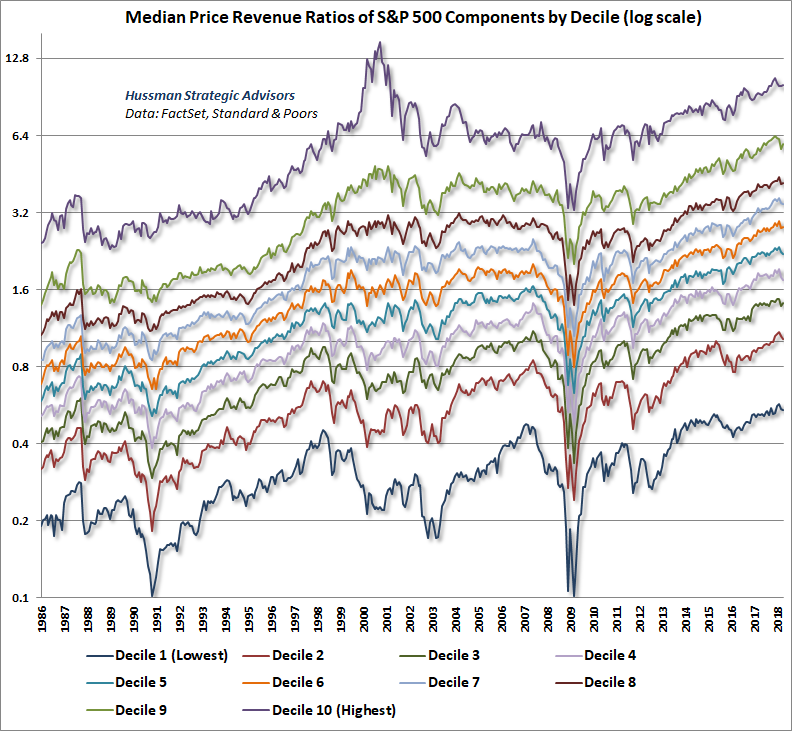
The valuation extremes in 2000 were largely driven by a relatively limited set of very large capitalization technology stocks, representing the most overvalued decile of S&P 500 components. The stocks in this decile plunged by a median of 80% from their highs during the 2000-2002 bear market. But other deciles were generally less overvalued, and many stocks were quite reasonably priced even at the 2000 peak. Today, by contrast, valuations are uniformly extreme across the entire stock market.
The chart below provides some insight into S&P 500 valuations, breaking price/revenue ratios into ten deciles from highest to lowest multiples. You’ll immediately observe that the top decile accounted for much of the hypervaluation at the 2000 peak. By contrast, every decile except that top one set the steepest valuations in January. Indeed, even for that top decile, January’s valuation exceeded those for all but the final 12 months of the tech bubble. See the itty-bitty retreats on the far right of the graph? That’s what Wall Street analysts on TV are calling “bargains.”
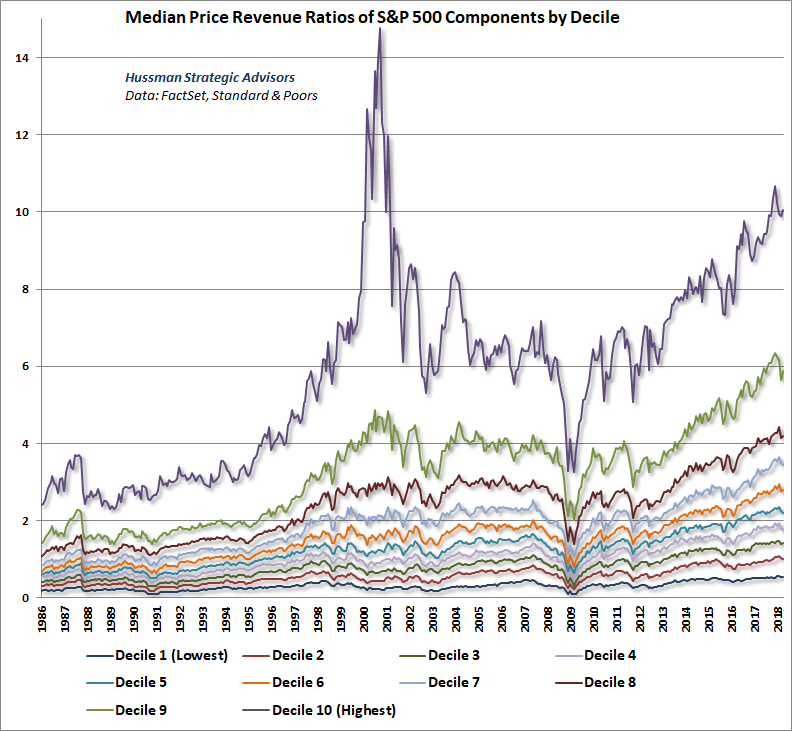
The next chart offers a bit more resolution by placing price/revenue ratios on log scale.
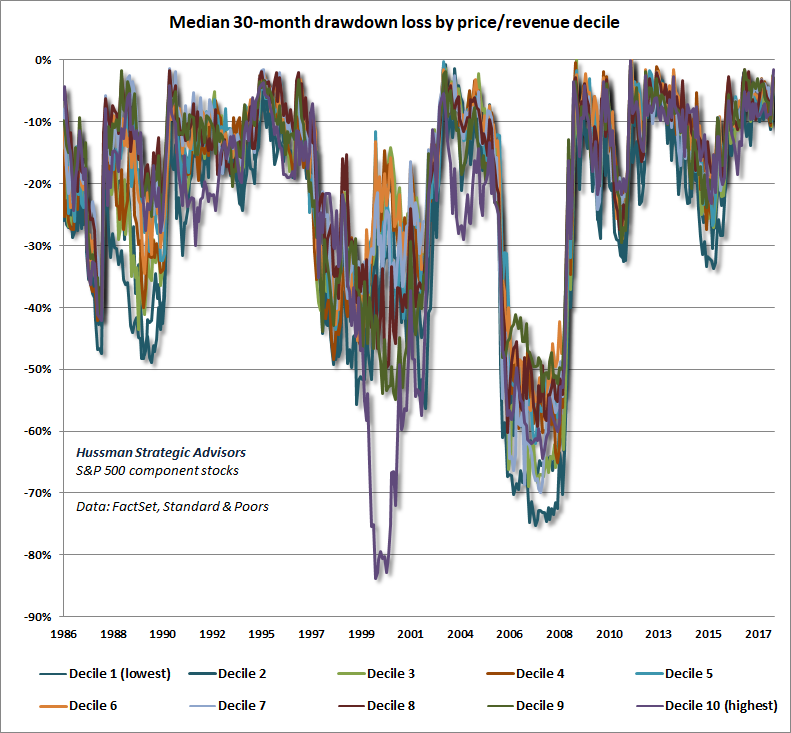
To offer some insight on prospective losses over the completion of the market cycle, the following chart examines the S&P 500 stocks, and shows the median drawdown (loss to lowest point) of stocks within each valuation decile. Not surprisingly, stocks in the single most overvalued decile in 2000 experienced median drawdowns in excess of 80% from their highs over the completion of the cycle. Other deciles experienced less extreme losses.
The overvaluation of stocks was fairly uniform at the 2007 market peak, resulting in more similar drawdowns during the 2007-2009 collapse, generally ranging between 50-70% among individual stocks. My impression is that outcomes over the completion of the current market cycle will be similar or somewhat worse. That said, since drawdown lows for individual stocks don’t all occur at the same time, my expectation for the loss in the S&P 500 index as a whole remains just over 60%.
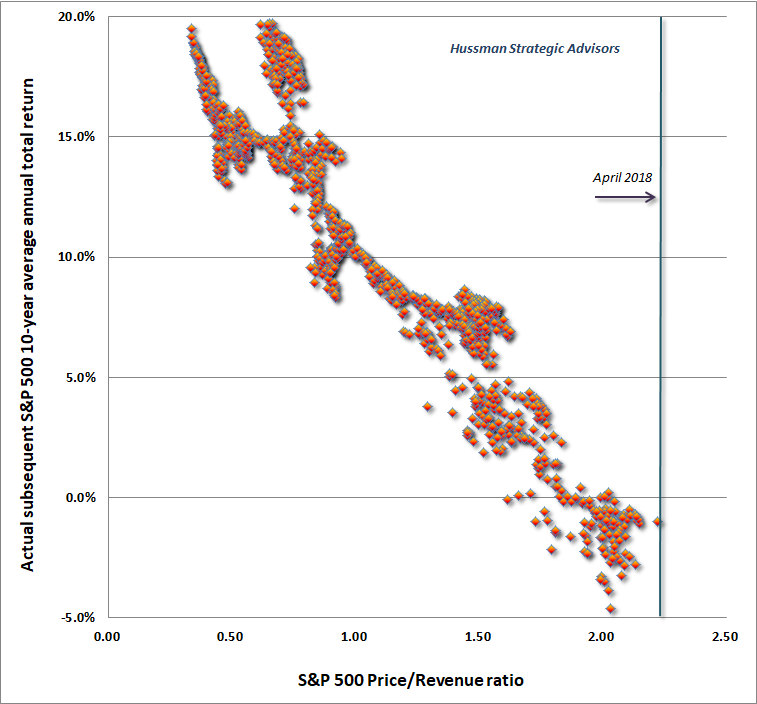
With regard to longer-term return prospects, the chart below shows the relationship between the S&P 500 price/revenue ratio and actual subsequent S&P 500 total returns over the following decade, in data since 1980.
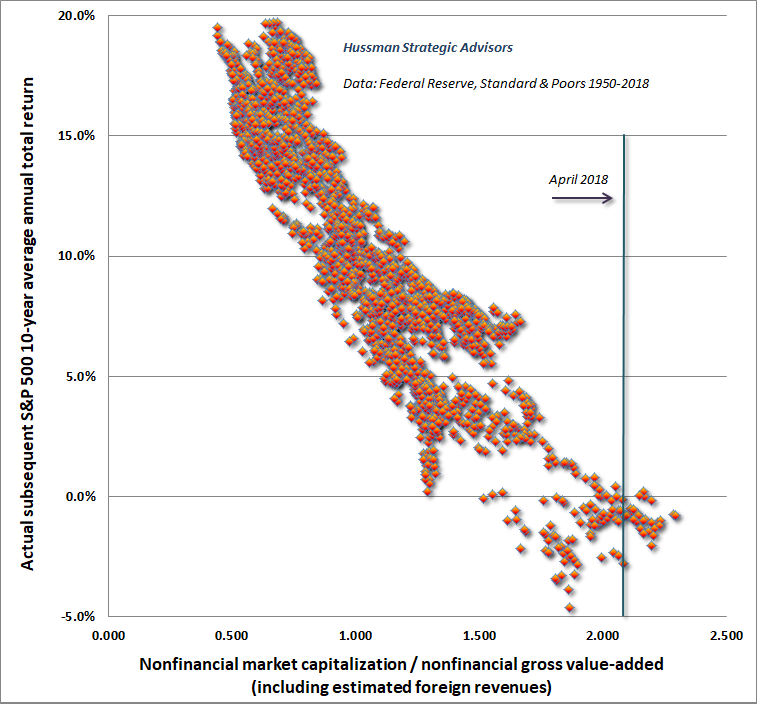
Similarly, while we prefer to use a 12-year horizon (which is where the autocorrelation profile of valuations hits zero and mean-reversion is most reliable), the chart below shows the relationship between 10-year S&P 500 total returns and our most reliable apples-to-apples valuation measure: the ratio of nonfinancial market capitalization to non-financial gross value-added, including estimated foreign revenues. Even with the recent retreat in valuations, we presently estimate zero or negative prospective S&P 500 total returns for the coming decade.
Don’t be surprised
The central message of our discipline is that valuations are enormously informative about prospects for long-term and full-cycle returns, but that outcomes over shorter segments of the market cycle are driven by changes in the psychological preferences of investors toward speculation or risk-aversion. We infer those preferences from information extracted from the uniformity or divergence of market internals across thousands of individual securities.
In a century of prior market cycles, an additional factor – extreme syndromes of “overvalued, overbought, overbullish” market conditions – reliably warned of impending air-pockets, panics, and crashes, even when market internals were still favorable. In the half-cycle since 2009, zero interest rate policy created a mentality of “there is no alternative” to speculation, and our reliance on those syndromes was detrimental. We’ve adapted in response. When market internals are favorable, sufficiently extreme “overvalued, overbought, overbullish” syndromes can encourage safety nets and a rather flat outlook, but we require explicit deterioration in market internals to adopt a negative outlook.
Understand those considerations, and you won’t be surprised if our outlook becomes neutral at very elevated valuations (as it was prior to the deterioration in market internals we observed in the week of February 2nd). You also won’t fear that I’ve lost my mind later in this cycle when I encourage a constructive or aggressive market outlook in response to a material retreat in valuations coupled with an early improvement in market action (as I have after every bear market plunge in over 30 years, including late-2008, though my insistence on stress-testing our methods against Depression-era data in 2009 admittedly cut that short). Most importantly, you won’t be terribly surprised in the event that the S&P 500 indeed loses over 60% of its value over the completion of this cycle, while investors scramble to identify some “catalyst” to explain, in hindsight, why it happened.
Final observations
Though Wall Street’s estimates of forward operating margins imply soaring earnings in the next couple of years, it’s useful to understand that in available data since the early 1980’s, the higher Wall Street’s expectations of profit margins have been, the weaker the subsequent performance of the S&P 500 has been over the following 3-year horizon.
We observe the same sort of extrapolative expectations in Wall Street’s discussion of the U.S. economy. As I’ve detailed previously, about half of the 2.2% annual GDP growth since the global financial crisis has actually been driven by a falling unemployment rate. Meanwhile, the underlying structural drivers of real economic growth (labor force growth and productivity) have progressively slowed in recent decades toward what it now about a 1% structural trend.
Even a meaningful acceleration in productivity would push real GDP growth scarcely beyond 2%, unless the unemployment rate also falls toward zero. For those inclined to make that assumption, a decline in the unemployment rate to zero over a 5-year horizon add an extra 0.8% annually to real GDP growth over that period.
When interest rates are low because growth is also low, no valuation premium is justified at all. This is most easily demonstrated with the Gordon model: P = D/(r-g). Simultaneously reduce r and g below their historical norms. What happens to the fair valuation multiple P/D? Nothing. What happens to expected returns? Even at a valuation multiple equal to its historical norm, the expected return is lower, because of the lower growth rate. The same proposition can be demonstrated using any other discounted cash flow model.
The upshot is that even at historically normal valuation multiples, the S&P 500 would still be priced for lower expected returns than historically. The problem is that the most reliable valuation measures we identify are actually nearly three times those norms here. It’s unfortunate that the proper recognition of the most basic principles of valuation will arrive only after another cyclical collapse.
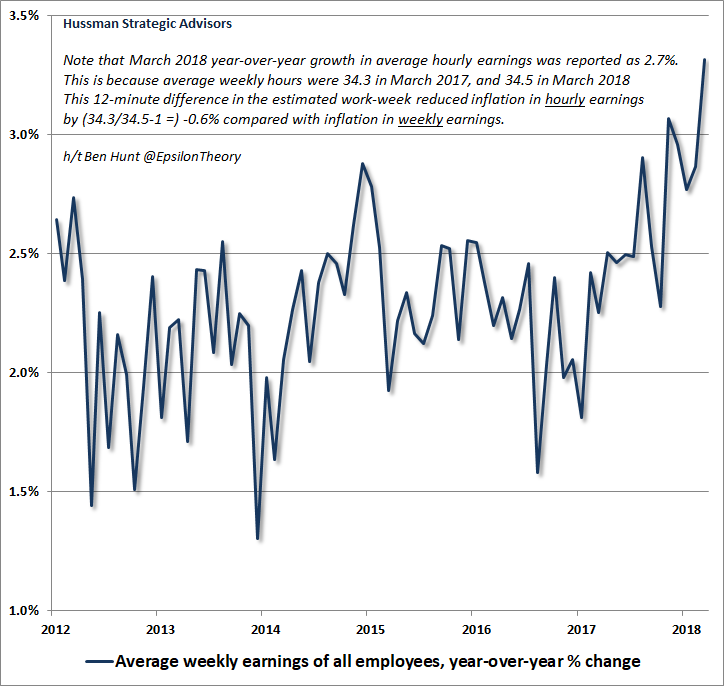
Speaking of cyclical fluctuations, several developments are worth watching. First, while the March employment report was accompanied by a report of 2.7% year-over-year growth in average hourly earnings, it’s important to understand how very small changes in the estimated work-week can affect these figures. Ben Hunt at Epsilon Theory recently wrote an interesting article on this calculation. Essentially, the average hourly earnings figure is generated by dividing average weekly earnings by an estimate of the average work-week. In March, the year-over-year growth in average weekly earnings was actually 3.3%. But because the workweek was estimated at 34.3 hours in March 2017, and 34.5 hours in March 2018, that 12-minute change in the estimated workweek reduced the hourly wage inflation figure by (34.3/34.5-1) = -0.6%. Put simply, wage inflation is already emerging, even if it’s not fully recognized.
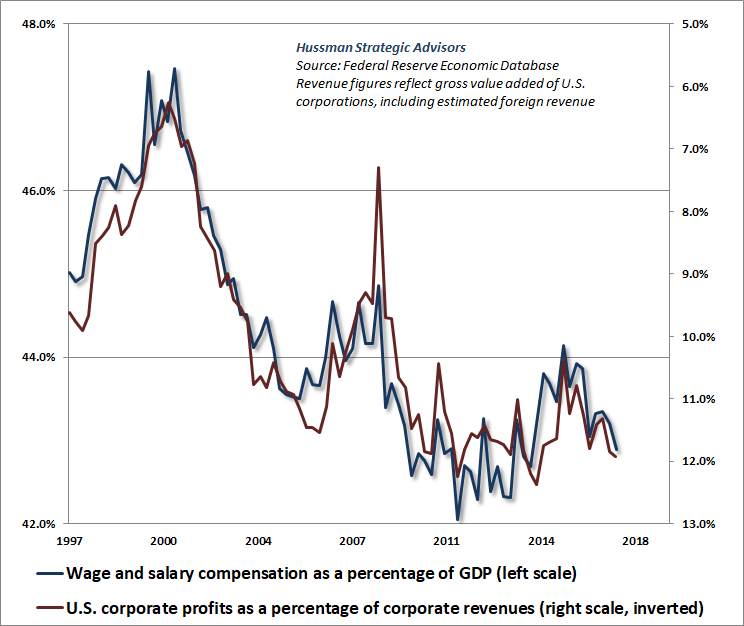
Notably, the primary driver of elevated profit margins in the recent half-cycle has been unusually depressed wage inflation, resulting from enormous labor market slack and unemployment following the global financial crisis. The chart below illustrates this inverse relationship. With the unemployment rate down to just 4.1%, any increase in wages as a share of GDP should be expected to diminish profit margins from the extremes they’ve enjoyed as a result of labor market slack in this cycle.
The recent surge in LIBOR relative to domestic U.S. short-term interest rates is also worth noting. LIBOR is an interest rate paid on dollar deposits held at foreign banks (in this case London, but financial centers in other countries quote PIBOR, TIBOR, FIBOR and so forth). The key distinction between dollar deposits held at foreign banks vs domestic banks is that foreign deposits don’t benefit from deposit insurance. So rising foreign deposit rates relative to domestic rates is often an indication of emerging stress in the global banking system. We’re closely monitoring financial stocks in Europe and elsewhere as a result.
The expansion of dodgy liabilities in the recent debt cycle has been very aggressive, particularly in the areas of leveraged loans (loans to already indebted borrowers) and covenant-lite debt (which provides limited protection for lenders in the event of bankruptcy). We’re not quite pounding the tables about immediate risk, but the divergences we observe in this area do contribute to our assessment of increasing risk-aversion among investors.
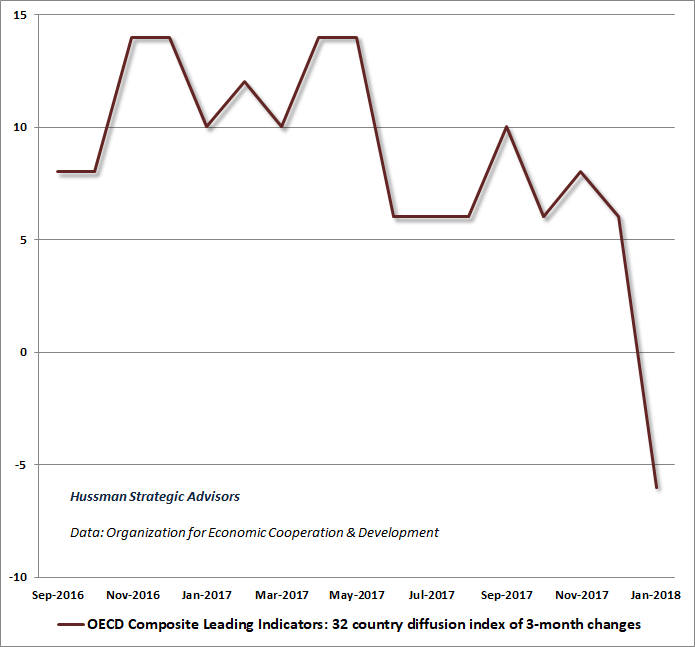
Finally, we also observe a shift in the behavior of leading indicators across developed economies. While the perception of investors is that the global economy is in a “synchronized global expansion,” it’s worth noting that the plurality of leading global economic indicators has turned markedly downward in recent months. The chart below illustrates this deterioration. My friend Lakshman Achuthan at ECRI has made similar observations based on his own set of measures.
Again, we’re not quite pounding the tables about immediate risk, and our recession warnings aren’t yet active, but the recent deterioration is certainly worth watching. We’re already defensive based on offensively extreme valuations and unfavorable market internals, so there’s no particular risk in allowing this to play out to a greater extent before expressing more pointed concerns about economic prospects.
Keep Me Informed
Please enter your email address to be notified of new content, including market commentary and special updates.
Thank you for your interest in the Hussman Funds.
100% Spam-free. No list sharing. No solicitations. Opt-out anytime with one click.
By submitting this form, you consent to receive news and commentary, at no cost, from Hussman Strategic Advisors, News & Commentary, Cincinnati OH, 45246. https://www.hussmanfunds.com. You can revoke your consent to receive emails at any time by clicking the unsubscribe link at the bottom of every email. Emails are serviced by Constant Contact.
The foregoing comments represent the general investment analysis and economic views of the Advisor, and are provided solely for the purpose of information, instruction and discourse.
Prospectuses for the Hussman Strategic Growth Fund, the Hussman Strategic Total Return Fund, the Hussman Strategic International Fund, and the Hussman Strategic Dividend Value Fund, as well as Fund reports and other information, are available by clicking “The Funds” menu button from any page of this website.
Estimates of prospective return and risk for equities, bonds, and other financial markets are forward-looking statements based the analysis and reasonable beliefs of Hussman Strategic Advisors. They are not a guarantee of future performance, and are not indicative of the prospective returns of any of the Hussman Funds. Actual returns may differ substantially from the estimates provided. Estimates of prospective long-term returns for the S&P 500 reflect our standard valuation methodology, focusing on the relationship between current market prices and earnings, dividends and other fundamentals, adjusted for variability over the economic cycle.