

Whatever They’re Doing, It’s Not “Investment”


John P. Hussman, Ph.D.
President, Hussman Investment Trust
February 2020
Strictly speaking, there can be no such thing as an ‘investment issue’ in the absolute sense, i.e., implying that it remains an investment regardless of price… Had the same attitude been taken by the purchaser of common stocks in 1928-1929, the term ‘investment’ would not have been the tragic misnomer that it was. But in proudly applying the designation ‘blue chips’ to the high-priced issues chiefly favored, the public unconsciously revealed the gambling motive at the heart of its supposed investment selections.
– Benjamin Graham & David Dodd, Security Analysis
At the market open of Friday, January 24, our estimate of likely 12-year nominal total returns for a conventional passive investment portfolio (60% S&P 500, 30% Treasury bonds, 10% Treasury bills) fell to just 0.04% annually, below even the previous record of 0.34% set in August 1929. This extreme reflects the combination of record equity market valuations and depressed interest rates. That’s not an “equilibrium” situation. It’s a combination that joins insult with injury, creating weak prospects for the future returns of passive, diversified buy-and-hold strategies, across the board.
Understand this. The more glorious this bubble becomes in hindsight, the more dismal future investment returns become in foresight. The higher the price investors pay for a set of future cash flows, the lower the return they will enjoy over time. Investment is not independent of price. Whatever they’re doing, it’s not “investment.”
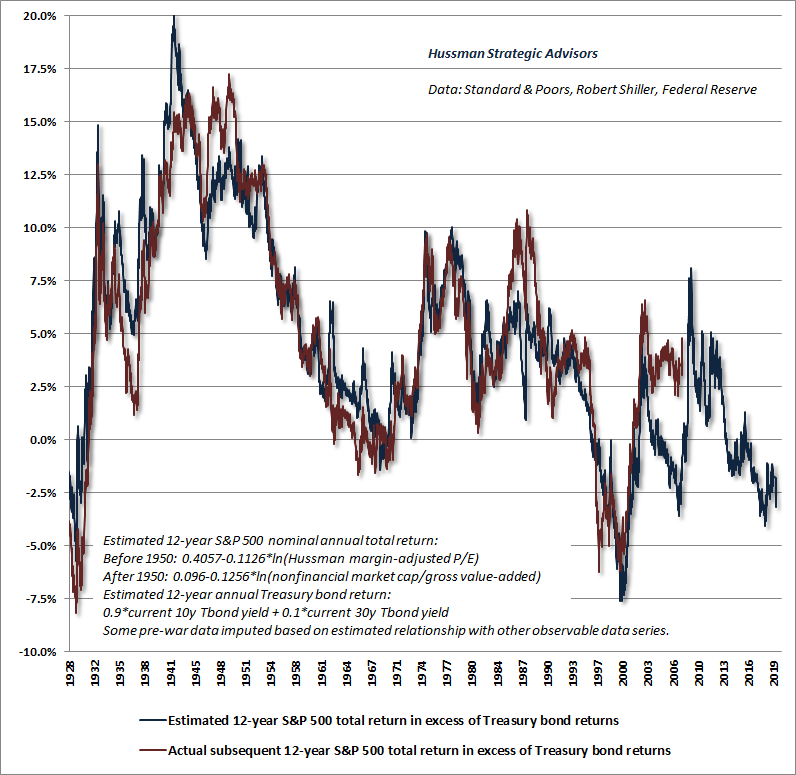
The chart below shows our estimate of 12-year total returns on a conventional passive investment mix (blue) along with actual subsequent returns. As I’ve often noted, we use a 12-year horizon because that is the point where the “autocorrelation” of reliable valuation measures typically hits zero, meaning that overvaluation or undervaluation at one point becomes uncorrelated with later valuations. So “mean reversion” is most likely on a 12-year horizon. That said, valuation extremes like 1929 and 2000, along with lesser extremes like 2007, have generally been followed by profound market losses (and associated spikes in expected future returns) over a much shorter time frame.
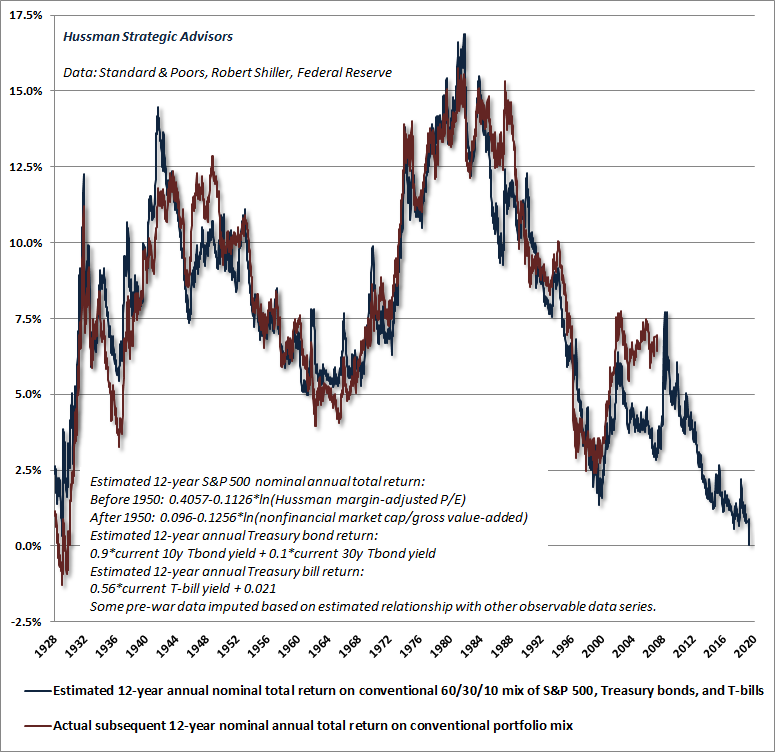
I’ve regularly observed that at the peak of every valuation bubble, recent returns have invariably been greater than one might have projected several years earlier, because the advance to hypervaluation produces temporary returns that are later erased. That’s why, for example, actual returns were higher during the 12-year period from 1988-2000 than one would have projected in 1988, and it’s why actual returns have been higher during the recent 12-year period than one would have projected 12 years ago. The problem, as investors should recall from the 2000-2002 and 2007-2009 collapses, is that the extra returns from those “errors” are invariably erased.
Still, it’s useful to understand how far below-average the returns of the S&P 500 are likely to be in the coming years even if valuations don’t normalize at all, and instead remain at their present extremes forever. As I’ve detailed before (and review below), the U.S. economy is presently running at a structural real GDP growth rate of only about 1.6%, reflecting the combination of demographic labor force growth and trend productivity. That’s the real economic growth that we would observe if the rate of unemployment was simply held constant at current lows indefinitely.
Add 2% inflation, and you’re up to 3.6% nominal growth (which is also the nominal growth rate of S&P 500 revenues over the past two decades). Add a 2% dividend yield, and we can estimate – assuming that market valuations remain at current extremes forever – the S&P 500 would achieve total returns averaging 5.6% annually. Even one episode of significant risk-aversion, and that requirement will be violated.
Investors may not like the idea that record extremes in future market valuations will be required in order for the S&P 500 to produce even 5.6% annual returns, but see, that’s exactly how the S&P 500 has produced a similar total return since March 2000. Specifically, at the end of 2019, the price/revenue ratio of the S&P 500 pushed to the same extreme we observed in March 2000. Meanwhile, S&P 500 revenues have grown at an average annual rate of 3.6% since 2000 (a figure that includes all the benefits of stock repurchases during the past two decades), while the S&P 500 dividend yield has averaged 2%.
Two weeks ago, the S&P 500 price/revenue ratio clawed its way to the steepest extreme in U.S. history. Having done so, investors now require market valuations to maintain a “permanently high plateau” at this level in order for continued growth in GDP, revenues, and dividends to collectively produce S&P 500 total returns of even 5.6% annually.
The chart below shows the current price/revenue extreme for the S&P 500.
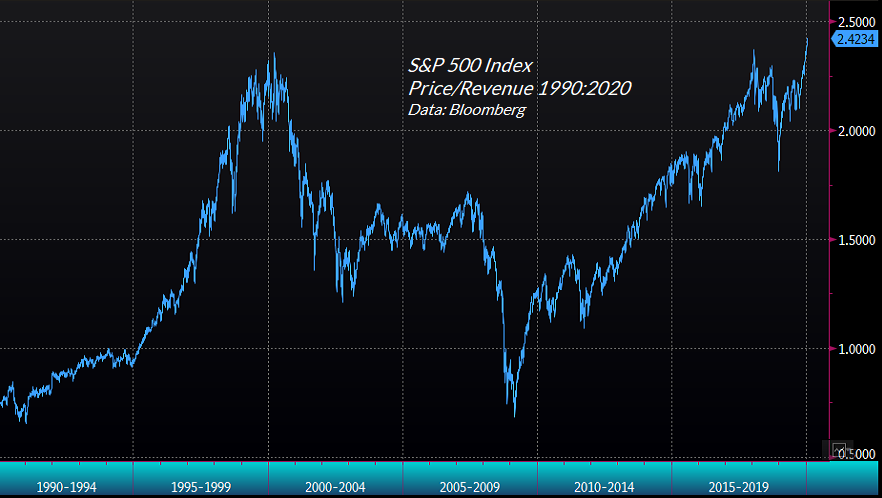
The more glorious this bubble becomes in hindsight, the more dismal future investment returns become in foresight. The higher the price investors pay for a set of future cash flows, the lower the return they will enjoy over time. Investment is not independent of price. Whatever they’re doing, it’s not ‘investment.’
Given the current 10-year Treasury bond yield of about 1.6%, and the 3-month Treasury bill yield of about 1.5%, the maintenance of current valuation extremes, a decade from today, would still produce likely returns on a passive investment portfolio (60% stocks, 30% bonds, 10% T-bills) of just 4% annually.
More likely, assuming that market valuations simply touch their run-of-the-mill historical norms in the future, passive investors should be braced for zero or negative total returns both in the S&P 500 and in a conventional 60/30/10 asset mix over the coming 10-12 year horizon.
This is basic arithmetic. Allow market valuations to slip at all, and likely S&P 500 total returns will slip as well. Annualize the slip in valuations over whatever holding period you’re considering, and you’ll get a reasonable estimate of the impact on likely market returns.
So if market valuations, which are presently about triple their historical norms on the most reliable measures, simply move to double their historical norms a decade from today, the implied 10-year annual total return for the S&P 500 would be roughly (1.036)*(2/3)^(1/10)-1+.02 = 1.48% annually.
Simply touching the historical norm – not even reaching historically undervalued levels – would imply a 10-year annual total return for the S&P 500 of roughly (1.036)*(1/3)^(1/10)-1+.02 = -5.18% annually.
Whatever they’re doing, it’s not “investment.”
As Graham and Dodd argued, “It is unsound to think always of investment character as inhering in an issue per se. The price is frequently an essential element, so that a stock (and even a bond) may have investment merit at one price level but not another.”
Amidst an “everything bubble” that has touched every asset class, I don’t believe that investors should imagine that there is some broadly appropriate investment that promises a satisfactory return despite such broad extremes. Even international stocks tend to lose significant value when U.S. stocks decline, regardless of their valuations. Yes, there may be niches that could be useful for diversification, but the primary “alternative” that investors have here, in my view, is cash, patience, and hedged investment exposure.
Look again at the spikes of estimated 12-year returns for a conventional asset mix. Those periodic spikes represent market retreats of one extent or another. As I’ve regularly noted, the strongest market return/risk profiles we identify are typically associated with a material retreat in valuations that is joined by an early improvement in market action. Those are the opportunities that I believe will be most rewarding to investors over the completion of this cycle.
Meanwhile, as Graham and Dodd also observed:
“In our view it is also proper to consider as investment operations certain types of arbitrage and hedging commitments which involve the sale of one security against the purchase of another… This is an extension of the ordinary concept of investment, but one which appears to the writers to be entirely logical.”
Inflation won’t bail investors out
Investors should not imagine that inflation would improve the situation. Historically, the first casualty of inflation is market valuations. With the most reliable measures of market valuation presently between 2.7 and 3.2 times their historical norms, the CPI would have to roughly triple before the beneficial effects of inflation on nominal growth would outweigh the negative effects of inflation on market valuations. Until that happens, higher inflation will only make matters worse for investors.
The fact is that cash – short-term interest-bearing liquidity – has clearly outperformed the stock market during periods of rising inflation. Indeed, when the rate of inflation is rising, higher rates of inflation are typically associated with poorer stock market performance until market valuations are driven to historically depressed levels (after which the effect of inflation on nominal growth finally dominates).
The chart below shows the cumulative total return of the S&P 500 along with the cumulative total return of 3-month Treasury bills during periods when the CPI rate of inflation was higher than 2% and above its level of 6 months earlier.
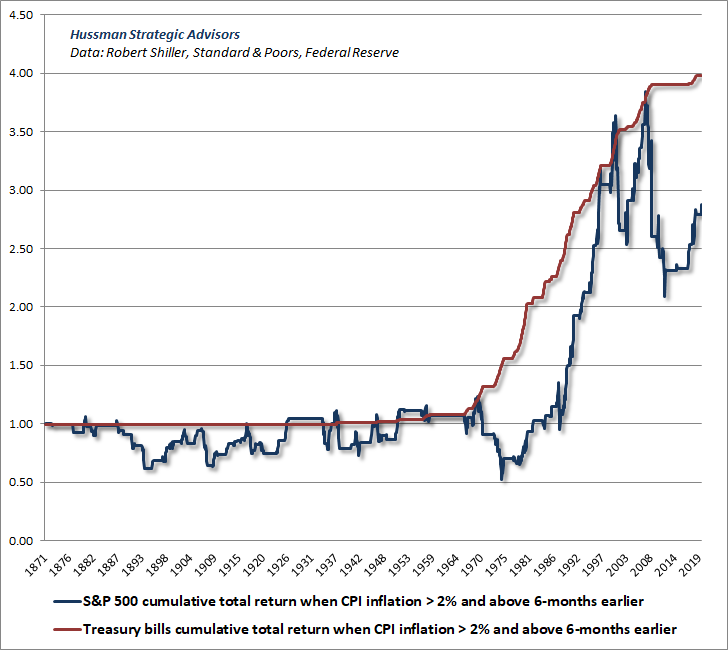
Here is the same total return comparison between the S&P 500 and 3-month Treasury bills when the CPI rate of inflation was higher than 4% and above its level of 6 months earlier.
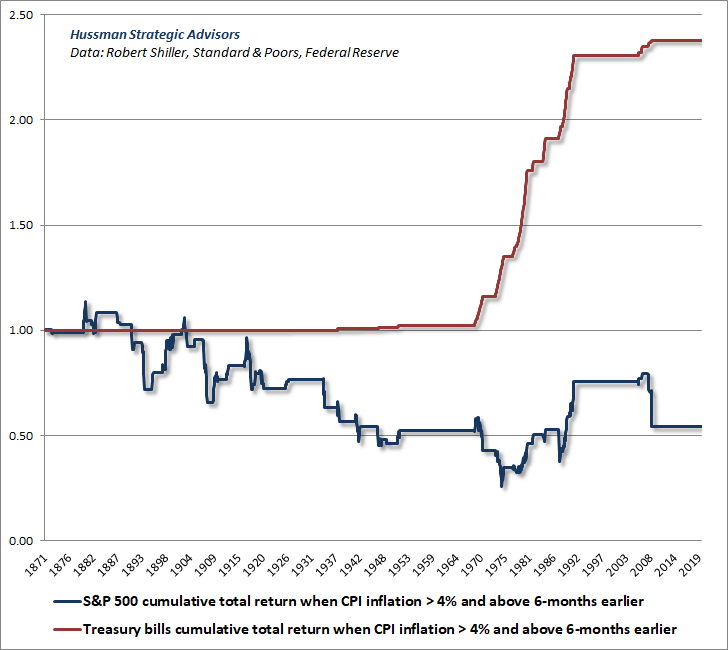
Same story when the CPI rate of inflation was higher than 6% and above its level of 6 months earlier.
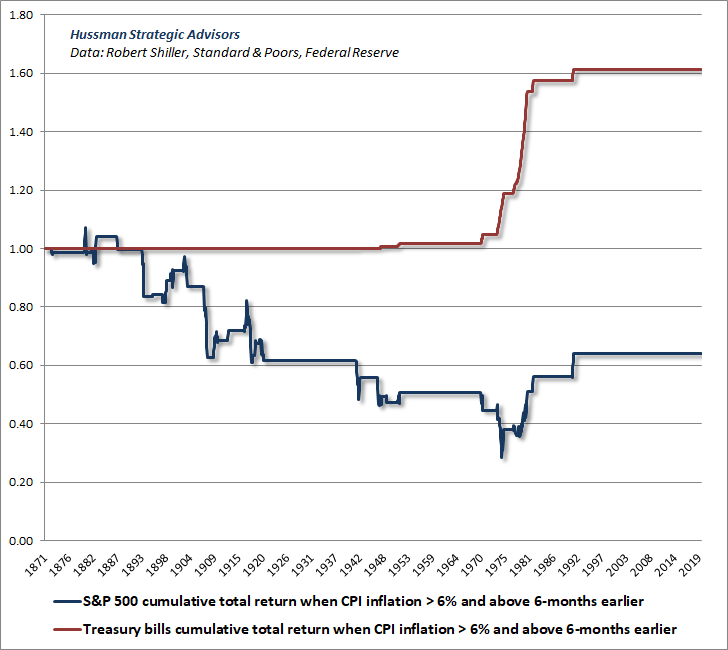
The CPI would have to roughly triple before the beneficial effects of inflation on nominal growth would outweigh the negative effects of inflation on market valuations. Until that happens, higher inflation will only make matters worse for investors.
Put simply, rising inflation is not your friend, particularly in an overvalued market. Based on a century of market history, investors are left with a much different proposition:
For the S&P 500 to enjoy anything but depressed long-term returns and profound interim losses in the years ahead, we expect that investors will require the absence of any significant episode of risk-aversion, and the maintenance or extension of current valuation extremes, for decades.
Public health note
With respect to recent concerns regarding coronavirus, apart from counting it among numerous factors that can foster risk-aversion, I have no market-related observations to contribute. While it’s part of the job to evaluate how various events may affect the markets and individual securities, I have a certain disdain for those who revel in touting “opportunities” from such things.
From a public health perspective, Johns Hopkins has provided an important tracking tool related to coronavirus, available here.
With regard to changes in public health risks, it may be useful to monitor the 5-day rate of expansion, currently running about 1.5x daily, along with the location of cases and mortality rate (fatalities/cases). Exclude the current date as many cases are typically added at end-of-day.
Ideally, the expansion rate will slow markedly in the days and weeks ahead. Meanwhile, it’s worth reiterating the recommendations of the CDC. Particularly if cases are identified in your area, take precautions against risk transmitted through air, hands, and surfaces. Presently, the ordinary flu remains a greater health risk in the U.S., so the flu vaccine is no less important (despite the fact that this year’s overlap is imperfect with the strains going around), and it’s best to avoid groups – especially the elderly – if you’re feeling under the weather.
Valuation review
The following charts show two of the most reliable market valuation measures that we’ve studied or introduced over time. Both are better-correlated with actual subsequent stock market returns across history than numerous alternatives, including price/forward-earnings, the Shiller cyclically-adjusted P/E (CAPE), and the so-called Fed Model, among others.
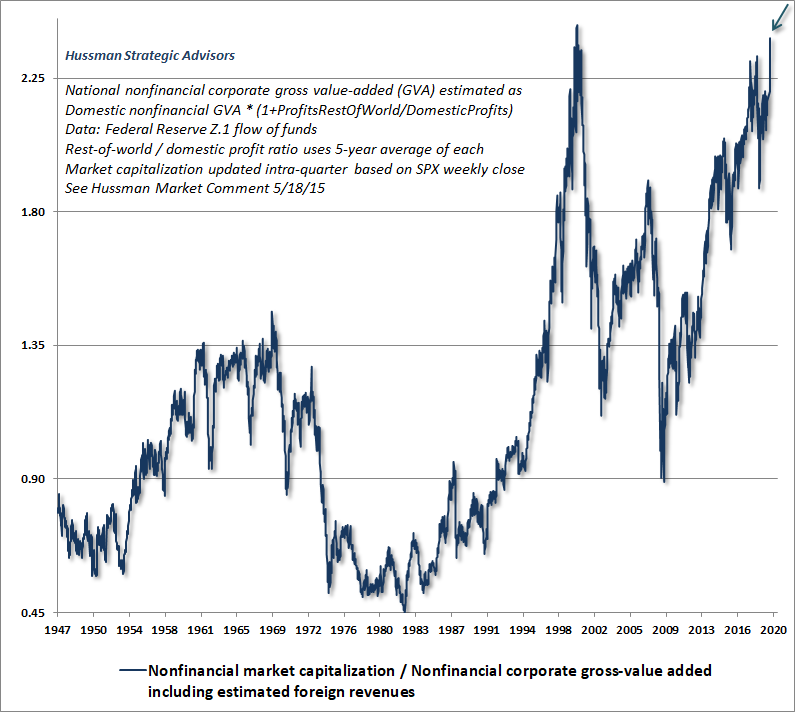
The first chart below shows the ratio of nonfinancial market capitalization to corporate gross value-added, including estimated foreign revenues. I introduced this valuation measure in 2015, and it remains the measure that we find best-correlated with actual subsequent market returns across history. In recent weeks, this measure has moved to extremes implying negative estimated total returns for the S&P 500 on both 10-year and 12-year horizons.
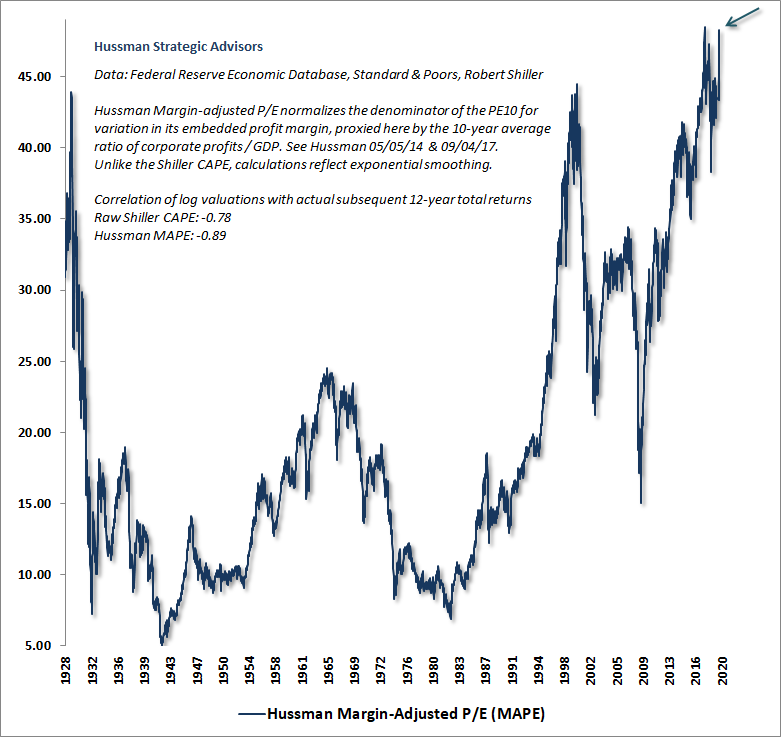
Our Margin-Adjusted P/E (MAPE) is nearly as reliable as MarketCap/GVA and spans a much longer history to the early-1900’s. Notably, this measure has moved to extremes that eclipse both peaks observed in 1929 and 2000.
Of course, if overvaluation itself was enough to drive prices lower, one could never observe extremes like 1929, 2000, and today, because the market would have been weighed down by far lesser extremes. Graham and Dodd made the same observation nearly a century ago in their bible of value investing, Security Analysis. Even as they counseled analysts to discourage investors from speculating at extreme valuations, they wrote:
“There will be a number of individual instances in which this important principle will seem to work out poorly because the average price of the future will be much higher than the level at which the analyst counseled the sale. Our experience tells us that such occurrences, while very plausible, are exceptional and delusive. If they did not happen the market would never go to its extremes. They resemble the cases of large winnings at roulette, without which encouragement there would be no customers for the wheel.”
Nonetheless, Graham and Dodd advised that “the analyst will perform his best service by keeping them from buying inferior stocks during periods of enthusiasm and high prices. His next service is to induce them to buy their standard issues when the market level is below, rather than above its indicated long-term normal figure. His third service is to guard the investor from paying extremely high prices for good stocks.”
The only thing I’d add is [or her].
Gauging speculation
Across history, and even in recent cycles, market valuations have remained extremely informative about long-term market returns on a 10-12 year horizon, as well as potential market losses over the completion of a given market cycle.
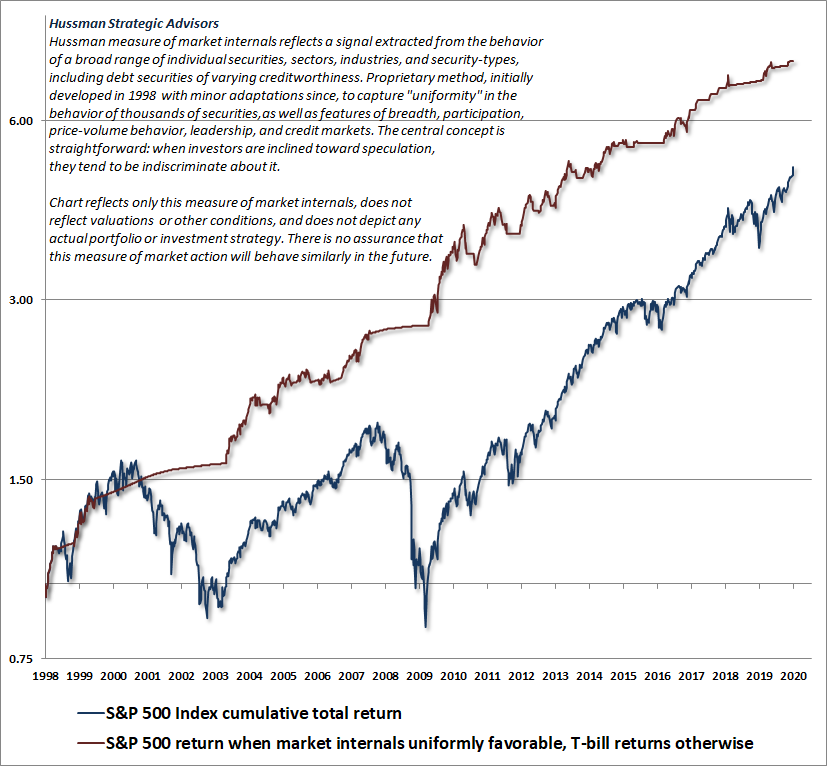
At the same time, however, market returns over shorter segments of the market cycle are driven by the psychology of investors – specifically, their inclination toward speculation or risk-aversion. For our part, the best measure we’ve identified to gauge that psychology is the “uniformity” of market internals, which we infer from the collective behavior of thousands of individual stocks, industries, sectors, and security-types, including debt securities of varying creditworthiness.
The central idea behind our measure of market internals, which I first introduced in 1998, is that when investors are inclined to speculate, they tend to be indiscriminate about it.
Unlike valuations, where we are extremely open about our methods, our measure of internals is one of the few things I keep “proprietary.” That’s because shifts in internals are very discrete, and one doesn’t want to respond to market behavior at the exact moment everyone else does. That said, I’m very open about the underlying principle: speculation tends to be indiscriminate. Our own methods involve a very broad signal-extraction from market behavior, but the general features can be captured by examining multiple concepts of “uniformity” – breadth (advancing/declining issues), participation (% of stocks moving jointly), leadership (new highs/lows), price-volume behavior (sponsorship), trend and momentum-related indicators, credit spreads, and similar measures.
The chart below presents the cumulative total return of the S&P 500 in periods where our measures of market internals have been favorable, accruing Treasury bill interest otherwise. The chart is historical, does not represent any investment portfolio, does not reflect valuations or other features of our investment approach, and is not an assurance of future outcomes.
As I always detail openly, my key error during the recent advancing half-cycle hinged on one specific feature of our investment discipline. In market cycles across history, extremely “overvalued, overbought, overbullish” syndromes of market conditions generally signaled that speculation had reached its reliable “limit.” Because of that reliability, we had prioritized those syndromes following our 2009-2010 stress-testing exercise against Depression-era data.
In hindsight, amid the novelty of quantitative easing and zero-interest rate policy, our pre-emptive bearish response to those syndromes turned out to be detrimental. In late-2017, we abandoned the notion that it was still possible to define any “limit” to speculation. Since then, our requirement has been straightforward: regardless of how extreme valuations or other conditions might become, we will defer adopting or amplifying a “bearish” investment outlook unless our measures of internals have explicitly deteriorated. Some conditions may be extreme enough to justify a neutral outlook, but a bearish outlook requires deterioration in internals, signaling a subtle shift toward risk-aversion among investors.
Both valuations and internals performed beautifully in the recent market cycle. It was my reliance on historically-reliable overvalued, overbought, overbullish “limits” that proved detrimental. We addressed that issue in late-2017. The main headwind since then has been internal dispersion, with speculators favoring richly valued glamour stocks and the largest components of passive indices, rather than broad value-conscious stock selection. Still, that tends to be a regular feature of late-stage advances, followed by losses over the completion of the cycle.
The best opportunities to embrace stocks and substantially increase market exposure tend to be associated with a material retreat in valuations that is then joined by improvement in market internals. Shifts in internals that occur at extremely overextended points in the cycle tend to be whipsaws, and those instances, our response is more neutral. In any case, regardless of how breathtaking market overvaluation might become, even in the presence of “overvalued, overbought, overbullish” warning signs, we’ve learned not to fight uniformly favorable market internals with a bearish outlook.
Presently, we observe the combination of hypervaluation and negative market internals, which I view as a “trap door” situation.
The New Era
The most striking similarity between the 1920’s and 1990’s bull markets is the notion that traditional measures of stock valuation had become obsolete.
– Edward Chancellor, Devil Take the Hindmost, 1999
Faced with hypervalued extremes on historically reliable valuation measures, the first refuge of speculators is always to justify valuations on the argument that “this time is different.”
As J.K. Galbraith wrote in The Great Crash, recounting the 1929 market collapse:
“The market will not go on a speculative rampage without some rationalization. But during any future boom some newly rediscovered virtuosity of the free enterprise system will be cited. It will be pointed out that people are justified in paying the present prices – indeed, almost any price – to have an equity position in the system.”
Since two of the most common appeals to “this time it’s different” relate to interest rates and profit margins, a few observations may be helpful.
First, while low interest rates may very well encourage rich stock valuations, those rich stock valuations have the function of reducing likely future returns on stocks. For any given amount of future cash, if one can observe the price being paid today, one can directly calculate the implied rate of return embedded in that price. No further “adjustment” for interest rates is required.
The implied rate of return on stocks can certainly be compared with the level of interest rates, but understand that, for a given set of cash flows, higher valuations directly imply lower future returns. The chart below shows our estimate, across history, of the likely total return of the S&P 500 over and above Treasury bond yields (the so-called “equity risk premium”). Presently, we expect the S&P 500 to lag Treasury bonds by nearly 3% annually over the coming 12-year horizon.
As a side note, be careful not to confuse this estimate of the equity risk premium (“ERP”) with the measure preferred by Wall Street, which simply takes the difference between the S&P 500 forward operating earnings yield and the 10-year Treasury bond yield. That measure is nearly useless, and has a strikingly weak correlation with actual subsequent market outcomes.
A second, equally important point is that if interest rates are low because growth rates are also low, no valuation premium is “justified” by the low interest rates at all. Stocks will produce a competitively low return by virtue of the depressed growth rate. Elevating valuations in that situation only adds insult to injury.
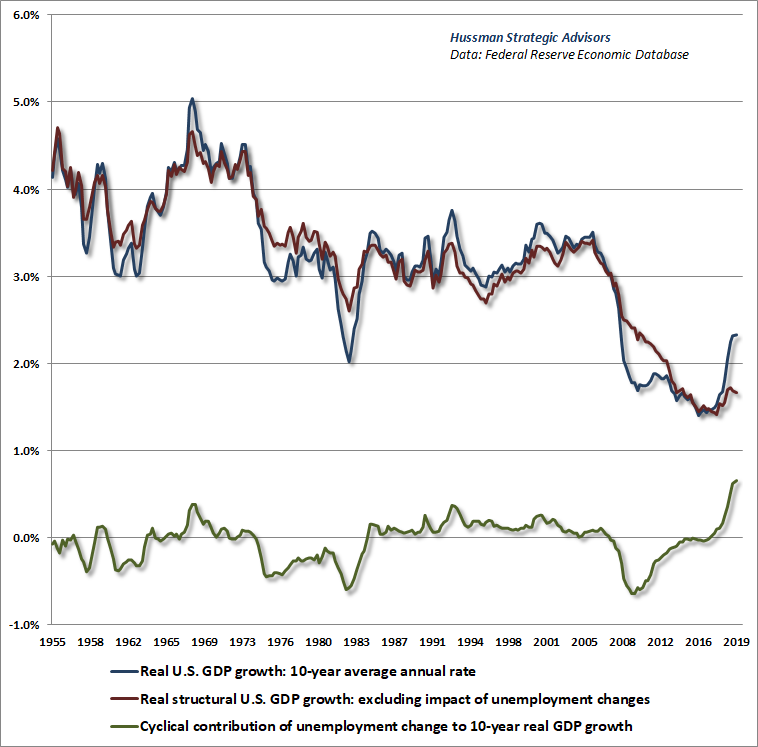
The chart below updates our estimate of structural U.S. GDP growth (red line), which is the rate at which the U.S. economy would be expected to grow if the rate of unemployment was simply held constant. In recent decades, due to changes in population growth and trend productivity, real structural U.S. GDP growth has declined to just 1.6% annually.
During the past decade, all U.S. real GDP growth above that 1.6% structural rate has been due to an enormous contribution (green line) from falling unemployment, from a level of 10% in the depths of the global financial crisis, to a recent low of 3.5%. There is little fuel remaining in that “cyclical” engine.
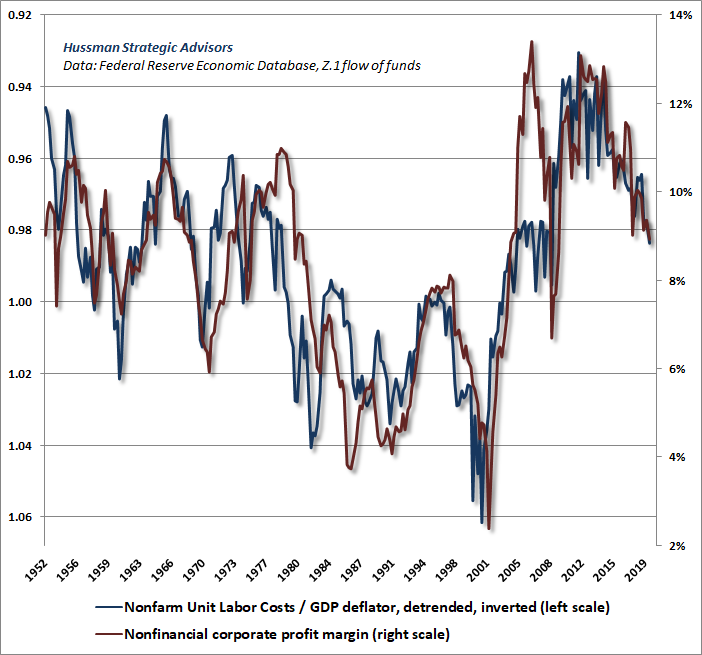
With regard to profit margins, it’s important for investors to recognize that above-average profit margins of recent years were the mirror image of depressed real unit labor costs that followed the surge in unemployment after the global financial crisis, and that this labor market slack has now been taken up, placing clear downward pressure on nonfinancial profit margins.
Moreover, we know from prior market cycles that profit margins for the S&P 500 itself tend to lag declines in economy-wide margins, so the compression we observe on this front should be taken as a warning on that front.
The chart below shows U.S. real unit labor costs on an inverted left scale (blue) along with U.S. nonfinancial profit margins on the right scale (red). Nothing about this relationship has “broken down” in recent years. At an unemployment rate of just 3.5%, investors are likely to enjoy neither large contributions to real GDP growth above our structural estimate of 1.6%, nor an expansion in profit margins – except following a downturn that produces fresh labor market slack.
The fact is that across dozens of valuation measures we’ve studied or introduced over time, the measures we find best correlated with actual subsequent S&P 500 total returns in market cycles across history are MarketCap/GVA (nonfinancial market cap/corporate gross value added, including estimated foreign revenues) and our Margin-Adjusted P/E (MAPE). Both function largely as market-wide, apples-to-apples price/revenue ratios. When you invest in stocks, you’re not buying next year’s earnings, or even a few years of earnings. You’re buying decades, and decades, and decades of them.
To ignore historically reliable valuation measures – in favor of unreliable ones that benefit from current extremes in profit margins – is to fall into the same trap laid before investors at the peak of every market cycle in history. As Benjamin Graham warned, “Observation over many years has taught us that the chief losses to investors come from the purchase of low-quality securities at times of good business conditions. The purchasers view the good current earnings as equivalent to ‘earning power’ and assume that prosperity is equivalent to safety.”
What if this time really is different anyway?
Fortunately, we don’t need to rule out the possibility that “this time is different” in a positive way. Our assertion is instead that nearly all of the factors that might make this time “different” are likely to exert their effect through price behavior, and specifically, through the uniformity or divergence of market internals. We have the ability to monitor and respond to that directly.
It’s worth recognizing that the entire total return of the S&P 500 during even the most recent market cycle has occurred during periods when our measures of market internals were uniformly constructive. The majority of the 2007-2009 collapse (as well as significant corrections since then) occurred when they were not.
Understand the late-2017 change in our investment discipline. Our challenges during the advancing half-cycle since 2009 related to our pre-emptive bearish response to “overvalued, overbought, overbullish” syndromes, which had signaled a reliable “limit” to speculation in previous market cycles across history. In late-2017, we abandoned our willingness to adopt a bearish outlook unless our measures of internals have explicitly deteriorated. Some conditions may be extreme enough to justify a neutral outlook, but a bearish outlook requires deterioration in internals. Since then, the main headwind has been the “Nifty-Fifty” divergence between large-cap glamour stocks and the broader market, which is a regular feature of late-stage market advances.
The condition of internals also helps to distinguish the likely impact of monetary policy changes. For example, as I’ve detailed before, even the impact of monetary policy on the stock market across history – including the most recent market cycle – can be beautifully partitioned based on whether or not our measures of market internals were favorable or unfavorable.
Specifically, there’s no question that stock market returns have been highest in periods when the Fed was easing – provided that market internals were also favorable. Yet stock market returns have also been strong in periods when the Fed was tightening – provided that market internals were also favorable. In contrast, stocks have languished or lost value in periods when market internals were unfavorable – regardless of whether the Fed was easing or tightening. Put another way, in market cycles across history, including the most recent one, the dominant consideration for stocks has been condition of market internals themselves, not the condition of monetary policy per se.
Notably, the Fed eased relentlessly throughout both the 2000-2002 and 2007-2009 market collapses. But when investors are inclined toward risk-aversion, safe liquidity is a desirable asset, not an inferior one, so creating more of the stuff doesn’t encourage speculation. That’s a lesson that I suspect investors are going to re-learn the hard way over the completion of this cycle.
In any event, we see no reason to be afraid of future bouts of quantitative easing, helicopter money, or other extraordinary policies. If our measures of market internals are uniformly favorable, we will not adopt or amplify a bearish investment outlook, regardless of how extreme valuations might become. I’m incredibly hopeful that investors will understand and learn that central lesson – drawn from my error in the recent half-cycle. What concerns me is that many investors seem have drawn the “lesson” that valuations don’t matter, that the Fed is omnipotent, and that stocks are always an “investment,” regardless of the price.
If you want my opinion, that opinion is that current hypervalued extremes are likely to be followed by market losses on the order of two-thirds of value of the S&P 500, with negative S&P 500 nominal total returns on both a 10-year and a 12-year horizon. We don’t rely on that outcome, and we don’t require historically normal valuations as a precondition to embracing market exposure (particularly in periods when market internals are favorable), but that’s honestly what I expect.
I recognize that the notion of a two-thirds market loss (which would only take our most reliable valuation measures to their run-of-the-mill historical norms) seems preposterous. Then again, so did similar projections before the 2000-2002 and 2007-2009 collapses. Though valuations at those peaks implied broad market losses more on the order of 40-50%, the hypervaluation we observed in technology stocks was a different matter:
Over the past 5 years, the revenues of S&P 500 technology companies have grown at a compound annual rate of 12%, while the corresponding stock prices have soared by 56% annually. Over time, price/revenue ratios come back in line. Currently, that would require an 83% plunge in tech stocks (recall the 1969-70 tech massacre). The plunge may be muted to about 65% given several years of revenue growth. If you understand values and market history, you know we’re not joking.
– John P. Hussman, Ph.D., March 7, 2000
As it happened, the tech-heavy Nasdaq 100 lost an implausibly precise 83% of its value from March 2000 to October 2002.
Meanwhile, it’s worth remembering how cycle completions work. The fact is that the S&P 500 did no better than Treasury bills during the period from May 1995 to March 2009, from August 1959 to August 1982, and from August 1929 to August 1945. Within the 80-year period from 1929-2009, the S&P 500 took three long, interesting trips to nowhere, accounting for 53 of those years.
What accounts for those periods is either an extremely elevated beginning valuation or an extremely depressed ending valuation. For example, if one measures from the March 2000 peak, the S&P 500 also underperformed Treasury bills for the following 13-year period, until March 2013. Avoiding a similar period of dismal performance from current valuation extremes requires heroic assumptions.
Then again, heroic assumptions are what “new eras” are all about. At the recent World Economic Forum in Davos, the manager of the world’s largest hedge fund opined that central banks have learned enough lessons that “we’ve probably seen the end of the boom bust cycle.”
Again, provided that we attend carefully to both valuations and market internals, we need not rule out this possibility. Still, words like this are concerning, because they mirror those that have been spoken at every hypervalued pre-collapse market extreme in history.
Consider Edward Chancellor’s narrative of the late-1920’s market, which he published in 1999, offering investors a reminder of the perils that befall investors who come to consider central bankers as maestros and heroes:
“The Federal Reserve, with its ability to control interest rates and conduct ‘open market operations’ – buying and selling government bonds in order to affect the supply of money available to banks – was hailed in the 1920s as ‘the remedy to the whole problem of booms, slumps and panics.’ As a result, bankers and speculators alike were lulled into a false security which led them to operate irresponsibly, exacerbating the severity of the ensuing crisis.
“In 1927, John Moody, founder of the credit ratings agency, declared that ‘no one can examine the panorama of business and finance in America during the past half-dozen years without realizing that we are living in a new era.’ In April of that year, Barron’s, the investment weekly, envisaged a ‘new era without depressions.’
“At the beginning of September, Winston Churchill had arrived in the United States on a lecture tour… On Thursday, 24 October, Churchill was walking down Wall Street when a stranger invited him to enter the visitors’ gallery of the New York Stock Exchange. The panic that unfolded before his eyes had no palpable cause. Unlike former stock market panics, it was not preceded by tightness in the money market. No banking, brokerage, or industrial failures served as a trigger – and yet panic there was.”
Keep Me Informed
Please enter your email address to be notified of new content, including market commentary and special updates.
Thank you for your interest in the Hussman Funds.
100% Spam-free. No list sharing. No solicitations. Opt-out anytime with one click.
By submitting this form, you consent to receive news and commentary, at no cost, from Hussman Strategic Advisors, News & Commentary, Cincinnati OH, 45246. https://www.hussmanfunds.com. You can revoke your consent to receive emails at any time by clicking the unsubscribe link at the bottom of every email. Emails are serviced by Constant Contact.
The foregoing comments represent the general investment analysis and economic views of the Advisor, and are provided solely for the purpose of information, instruction and discourse.
Prospectuses for the Hussman Strategic Growth Fund, the Hussman Strategic Total Return Fund, the Hussman Strategic International Fund, and the Hussman Strategic Allocation Fund, as well as Fund reports and other information, are available by clicking “The Funds” menu button from any page of this website.
Estimates of prospective return and risk for equities, bonds, and other financial markets are forward-looking statements based the analysis and reasonable beliefs of Hussman Strategic Advisors. They are not a guarantee of future performance, and are not indicative of the prospective returns of any of the Hussman Funds. Actual returns may differ substantially from the estimates provided. Estimates of prospective long-term returns for the S&P 500 reflect our standard valuation methodology, focusing on the relationship between current market prices and earnings, dividends and other fundamentals, adjusted for variability over the economic cycle.