

The Arithmetic of Risk


John P. Hussman, Ph.D.
President, Hussman Investment Trust
March 2018
The collapse of major bubbles is often preceded by the collapse of smaller bubbles representing ‘fringe’ speculations. Those early wipeouts are canaries in the coalmine. Once investor preferences shift from speculation toward risk-aversion, extreme valuations should not be ignored, and can suddenly matter to their full extent.
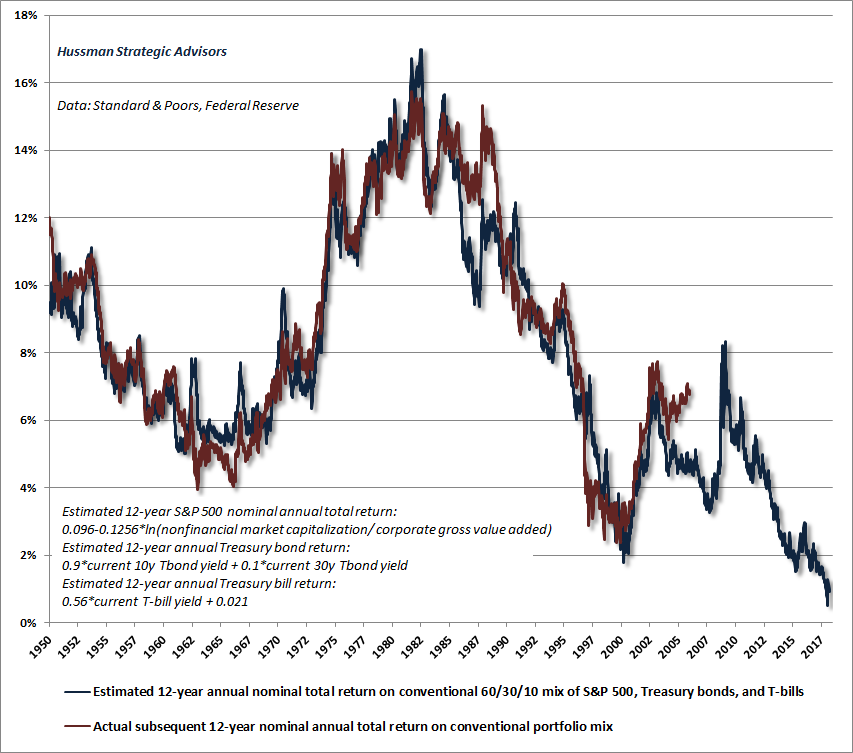
A month ago, I noted that prevailing valuation extremes implied negative total returns for the S&P 500 on 10-12 year horizon, and losses on the order of two-thirds of the market’s value over the completion of the current market cycle. With our measures of market internals constructive, on balance, we had maintained a rather neutral near-term outlook for months, despite the most extreme “overvalued, overbought, overbullish” syndromes in U.S. history. Still, I noted, “I believe that it’s essential to carry a significant safety net at present, and I’m also partial to tail-risk hedges that kick-in automatically as the market declines, rather than requiring the execution of sell orders. My impression is that the first leg down will be extremely steep, and that a subsequent bounce will encourage investors to believe the worst is over.”
On February 2nd, our measures of market internals clearly deteriorated, shifting market conditions to a combination of extreme valuations and unfavorable market internals, coming off of the most extremely overextended conditions we’ve ever observed in the historical data. At present, I view the market as a “broken parabola” – much the same as we observed for the Nikkei in 1990, the Nasdaq in 2000, or for those wishing a more recent example, Bitcoin since January.
Two features of the initial break from speculative bubbles are worth noting. First, the collapse of major bubbles is often preceded by the collapse of smaller bubbles representing “fringe” speculations. Those early wipeouts are canaries in the coalmine. For example, in July 2000, the Wall Street Journal ran an article titled (in the print version) “What were we THINKING?” – reflecting on the “arrogance, greed, and optimism” that had already been followed by the collapse of dot-com stocks. My favorite line: “Now we know better. Why didn’t they see it coming?” Unfortunately, that article was published at a point where the Nasdaq still had an 80% loss (not a typo) ahead of it.
Similarly, in July 2007, two Bear Stearns hedge funds heavily invested in sub-prime loans suddenly became nearly worthless. Yet that was nearly three months before the S&P 500 peaked in October, followed by a collapse that would take it down by more than 55%.
Observing the sudden collapses of fringe bubbles today, including inverse volatility funds and Bitcoin, my impression is that we’re actually seeing the early signs of risk-aversion and selectivity among investors. The speculation in Bitcoin, despite issues of scalability and breathtaking inefficiency, was striking enough. But the willingness of investors to short market volatility even at 9% was mathematically disturbing.
See, volatility is measured by the “standard deviation” of returns, which describes the spread of a bell curve, and can never become negative. Moreover, standard deviation is annualized by multiplying by the square root of time. An annual volatility of 9% implies a daily volatilty of about 0.6%, which is like saying that a 2% market decline should occur in fewer than 1 in 2000 trading sessions, when in fact they’ve historically occurred more often than 1 in 50. The spectacle of investors eagerly shorting a volatility index (VIX) of 9, in expectation that it would go lower, wasn’t just a sideshow in some esoteric security. It was the sign of a market that had come to believe that stock prices could do nothing but advance in an upward parabolic trend, with virtually no risk of loss.
As I’ve emphasized in prior market comments, valuations are the primary driver of investment returns over a 10-12 year horizon, and of prospective losses over the completion of any market cycle, but they are rather useless indications of near-term returns. What drives near-term outcomes is the psychological inclination of investors toward speculation or risk-aversion. We infer that preference from the uniformity or divergence of market internals across a broad range of securities, sectors, industries, and security-types, because when investors are inclined to speculate, they tend to be indiscriminate about it. This has been true even in the advancing half-cycle since 2009.
The only difference in recent years was that, unlike other cycles where extreme “overvalued, overbought, overbullish” features of market action reliably warned that speculation had gone too far, these syndromes proved useless in the face of zero interest rates. Evidently, once interest rates hit zero, so did the collective IQ of Wall Street. We adapted incrementally, by placing priority on the condition of market internals, over and above those overextended syndromes. Ultimately, we allowed no exceptions.
The proper valuation of long-term discounted cash flows requires the understanding that if interest rates are low because growth rates are also low, no valuation premium is “justified” by the low interest rates at all. It requires consideration of how the structural drivers of GDP growth (labor force growth and productivity) have changed over time.
Careful, value-conscious, historically-informed analysis can serve investors well over the complete market cycle, but that analysis must also include investor psychology (which we infer from market internals). In a speculative market, it’s not the understanding of valuation, or economics, or a century of market cycles that gets you into trouble. It’s the assumption that anyone cares.
The important point is this: Extreme valuations are born not of careful calculation, thoughtful estimation of long-term discounted cash flows, or evidence-based reasoning. They are born of investor psychology, self-reinforcing speculation, and verbal arguments that need not, and often do not, hold up under the weight of historical data. Once investor preferences shift from speculation toward risk-aversion, extreme valuations should not be ignored, and can suddenly matter to their full extent. It appears that the financial markets may have reached that point.
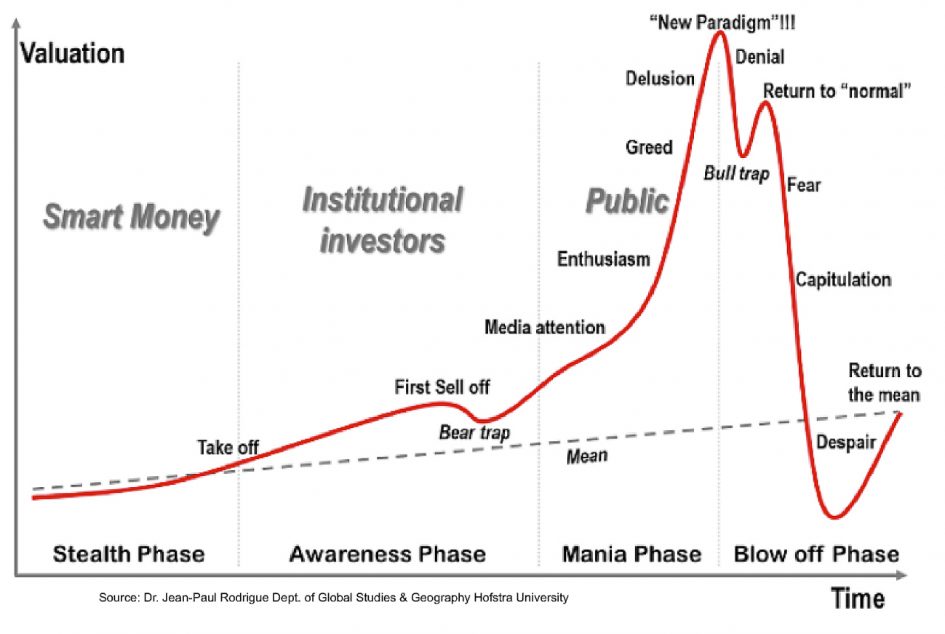
A second feature of the initial break from a speculative bubble, which I observed last month, is that the first leg down tends to be extremely steep, and a subsequent bounce encourages investors to believe that the worst is over. That feature is clearly evident when we examine prior financial bubbles across history. Dr. Jean-Paul Rodrigue describes an idealized bubble as a series of phases, including that sort of recovery from the initial break, which he describes as a “bull trap.”
I continue to expect the S&P 500 to lose about two-thirds of its value over the completion of the current market cycle. With market internals now unfavorable, following the most offensive “overvalued, overbought, overbullish” combination of market conditions on record, our market outlook has shifted to hard-negative. Rather than forecasting how long present conditions may persist, I believe it’s enough to align ourselves with prevailing market conditions, and shift our outlook as those conditions shift. That leaves us open to the possibility that market action will again recruit the kind of uniformity that would signal that investors have adopted a fresh willingness to speculate. We’ll respond to those changes as they arrive (ideally following a material retreat in valuations). For now, buckle up.
Valuation Review
One fact often lost on investors during a bubble is that a security is nothing but a claim on the very, very long-term stream of cash flows that will be delivered into the hands of investors over time. A valuation ratio is nothing more than a shorthand for a proper discounted cash flow analysis. So whenever one measures valuation using the ratio of price to some fundamental, the essential requirement is that the “fundamental” one chooses must be representative of that very, very long-term stream of future cash flows.
While earnings are certainly necessary to generate those cash flows over time, current and “forward” earnings have historically been very poor “sufficient statistics” for those long-term cash flows. If we examine a wide range of alternatives across history, we actually find that – for the market in aggregate – revenues are far better “sufficient statistics” than earnings. Having detailed this at length, across a century of U.S. data, please see my prior market comments for the extensive evidence on this point.
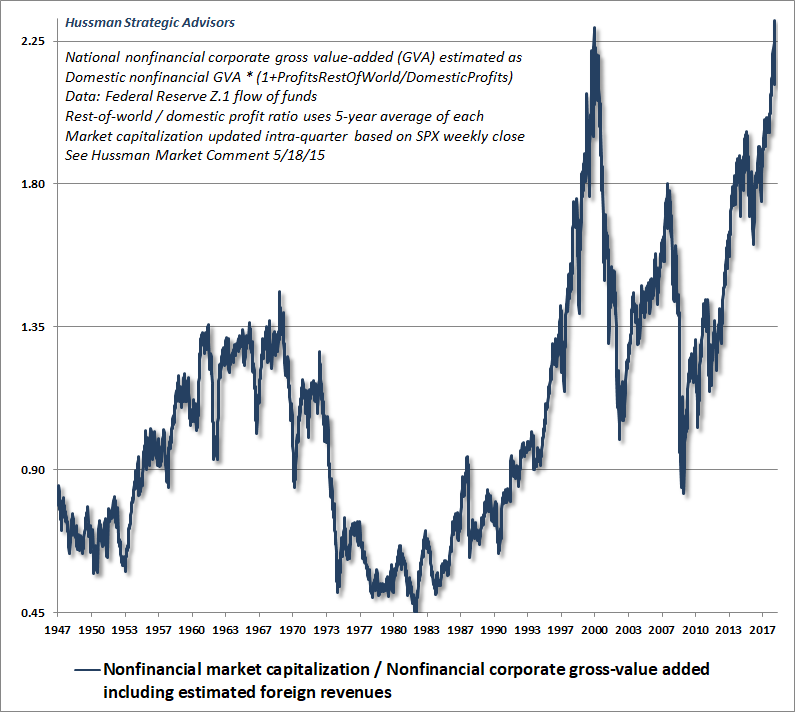
The chart below shows the ratio of nonfinancial market capitalization to corporate gross value-added, including estimated foreign revenues. I created this measure in 2015 as a better-performing and apples to-apples refinement of market capitalization/GDP, which Warren Buffett discussed in 2001 as “probably the best single measure of where valuations stand at any given moment.” We find Nonfinancial MarketCap/GVA to be more strongly correlated with actual subsequent S&P 500 total returns across history, and even in recent market cycles, than any other valuation measure we have studied or introduced. These other measures include price/earnings, price/forward operating earnings, the Fed Model, Tobin’s Q, and Robert Shiller’s cyclically-adjusted P/E, among others.
Specifically, log(MarketCap/GVA) has a correlation of about -0.93 with subsequent 12-year S&P 500 total returns. The correlation is negative because higher valuations imply lower subsequent market returns. Recently, this ratio climbed to the highest level in history, exceeding the peaks observed in 2000 and 2007. Based on other reliable measures for which historical data is available, present market valuations also exceed those observed at the 1929 peak.
The next chart broadens the analysis to include several valuation measures that we find most reliably correlated with actual subsequent market returns. In this chart, valuations are presented in the form of percentage deviations from their pre-bubble norm.
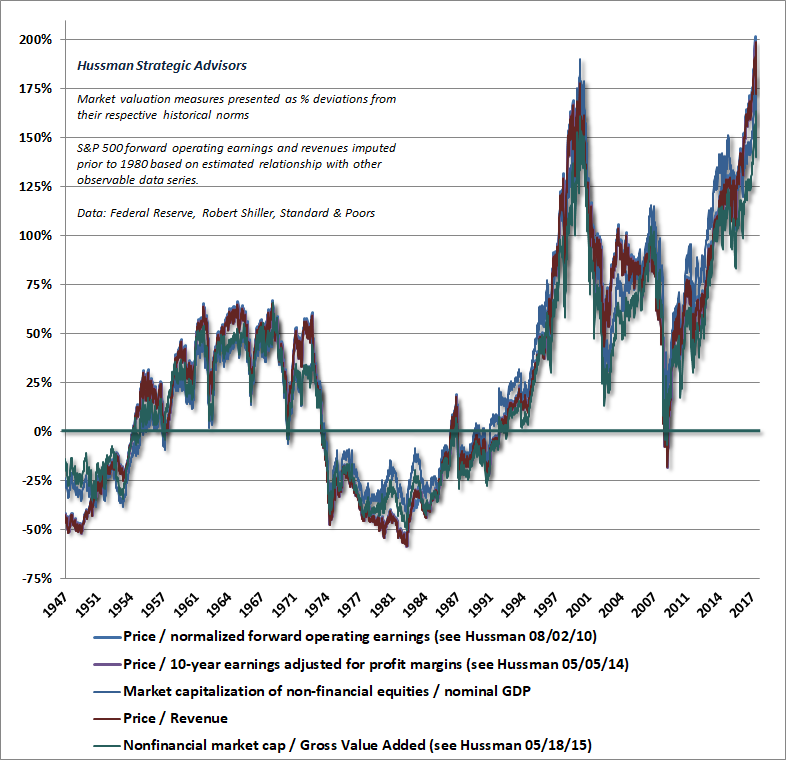
The most reliable measures of valuation we identify are now between 2.6 and 3.0 times their pre-bubble historical norms. No market cycle in history, not even in recent decades, has ended without bringing those measures within 20-40% of those norms (and usually below them). This implies that even a run-of-the-mill completion to the present market cycle can be expected to take the S&P 500 between 45% and 65% lower, even without breaking below historical valuation norms. Likewise, I fully expect that even after dividends, the total return of the S&P 500 over the coming 12-year period will be negative.
In a speculative market, it’s not the understanding of valuation, or economics, or market history that gets you into trouble. It’s the assumption that anybody cares.
Recall that the S&P 500 registered negative total returns for a buy-and-hold strategy during the nearly 12-year period from March 2000 until November 2011. I expect a similar consequence to emerge from current extremes. While investors seem eager to lock themselves into passive strategies that have performed well in the rear-view mirror of this extended climb to obscene valuations, I expect the greatest asset to investors in the coming decade will be adherence to a flexible approach that reduces risk in response to extreme valuation and divergent market action, and embraces risk in response to material retreats in valuation that are coupled with improvements in the uniformity of market action.
Durable Returns, Transient Returns
I recently observed in our Semi-Annual Report:
“By the completion of this market cycle, I doubt that there will be much talk of the ‘cost’ of getting out too early. The 2000-2002 collapse wiped out the entire total return of the S&P 500 – in excess of Treasury bill returns – all the way back to May 1996. The 2007-2009 collapse wiped out the entire total return of the S&P 500 – in excess of Treasury bill returns – all the way back to June 1995. We correctly anticipated the extent of both collapses. Frankly, I expect that the completion of the current cycle will wipe out the entire total return of the S&P 500 – in excess of Treasury bills – all the way back to roughly October 1997. That outcome would not even require our most reliable measures of valuation to revisit their historical norms. If there is something in the financial markets to be particularly optimistic about, it is the prospect of opportunities that will evolve over the completion of the current market cycle. The strongest expected market return/risk classifications we identify emerge when a material retreat in valuations is joined by an improvement in market action.”
I believe that a great deal of what investors count as paper wealth will prove to be wholly transient over the completion of this market cycle. I’ve often made the distinction between “durable” investment returns and transient ones. At any point in time, the cumulative long-term return of the stock market equals the gain that investors can reasonably assume will be durable (in that it is unlikely to be surrendered in the future), plus whatever market gain investors should assume will be entirely wiped out over the course of the present or future market cycles. As it turns out, those two components can be identified with surprising accuracy. What follows is an update of an analysis on this point that I presented in 2015.
We can understand the distinction between durable gains and transient gains by inspecting market history and asking this question: was the prevailing level of the stock market (or its cumulative total return) observed again at a later date? We define that level as “durable” only if it was not observed again in the future. By contrast, a market gain that is subsequently wiped out over the completion of the market cycle is clearly transient in hindsight.
Can investors identify the difference before the fact?
Durable market gains are associated with market advances toward historically normal valuations, while transient market gains are associated with market advances that move beyond historically normal valuations.
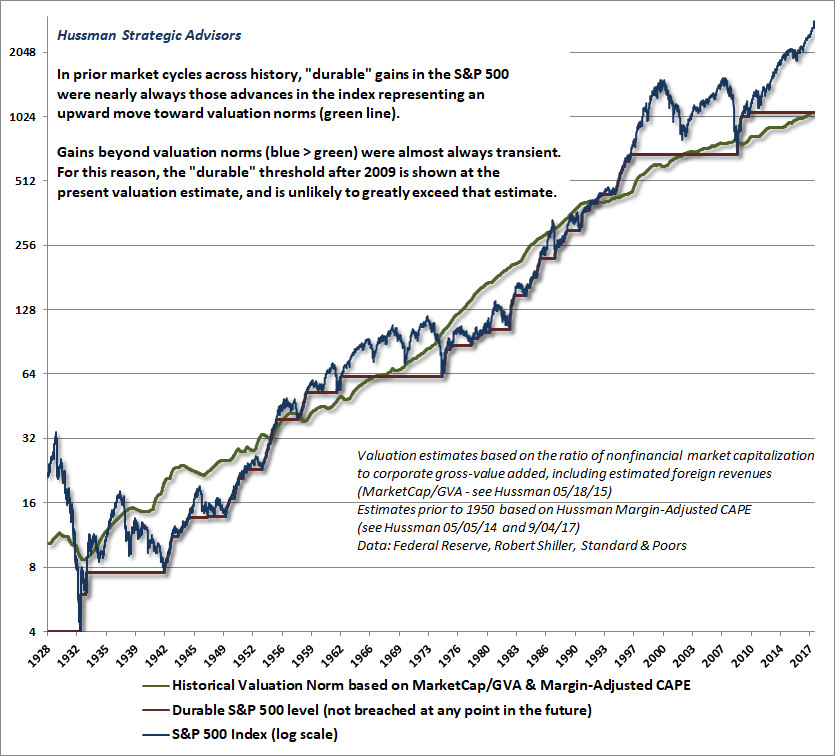
The chart below shows the S&P 500 Index (blue line) along with the “durable” portion of market gains in data since 1928 (red line). In cycles prior to the half-cycle advance since 2009, the level of the S&P 500 is identified as durable if the market never traded lower at any point in the future. The green line shows the estimated historical valuation norm of the S&P 500 on the basis of MarketCap/GVA (nonfinancial market capitalization / corporate gross value added), with data prior to 1950 based on our Margin-Adjusted CAPE.
Notice that the red line of durable S&P 500 market levels generally runs below the green line representing historical valuation norms. Indeed, points where the red line exceeds the green line are also typically points that usher in a long period of ultimately flat or weak average annual returns, with most of the market’s interim gains erased by the trough of some later market cycle. That’s exactly why the 2009 low was able to wipe out the entire total return of the S&P 500, in excess of Treasury bills, all the way back to June 1995. Investors shouldn’t have expected the interim gains to be durable in the first place. That’s also why I expect the completion of this cycle to wipe out the entire total return of the S&P 500, in excess of Treasury bills, all the way back to about October 1997.
This demonstrates one of the central lessons of value-conscious investing: durable market gains are associated with market advances toward historically normal valuations, while transient market gains are associated with market advances that move beyond historically normal valuations. Because of that historical regularity, the “durable” threshold after 2009 is shown at the present valuation norm, and is unlikely to greatly exceed that level, which just about one-third of the level the S&P 500 reached at its January high.
Risk is Not Return
With the recent market volatility (which is nothing compared with what we expect to observe over the completion of this cycle), we’ve observed a slight pickup in discussions about investment risk.
One view of risk, which is often used in portfolio theory, is to equate risk with volatility – basically thinking about potential investment returns as random draws from a hat, where risk is measured by the range of potential returns. With that definition of risk, the goal of “portfolio optimization” is to find the mix of assets that has the highest expected return, given an investor’s tolerance for “risk.” The immediate implication is that once that “optimal portfolio” is chosen, the only way to get a higher expected return is to take higher risk.
You’ll often hear risk being equated with return on financial television. The proposition takes various forms. “Higher risk means higher return” or “Well, you can only expect higher returns by taking more risk.” In my view, the idea that higher risk means higher expected return is one of the most dangerous and misunderstood propositions in the financial markets. The reason it’s dangerous is that it ignores the central condition: “provided that one is choosing between portfolios that all maximize expected return per unit of risk.”
Risk arises when markets go so high that prices imply losses rather than the potential rewards they should.
– Howard Marks
See, one of the most conventional “risky” assets investors can choose is the S&P 500. But by our estimates, that asset is priced at a level that’s consistent with negative 10-12 year total returns. Given that expected return, the S&P 500 would be largely excluded from an “optimal portfolio” on that time horizon, unless there was something else in the portfolio with a very high expected return that was negatively correlated with the S&P 500 (in which case, the S&P 500 might be included in order to reduce portfolio volatility). Here and now, it’s very true that the S&P 500 is a risky asset, but it’s madness to imagine that adding more of it to a portfolio will increase expected return, except for investors with very long horizons.
Yes, if market internals were to improve, one might accept a temporary market exposure even at these valuations, based on what we often call “speculative merit.” Likewise, if one has a very long horizon, one might accept market exposure on the view that a 200% valuation premium amortizes as a -3.6% reduction in annual returns over 30 years. Combining 4-5% nominal economic growth with 2-3% in dividend income, even a -3.6% reduction leaves the expected return on the S&P 500 above zero, and possibly competitive with the current Treasury bond yield on a 30-year horizon.
Still, on nearly all intermediate horizons, stocks just aren’t priced at a level that merits substantial inclusion into an “optimal portfolio.” Accordingly, they violate the central condition that’s required for one to believe that higher risk will result in higher expected return. Presently, the S&P 500 is both a high risk and a low expected return asset.
As Howard Marks observes in The Most Important Thing:
“Whereas the theorist thinks return and risk are two separate things, albeit correlated, the value investor thinks of high risk and low prospective return as nothing but two sides of the same coin, both stemming primarily from high prices. Thus, awareness of the relationship between price and value – whether for a single security or an entire market – is an essential component of dealing successfully with risk.
“Risk arises when markets go so high that prices imply losses rather than the potential rewards they should. In bull markets – usually when things have been going well for a while – people tend to say ‘Risk is my friend. The more risk I take, the greater my return will be. I’d like more risk, please.’ The truth is, risk tolerance is antithetical to successful investing. When people aren’t afraid of risk, they’ll accept risk without being compensated for doing so, and risk compensation will disappear.”
Warren Buffett recently expressed a related view of risk in Berkshire Hathaway’s 2017 annual report:
“Investing is an activity in which consumption today is foregone in an attempt to allow greater consumption at a later date. ‘Risk’ is the possibility that this objective won’t be attained.”
From that perspective, a conventional portfolio of passive assets (60% stocks, 30% bonds, and 10% cash) has never been more risky.
Assumptions matter. I recently saw a study suggesting that because interest rates are not carrying their usual weight in providing for retirement, investors can support a higher “withdrawal rate” by increasing their allocation to stocks. Here. At the most extreme valuations in history. That result assumes that future stock market returns have nothing to do with the level of market valuation.
In my view, there is a great deal of potential value in restraint – waiting for the opportunity, which has arrived in every market cycle across history, to expand exposure to market risk at the point where a material retreat in valuations is joined by an improvement in market action. I expect strong opportunities of that sort to emerge over the completion of the current market cycle.
The Arithmetic of Risk
As an investor’s investment horizon lengthens, however, a diversified portfolio of U.S. equities becomes progressively less risky.
– Warren Buffett
It’s useful to examine how the arithmetic of investment risk and return is affected by the holding period. Warren Buffett is quite correct in observing that stocks become less risky as the investment horizon becomes longer. Let’s examine what that actually means.
Suppose we measure valuation by comparing price P to some measure of earnings E that isn’t distorted by cyclical economic fluctuations, and can be used as a reliable, representative, “sufficient statistic” for long-term cash flows. Further, let’s assume that 60% of those earnings are paid out as dividends over time. Finally, let’s assume that fundamentals grow at a rate of 6% annually. Frankly, given my view that structural real GDP growth is actually approaching 1% annually, my expectation is that future nominal growth of GDP, earnings, and revenues will continue at rates closer to 4% annually, but let’s stick with 6% for the purpose of illustration.
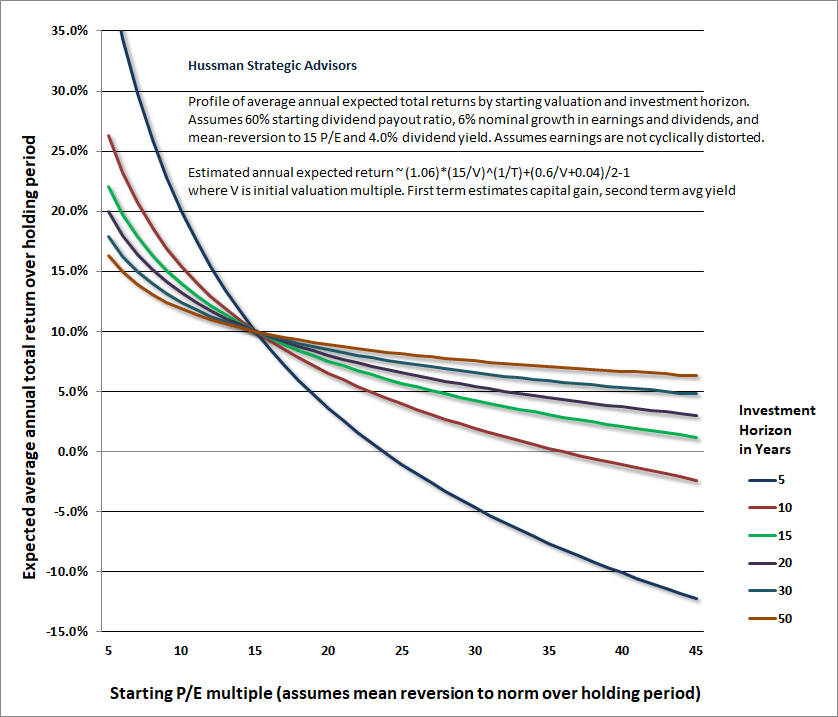
Suppose that we hold the P/E ratio constant at a multiple of say, 15. Well, given that E is growing at 6% annually, we know that P must be growing at 6% annually as well. That’s our “capital gain.” In addition, 60% of E is paid out as dividends, which works out to a dividend yield of 0.6/15 = 4.0%. Given these assumptions, the total return of the investment, given no deviation from a constant P/E multiple, will be 10% annually.
Now imagine that the P/E multiple is 20, but we expect it to return to 15 over the course of 2 years (it would be wonderful for investors if stocks were only overvalued to that extent). In that case, the decline in valuations has to be “amortized” over a 2-year period. Moreover, at P/E of 20, the dividend yield is 0.6/20 = 3.0% instead of 4.0%, so the average dividend yield over the 2-year period would be in-between. Given the modest overvaluation we’ve assumed, our rough estimate of average annual total returns over a 2-year period would be:
= (1+growth)(endingPE/startingPE)^(1/years)+(0.6/startingPE + 0.6/endingPE)/2–1
= (1.06)*(15/20)^(1/2)+(.03+.04)/2–1 = -4.7% annually.
If instead, we allow the decline in valuations to be “amortized” over a 30 year holding period, the same arithmetic would produce an expected 30-year average return of:
= (1.06)*(15/20)^(1/30)+(.03+.04)/2–1 = 8.5% annually.
It is exactly in this sense that lengthening the horizon creates a less risky portfolio. On a very long horizon, the effect of amortizing overvaluation or undervaluation just isn’t very large. Unless valuations are an extreme distance from their norms (as they are today), the effect of economic growth and dividend income is much stronger in determining total returns. On shorter horizons, though, changes in valuations have a far more powerful impact on investment returns. So market returns over a small number of years can experience enormous swings, but average annual returns appear much more stable when we examine a very long investment horizon.
The chart below shows this effect. Each line represents a different investment horizon, ranging from 5 years to 50 years. You’ll notice that the blue line (5 years) and the red line (10 years) show the greatest amount of variation in potential returns, while the orange line (50 years) is flatter, with a much smaller range except at extremely high or low valuations.
The next chart shows what this looks like in the real world. The valuation measure is my Margin-Adjusted CAPE, which substantially improves the reliability of Robert Shiller’s cyclically-adjusted P/E by accounting for variations in the embedded profit margin over time. The blue scatter shows actual 5-year S&P 500 total returns following various levels of valuation, in data since 1928. The red scatter shows actual 12-year returns in the same data.
As a side-note, we prefer a 12-year horizon when we discuss mean-reversion of valuations, because that’s the point where the “autocorrelation profile” of valuations hits zero (meaning that overvaluation or undervaluation most reliably washes out over that horizon). Notice that just as our arithmetic would indicate, the spread of potential returns becomes smaller as we extend the investment horizon.
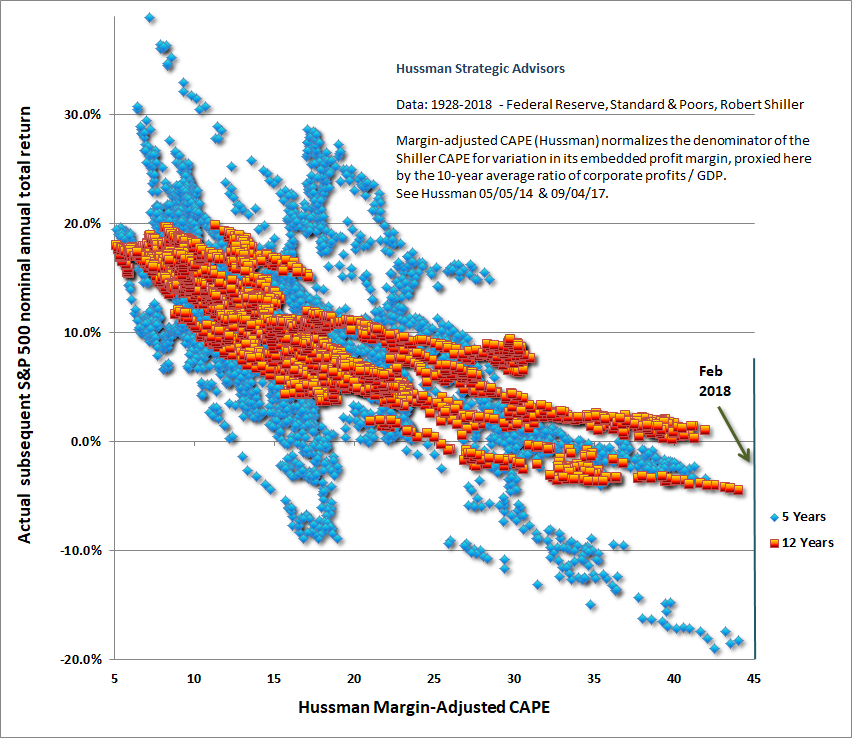
Notably, the Margin-Adjusted CAPE reached a level of 45 at the recent January high. To put this into perspective, and even assuming a 6% growth rate in fundamentals, the same arithmetic above implies expected 5-year S&P 500 total returns averaging -12.2% annually, with 10-year total returns averaging -2.4% annually. Those estimates, in my view, are just about right.
There’s a reason that the empirical chart looks so much like the theoretical one. The pre-bubble median of our Margin-Adjusted CAPE is indeed about 15, and that level is indeed associated with subsequent S&P 500 total returns of about 10% in market cycles across history. That 10% average represents about 6% from long-term growth, as measured peak-to-peak across economic cycles, and about 4% from dividend income. Given long-term factors that are likely to perpetuate growth rates much slower than historical norms (see prior comments for extensive detail), coupled with an S&P 500 dividend yield below 2%, my impression is that investors should expect average long-term S&P 500 total returns below 6% annually, even if valuations maintain a “permanently high plateau” at the most extreme levels in history.
More realistically, whether we examine a 5-year or a 10-year horizon, present valuations are so extreme that we now project negative S&P 500 total returns on both horizons. With valuations that, on our most reliable measures, ranged between 2.6 and 3.0 times their historical norms at the recent market high, normalizing valuations over a 10-year horizon implies a drag on the order of -9.1% to -10.4% below what equities would be expected to return at normal valuations. Indeed, even normalization over a 20-year horizon implies a drag on the order of -4.7% to -5.3% annually below what equities would be expected to return at normal valuations.
The strongest expected market return/risk classifications we identify emerge when a material retreat in valuations is coupled with an improvement in market action. We don’t require valuations to retreat to their historical norms, or even near them, to justify an exposure to the stock market. But here and now, even patient investors with very long horizons are positioned for disappointment, in my view. Accepting greater risk as a strategy to seek greater returns assumes that one is holding an optimal portfolio. Presently, I don’t believe that a conventional, passive investment mix qualifies. That will change as market conditions do, and we’re well prepared to embrace those opportunities.
Keep Me Informed
Please enter your email address to be notified of new content, including market commentary and special updates.
Thank you for your interest in the Hussman Funds.
100% Spam-free. No list sharing. No solicitations. Opt-out anytime with one click.
By submitting this form, you consent to receive news and commentary, at no cost, from Hussman Strategic Advisors, News & Commentary, Cincinnati OH, 45246. https://www.hussmanfunds.com. You can revoke your consent to receive emails at any time by clicking the unsubscribe link at the bottom of every email. Emails are serviced by Constant Contact.
The foregoing comments represent the general investment analysis and economic views of the Advisor, and are provided solely for the purpose of information, instruction and discourse.
Prospectuses for the Hussman Strategic Growth Fund, the Hussman Strategic Total Return Fund, the Hussman Strategic International Fund, and the Hussman Strategic Dividend Value Fund, as well as Fund reports and other information, are available by clicking “The Funds” menu button from any page of this website.
Estimates of prospective return and risk for equities, bonds, and other financial markets are forward-looking statements based the analysis and reasonable beliefs of Hussman Strategic Advisors. They are not a guarantee of future performance, and are not indicative of the prospective returns of any of the Hussman Funds. Actual returns may differ substantially from the estimates provided. Estimates of prospective long-term returns for the S&P 500 reflect our standard valuation methodology, focusing on the relationship between current market prices and earnings, dividends and other fundamentals, adjusted for variability over the economic cycle.